by Jurrien Timmer, Director of Global Macro, Fidelity Investments
It's possible the long-awaited recession may occur much later than expected.
Key takeaways
- The strength in stocks this year is at odds with rising Treasury rates and with the potential for further rate hikes.
- The rally in stocks seems to be based on an expectation for a recovery in earnings by 2024.
- If earnings recover as the consensus expects, and if we do get a soft landing, then it's possible stocks could be on the road to new highs.
- But there's also a possibility that recession still comes—only much later than expected—in which case this year's rally may have gotten ahead of itself.
While we're now into the second half of the year, with every passing week the market seems to be sending only increasingly contradictory signals on what may lie ahead.
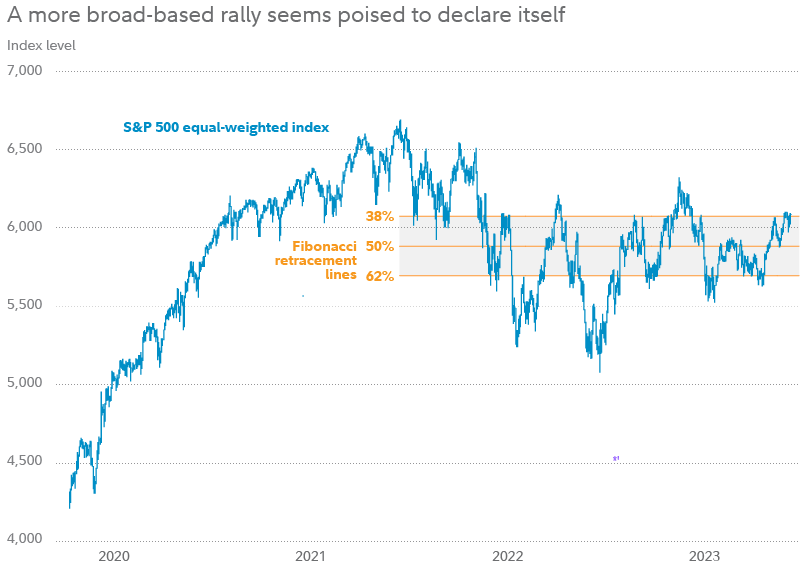
Just last week presented a study in contrasts. On the side of the bulls, the S&P® 500 equal-weighted index has seemed to be on the cusp of breaking through resistance to the upside. That is notable because this year's rally in major market-cap-weighted indexes has largely been driven by just a handful of mega-cap names. A rally in equal-weighted indexes would suggest a more broad-based, and potentially sustainable, rally.
Past performance is no guarantee of future results. Fibonacci retracement lines represent potential support and resistance levels based on the mathematical relationship within the Fibonacci sequence. Percent levels are based on the difference between the market high in January 2022 and the market low in October 2022, with 38% representing a potential resistance level and 62% representing a potential support level. Source: FMRCo., Bloomberg, Haver Analytics.
But on the side of the bears, the bond market said "not so fast," with yields spiking up on Treasurys of a variety of maturities. Several data points have come out in the past few weeks suggesting that the economy and employment still remain surprisingly resilient, and a particularly strong private-sector jobs report was released last week. This has all pointed to the possibility of inflation remaining stubborn, and further reinforced the potential for more rate hikes.
Higher interest rates, of course, not only increase the cost of capital and potentially increase the likelihood of recession—they also impact the fair value of stocks, via the discounted cash-flow model. And yields have been pushing higher whether looking at "nominal" (or non-inflation-adjusted) yields, or at "real" (or inflation-adjusted) yields.
So how can stocks break out while the interest-rate environment is getting more hostile? As the chart below shows, the cost of capital has risen almost everywhere—including for mortgage rates. How can stocks be zigging while rates are zagging?
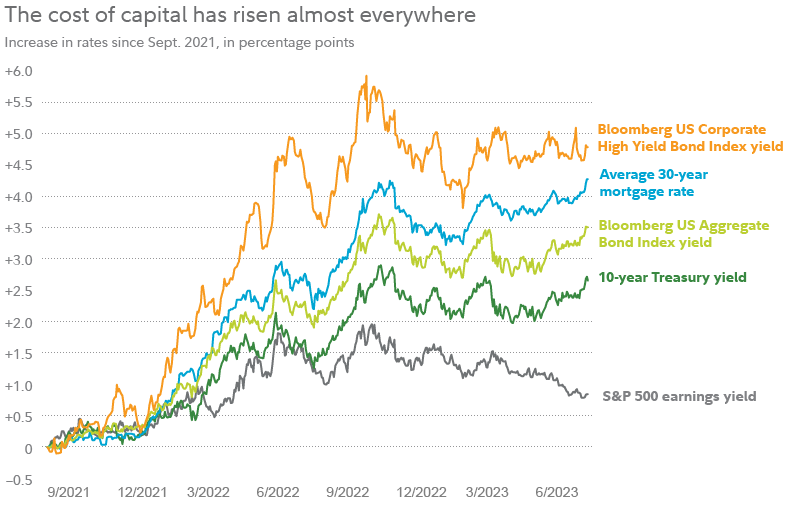
A basis point is one 100th of a percentage point. Earnings yield is defined as earnings divided by stock price, and is calculated using consensus earnings estimates for the next 12 months. See additional disclosures below for index definitions. Source: FMRCo., Bloomberg, Haver Analytics.
Ignoring rates and focusing on earnings
While the current disconnect between stock prices and rates is clear, it's also explainable. As the chart below shows, stock valuations had been anchored to interest rates until around last year's October low (the blue and purple lines show estimates of "fair value" price-earnings ratios (P/Es) for the S&P 500 based on regression models using interest rates).
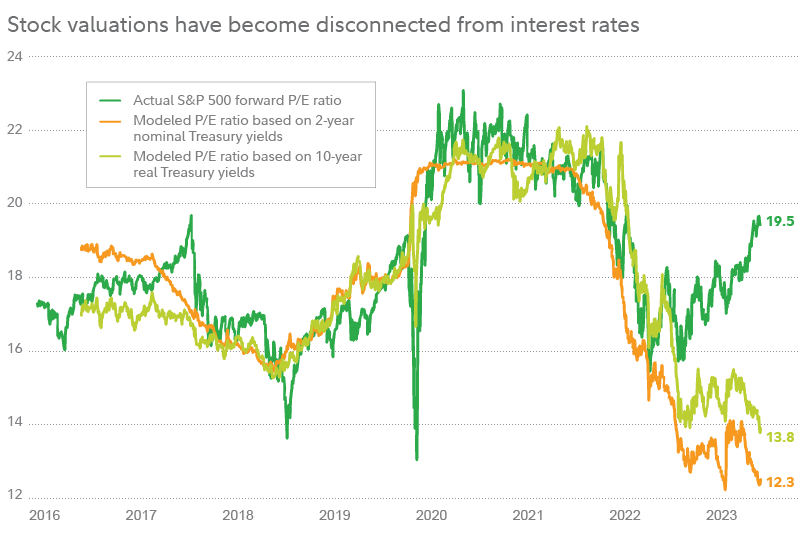
Past performance is no guarantee of future results. Forward P/E ratio is based on consensus earnings estimates for the next 12 months. Modeled P/E ratios are calculated using exponential regression models, with the referenced interest rates as independent variables. Nominal yields mean yields that have not been adjusted for the impact of inflation, while real yields mean yields that have been adjusted for inflation. Source: FMRCo., Bloomberg.
But in more recent months, stocks have moved away from anchoring to interest rates, and have been instead focusing on hopes of a recovery in earnings.
This means that for this bullish pivot to be justified, earnings are going to need to come through. Currently, the consensus estimate is that S&P earnings will contract by 9% in the second quarter and then bottom in the third quarter of this year, before recovering in 2024. If that is correct, then the rise in stocks and increase in P/Es that we have seen since last October could be justified and could continue.
A possible path to new highs?
Looking at past early-cycle recoveries—the period when the market is bouncing off of bear-market lows and when gains are typically driven by expanding P/E ratios—it's common, historically, to see P/Es rise by close to 50%. While past performance is never a guarantee of future results, if that pattern holds true in this advance, we could see the forward P/E rise to about 22 times earnings. Based on 2024 expected S&P earnings per share of $240, a 22 P/E ratio could take the index well above its January 2022 all-time high.
We will start to get a sense of how earnings are holding up in the coming days and weeks, now that second-quarter earnings season is getting underway. To be sure, investors will be watching for whether Q2 can deliver the same kind of positive surprise we saw in Q1.
Waiting on rates, waiting on recession
Coming back to the disconnect between stocks and interest rates, another way to look at it is with indexes of "financial conditions." Rather than looking only at interest rates, these indexes take a more holistic look at an assortment of financial conditions, to give a view on how monetary policy and overall financial conditions may impact GDP.
One of my preferred measures of financial conditions, the Goldman Sachs Financial Conditions Index, is back at levels first seen a year ago, when the market was expecting the Fed to take rates only as high as about 4%. Yet today, markets are expecting it to take rates as high as 5.4%.
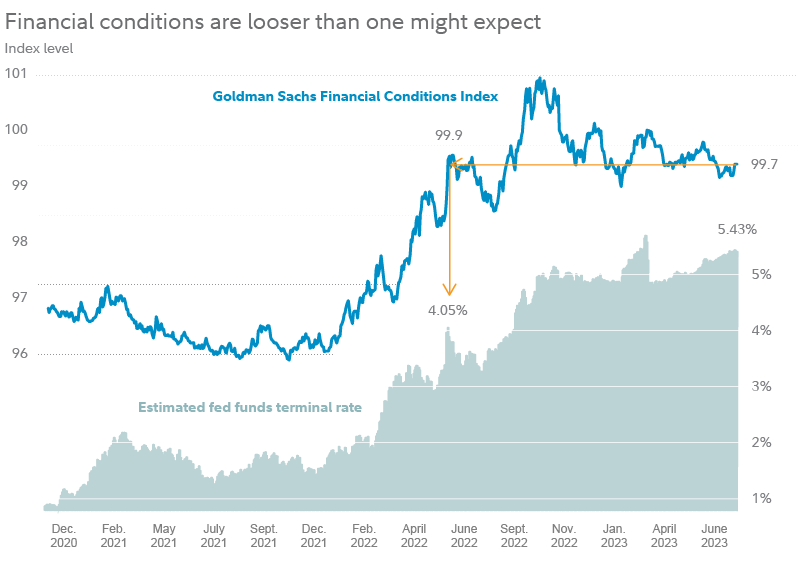
See additional disclosures below for definition of the Goldman Sachs Financial Conditions Index. The "terminal rate" is the final targeted rate range, or high point, for the fed funds rate during a rate-hiking cycle. Estimated terminal rate is based on estimates compiled by Morgan Stanley. Source: FMRCo., Bloomberg, Haver Analytics.
This suggests that despite how far the Fed has already gone, monetary policy is not actually as restrictive as we all may think.
If that's true, then the good news is that any recession may be further away than we all think. But the counterpoint might be that the Fed could have to go even further than the market currently has priced in. Could we see a fed funds rate of 6% or more?
Risks if the bounce in valuations is premature
But with interest-rate expectations now turning more hawkish, earnings do need to come through. The rise in valuations in the past few months can be justified if we do indeed see a soft landing, but not so much if we ultimately get a hard landing.
History shows the risk if P/E ratios recover too soon. In the 2000 to 2002 bear market, for example, there was a premature recovery on the valuation side just before the bottom fell out for earnings—making for an all-the-more-painful decline.
The ultimate irony in this weird market cycle could be if the recession that many investors have been positioned for does eventually happen, but only after the consensus has capitulated to the bullish side and the market has reached a new high.


