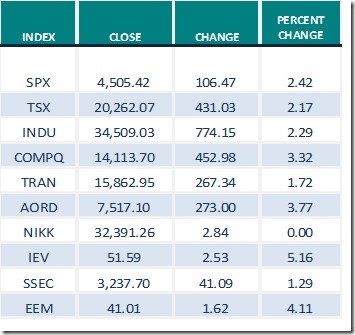
Pre-opening Comments for Monday July 17th
U.S. equity index futures were lower this morning. S&P 500 futures were down 5 points at 8:35 AM EDT.
Index futures were unchanged following release of the July Empire State manufacturing survey at 8:30 AM EDT. Consensus was unchanged versus a gain of 6.6 in June. Actual was a gain of 1.1.
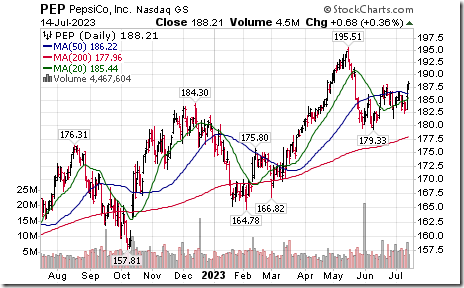
Pepsico slipped $2.21 to $186.00 after Morgan Stanley downgraded the stock
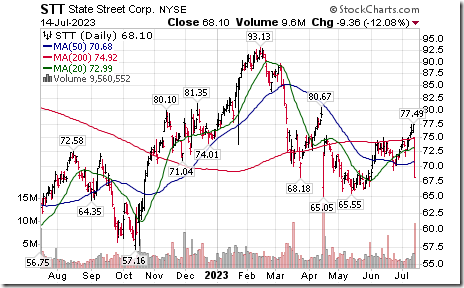
State Street dropped $1.41 to $66.69 after Morgan Stanley downgraded the stock from Neutral to Underweight.
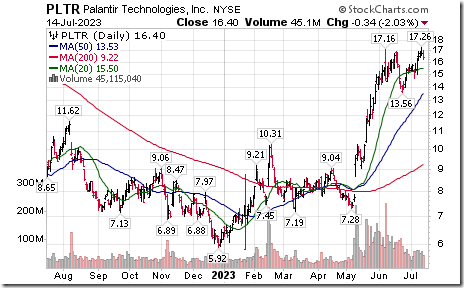
Palantir added $0.02 to $16.42 after Mizuho raised its target price from $8 to $14.
Intuitive Surgical added $0.40 to $354.40 after Mizuho raised its target price from $300 to $370.
EquityClock’s Daily Comment
Headline reads “Shipping expenditures have fallen by the most on record through the first half of the year, a testament to the slowing business and consumer economies”.
http://www.equityclock.com/2023/07/16/stock-market-outlook-for-july-17-2023/
The Bottom Line
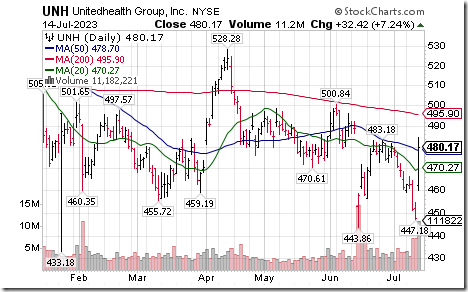
Here come second quarter results! Early responses to better than consensus reports released last week were encouraging with nice gains recorded by Pepsico, Delta Airlines, UnitedHealth Group and JP Morgan. However, selling pressures appeared on Friday: Selected stocks sold down sharply after reporting less than consensus quarterly results. Notable was weakness in Bank of New York Mellon and State Street.
Consensus for Earnings and Revenues for S&P 500 Companies
Source: www.Factset.com
Estimates changed slightly after 6% of S&P 500 companies reported second quarter results last week. Consensus for the second quarter earnings improved from a drop of 7.2% to a drop of 7.1%. Second quarter revenues are expected to drop 0.4% (versus a drop of 0.3% last week). Consensus for the third quarter calls for an earnings increase of 0.1% (versus a previous estimated gain at 0.3%). Revenues are expected to increase 1.1% (versus 1.2% last week). Consensus for the fourth quarter calls for a 7.6% increase in earnings. Fourth quarter revenues are expected to increase 5.0% (versus previous estimate at 4.9%). For all of 2023, consensus calls for an earnings increase of 0.6% (versus previous estimated gain at 0.8%). Revenues are expected to increase 2.4% (versus previous estimated gain at 2.3%.
The recovery in earnings continues into 2024. Consensus for 2024 calls for a 12.4% increase in earnings. Consensus for revenue growth is 5.0% (versus previous estimate at 4.9%).
Economic News This Week
Source: www.Investing.com
July Empire Manufacture Survey released at 8:30 AM EDT on Monday is expected to be unchanged versus a gain of 6.60 in June.
June U.S. Retail Sales released at 8:30 AM EDT on Tuesday are expected to increase 0.5% versus a gain of 0.3% in May.
Canadian June Consumer Price Index on a year-over-year basis released at 8:30 AM EDT on Tuesday is expected to increase 2.9% versus a gain of 3.7% in May.
June U.S. Industrial Production released at 9:15 AM EDT on Tuesday is expected to decline 0.1% versus a decline of 0.2% in May. June Capacity Utilization is expected to slip to 79.5% from 79.6 in May.
May Business Inventories released at 10:00 AM EDT on Tuesday are expected to increase 0.1% versus a gain of 0.2% in April.
U.S. June Housing Starts released at 8:30 AM EDT on Wednesday are expected to slip to 1,450,000 units from 1,631,000 units in May.
July Philly Fed released at 8:30 AM EDT on Thursday is expected to improve to -9.7 from -13.7 in June
June U.S. Existing Home Sales released at 10:00 AM EDT on Thursday are expected to slip to 4.23 million units from 4.30 million units in May.
June U.S. Leading Economic Indicators released at 10:00 AM EDT on Thursday are expected to decline 0.5% versus a decline of 0.7% in May.
May Canadian Retail Sales are released at 8:30 AM EDT on Friday
Selected Earnings News This Week
Source: www.investing.com
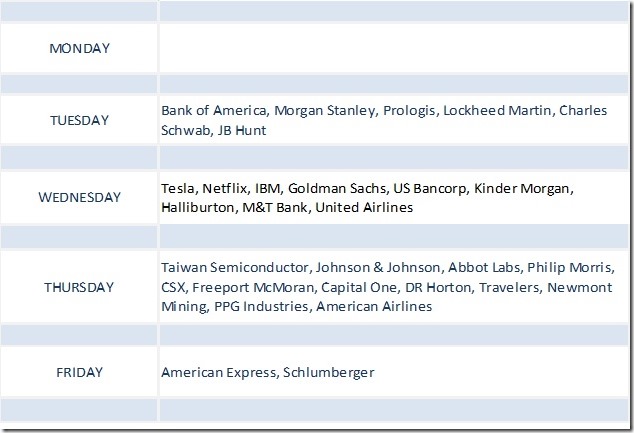
Six percent of S&P 500 companies have reported to date. Another 60 companies are scheduled to report quarterly results this week (including five Dow Jones Industrial Average companies).
No TSX 60 companies are scheduled to report this week.
Trader’s Corner
Equity Indices and Related ETFs
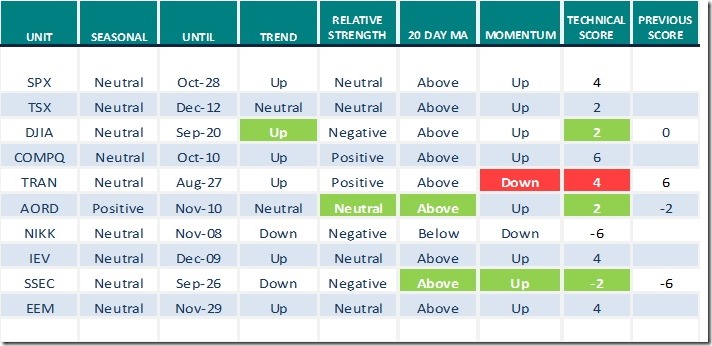
Daily Seasonal/Technical Equity Trends for July 14th 2023
Green: Increase from previous day
Red: Decrease from previous day
Source for all positive seasonality ratings:www.EquityClock.com
Commodities
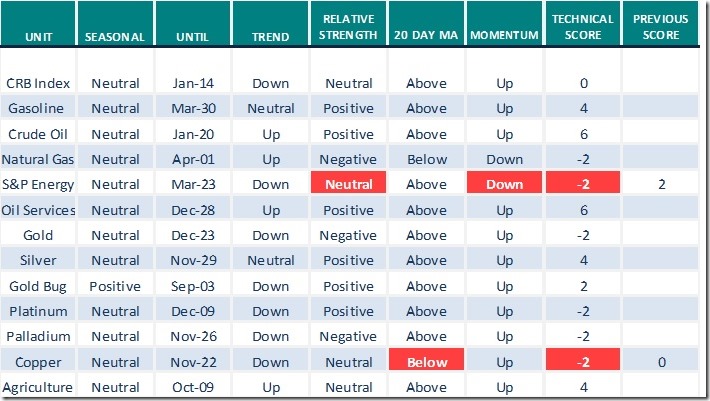
Daily Seasonal/Technical Commodities Trends for July 14th 2023
Green: Increase from previous day
Red: Decrease from previous day
Sectors
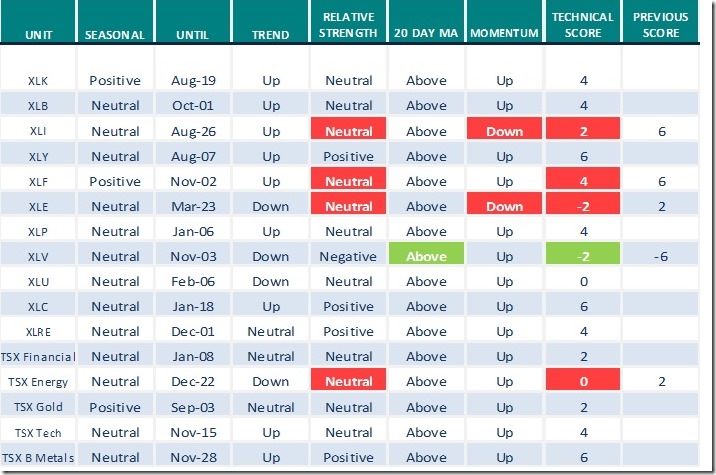
Daily Seasonal/Technical Sector Trends for July 14th 2023
Green: Increase from previous day
Red: Decrease from previous day
Wolf on Bay Street
Don Vialoux was a guest last Thursday on “Wolf on Bay Street”. The interview was released on Wolfgang Klein’s weekly show on Corus radio on Sunday. Following are notes for the interview
U.S. and Canadian equity markets currently are in the summer rally period:
- The period usually starts in the last week in June and ends on the last day of July
- July is the third strongest month in the year for the S&P 500 and TSX Composite
- Strength is related to anticipation of strong second quarter revenue and earnings reports following the traditional economic recovery in Spring.
- What about this year? Second quarter results by major Canadian and U.S. companies are a concern this year. Reports start to trickle in next week. Earnings on a year-over-year basis have been dropping. Consensus for second quarter earnings by S&P 500 companies calls for a year-over-year drop of 7.2%.
- Surprisingly, initial quarterly reports likely could be greeted favourably by equity markets. Focus next week is on reports by the largest U.S. Banks including Bank of America, Morgan Stanley, Goldman Sachs and Bank of New York Mellon. Their recent passage of liquidity tests administered by the Federal Reserve once again will allow them to resume share buybacks and dividend increases. Technical action by the group last week indicates anticipation of good news when their second quarter results are released. The ETF holding these securities, S&P Bank SPDRs (Symbol: KBE) completed a classic reverse Head & Shoulders pattern last Wednesday.
- Thereafter, the report season could be uncertain for equity prices. Notable will be responses to reports released by the “Magnificent Seven” (i.e. Apple, Microsoft, Nvidia, Netflix, Tesla, Amazon and Facebook). They represent a 28% weight in the S&P 500 Index. All have recorded exceptional share price gains since the beginning of the year. Technically, they are Overbought and vulnerable to a short term correction into this fall.
- Investors also are cautious about impact of central bank efforts to lower inflation expectations. The Bank of Canada raised its rate for major banks by 0.25% to 5.00% on Wednesday. The Federal Reserve is expected to increase its Fed Fund Rate at its next meeting on July 26th by another 0.25% and possibly by 0.50%.
- The earnings picture for North American companies is not all bad. Consensus calls for a recovery in earnings by S&P 500 companies on a year-over-year basis from a 7.2% drop in the second quarter to break even in the third quarter to a gain of 12.4% in the fourth quarter. Moreover, analysts are calling for another 12.4% increase in earnings in 2024.
- Technical measures of market sentiment show that U.S. and Canadian equity markets currently are overbought. CNN has developed a Fear and Greed Index for the S&P 500 ranging from 0 for maximum fear and 100 for maximum greed. Currently the index is at 79, indicating Extreme Greed.
- Preferred strategy for investors given current equity market conditions is to be patient. Enjoy your summer holiday despite chances for small losses in Canadian and U.S. equity prices. Look for opportunities to buy favoured equities and Exchange Traded Funds on weakness between now and October when seasonal influences once again become positive.
Links offered by valued providers
Emerging Market Bond Fund ETFs Look Good JULY 14, 2023 Greg Schnell
Emerging Market Bond Fund ETFs Look Good | The Canadian Technician | StockCharts.com
Michael Campbell’s Money Talks for July15th
Michael Campbell’s MoneyTalks – Complete Show (mikesmoneytalks.ca)
Earnings Season in Full Swing: What You Can Expect JULY 14, 2023
Jayanthi Gopalakrishnan
Earnings Season in Full Swing: What You Can Expect | ChartWatchers | StockCharts.com
Technology Long-Term Double-Top? JULY 10, 2023 Erin Swenlin
Technology Long-Term Double-Top? | DecisionPoint | StockCharts.com
David and Goliath, or the Small vs. Large Caps JULY 14, 2023 Mish Schneider
David and Goliath, or the Small vs. Large Caps | Mish’s Market Minute | StockCharts.com
Bank Earnings Showdown: Emerging Trends You Need To Know JULY 12, 2023
Jayanthi Gopalakrishnan
Bank Earnings Showdown: Emerging Trends You Need To Know | ChartWatchers | StockCharts.com
Investment Themes For The Third Quarter | Bruce Fraser | Power Charting (07.14.23)
Investment Themes For The Third Quarter | Bruce Fraser | Power Charting (07.14.23) – YouTube
Watch For This Going Into Earnings Season | Danielle Shay | Your Daily Five (07.13.23)
Watch For This Going Into Earnings Season | Danielle Shay | Your Daily Five (07.13.23) – YouTube
Bob Hoye Jul 14, 2023: A Shocking Glut of Electric Vehicles in US
A Shocking Glut of Electric Vehicles in US – HoweStreet
Mark Leibovit Jul 13, 2023: Why Crypto Currencies Have Suddenly Taken Off
Why Crypto Currencies Have Suddenly Taken Off – HoweStreet
Victor Adair July 15, 2023 | Trading Desk Notes For July 15, 2023
Trading Desk Notes For July 15, 2023 – HoweStreet
Technical Scoop for July 17th from David Chapman and www.EnrichedInvesting.com
Technical Scores
Calculated as follows:
Intermediate Uptrend based on at least 20 trading days: Score 2
(Higher highs and higher lows)
Intermediate Neutral trend: Score 0
(Not up or down)
Intermediate Downtrend: Score -2
(Lower highs and lower lows)
Outperformance relative to the S&P 500 Index: Score: 2
Neutral Performance relative to the S&P 500 Index: 0
Underperformance relative to the S&P 500 Index: Score –2
Above 20 day moving average: Score 1
At 20 day moving average: Score: 0
Below 20 day moving average: –1
Up trending momentum indicators (Daily Stochastics, RSI and MACD): 1
Mixed momentum indicators: 0
Down trending momentum indicators: –1
Technical scores range from -6 to +6. Technical buy signals based on the above guidelines start when a security advances to at least 0.0, but preferably 2.0 or higher. Technical sell/short signals start when a security descends to 0, but preferably -2.0 or lower.
Long positions require maintaining a technical score of -2.0 or higher. Conversely, a short position requires maintaining a technical score of +2.0 or lower
Changes Last Week
Technical Notes for Friday
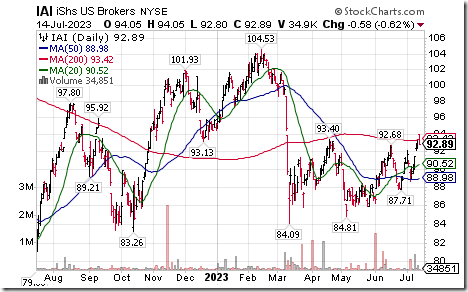
U.S. Broker iShares $IAI moved above $93.40 setting an intermediate uptrend.
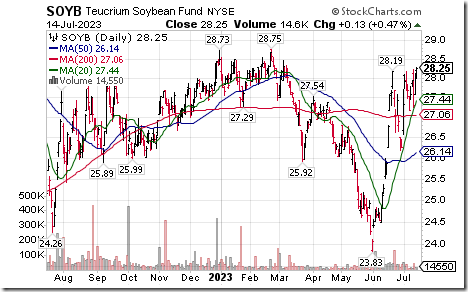
Soybean ETN $SOYB moved above $28.19 extending an intermediate uptrend.
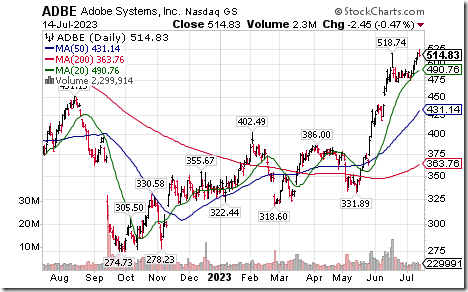
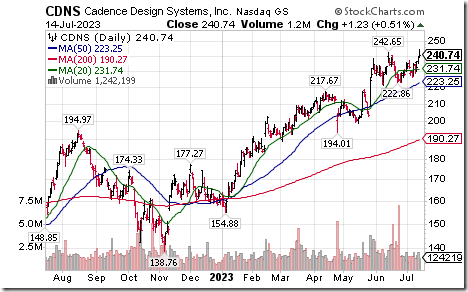
Selected NASDAQ 100 stock moved above intermediate resistance extending uptrends. Align moved above $368.87. Adobe moved above $518.74. Cadence Design Systems moved above $242.65 to an all-time high.
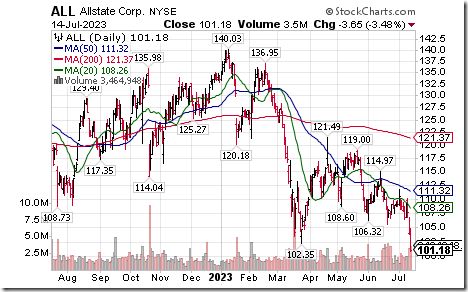
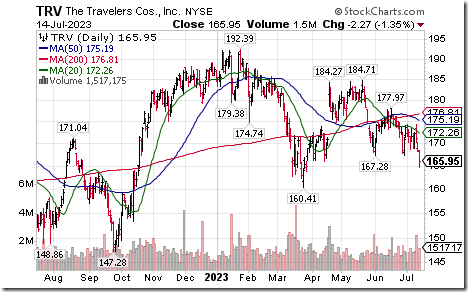
Insurance stocks were under technical pressure. Allstate $ALL moved below $102.35 extending an intermediate downtrend. Travelers $TRV moved below $167.28 extending an intermediate downtrend.
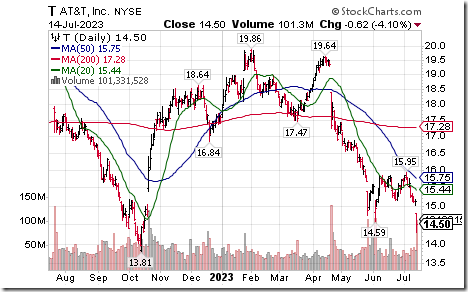
AT&T $T an S&P 100 stock moved below $14.59 extending an intermediate downtrend. The stock was downgraded by JP Morgan Chase.
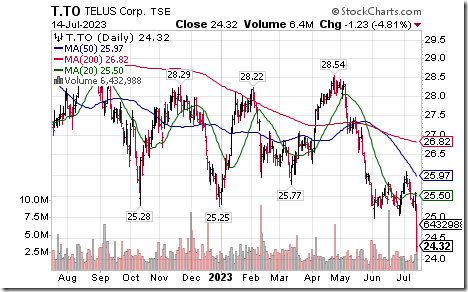
Telus $T.TO a TSX 60 stock moved below Cdn$25.21 extending an intermediate downtrend.
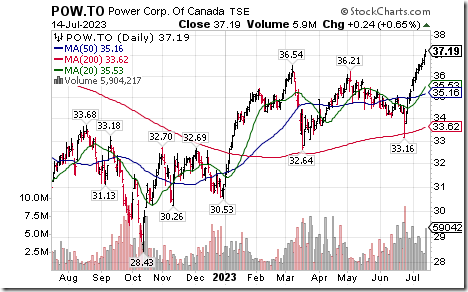
Power Corp $POW.TO a TSX 60 stock moved above Cdn$36.54 extending an intermediate uptrend.
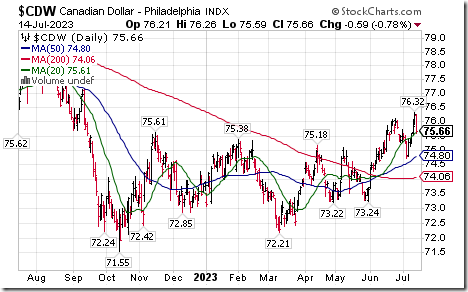
The Canadian Dollar unexpectedly recorded a sharp sell off on Friday.
S&P 500 Momentum Barometers
The intermediate Barometer slipped 1.80 on Friday, but gained 10.20 last week to 83.20. It remains Overbought. Daily trend remains up.
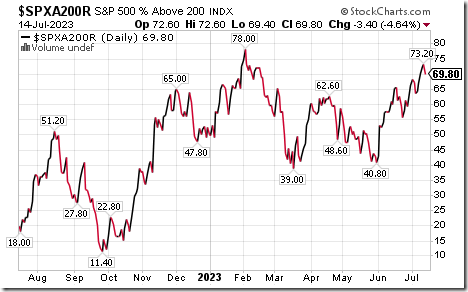
The long term Barometer dropped 3.40 on Friday, but gained 5.40 last week to 69.80. It remains Overbought. Daily trend remains up.
TSX Momentum Barometers
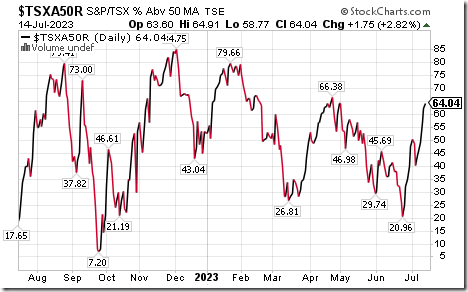
The intermediate term Barometer added 1.75 on Friday and 10.53 last week to 64.04. It changed from Neutral to Overbought on a move above 60.00. Daily trend remains up.
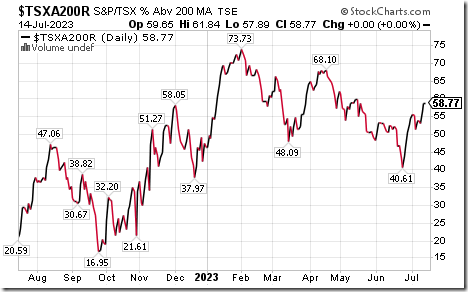
The long term Barometer was unchanged on Friday and added 5.26 last week. It remains Neutral. Daily trend remains up.
Disclaimer: Seasonality ratings and technical ratings offered in this report and at
www.equityclock.com are for information only. They should not be considered as advice to purchase or to sell mentioned securities. Data offered in this report is believed to be accurate, but is not guaranteed


