by Rick Rieder, CIO, Global Fixed Income, and Russell Brownback, Head of Global Macro, Fixed Income, BlackRock
Key takeaways
- The exit from a decade of very low interest rates, via the most aggressive hiking cycle since 1980 has laid bare the distorted financing incentives that became entrenched in the years between the Global Financial Crisis in 2008 and the end of pandemic-era monetary policies in 2022.
- Still, while financial sector leverage is high, private sector leverage, especially in households and corporations, is low, and employment is quite healthy.
- That leaves the Federal Reserve in the unenviable position of having to administer a single monetary policy to a resilient real economy that relies on a weaker financial economy for its funding, and in this commentary, we examine the investment implications that follow from this dynamic.
Rick Rieder and team argue that one of the most important questions investors should ask today is “Am I getting paid back for the risk I am taking?”
When investors in regional banks and 1-month U.S. Treasury bills alike are kept awake at night by the same concern – Getting Paid Back – it is a rare moment indeed. Yet, such was the environment in financial markets in May, when it seemed that market participants up and down the capital stack were rediscovering this basic tenet of investing, as uncertainty grew around the solvency of both regional banks (in the wake of First Republic’s rescue) and the U.S. government (in the face of a debt ceiling that needed to be raised).
While Treasury investors’ worst fears have since been allayed, financing conditions have remained tight for regional banks and other sectors deemed to have weaker fundamentals by the market, such as commercial real estate (CRE). Still, rather than being harbingers of economic doom, the fears around getting paid back in both regional banks and CRE are symptoms of a structural evolution in credit creation – away from the banking system and toward private pools of capital and capital markets themselves – a shift that has been rapid, volatility-inducing, and yes, potentially painful for entities on the wrong side of it.
The latest catalyst for this shift has been the exit from a decade of very low interest rates, via the most aggressive hiking cycle since 1980. It has laid bare the distorted financing incentives that became entrenched in the years between the Global Financial Crisis (GFC) in 2008 and the end of pandemic-era monetary policies in 2022. During that period, 1–3-year investment grade credit yields barely exceeded 3%, a rate below the growth rate of the economy. Most investors have much higher return targets, explaining why higher yielding alternatives like private credit and venture capital ballooned from backwater financing vehicles into the primary client markets for banks like SVB.
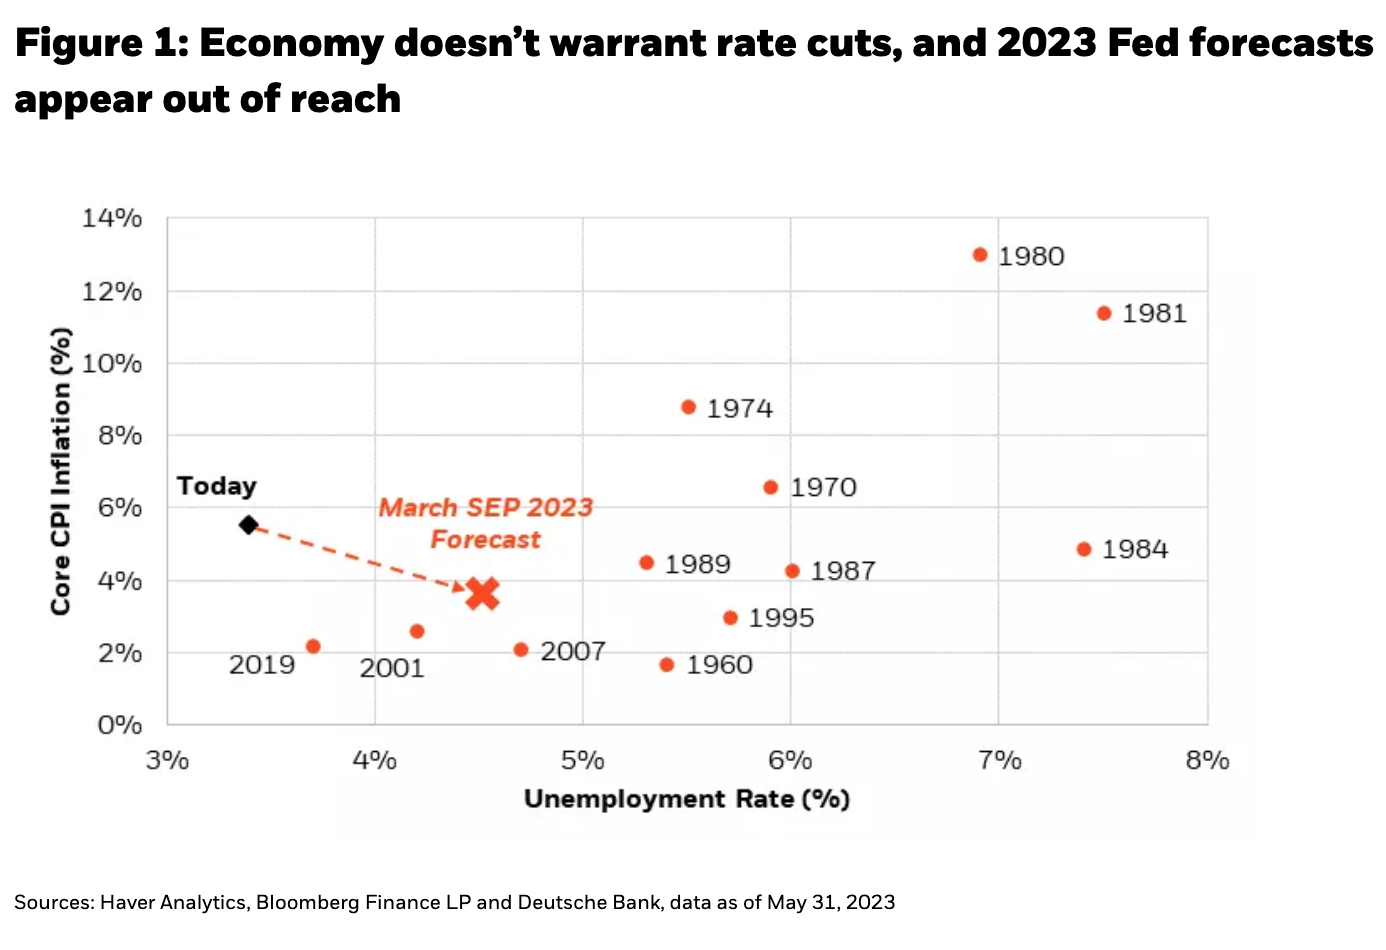
However, we should not mistake levered “shadow banking” capital bases that were built during the era of low rates, and that are now deflating, for an indication of the health of the economy in general. While financial sector leverage is high, private sector leverage, especially in households and corporations, is low, and employment is still quite healthy. Nonetheless, this leaves the Federal Reserve in the unenviable position of having to administer a single monetary policy to a resilient real economy that relies on a weaker financial economy for its funding. In recognition of the former, the Fed raised its economic projections at its June meeting. Against that backdrop, interest rate cuts that are being priced in by the market over the next 6-9 months are looking increasingly improbable, barring an unforeseen catastrophe (see Figure 1).
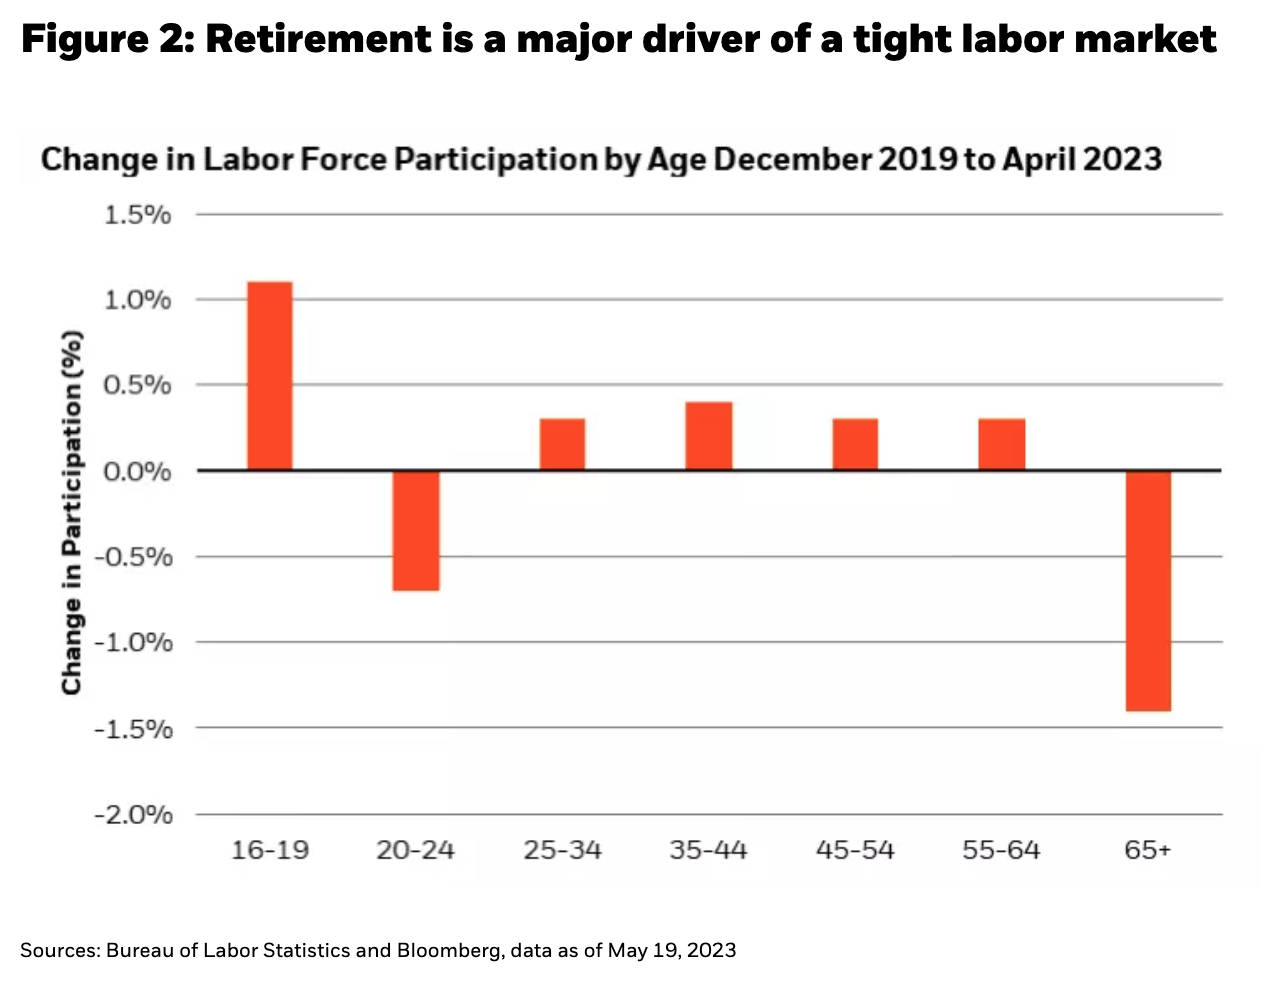
The fact remains that the labor market is still very tight. The unemployment rate is near a record low and the lowest wage earners are seeing their wages grow the fastest – trends that the Fed should look to preserve even as it seeks to quell inflation. Labor market tightness is aided in part by a demographic trend that is difficult to reverse (see Figure 2). Three million more Baby Boomers retired during the pandemic than would otherwise have been expected to, keeping labor supply tight. Meanwhile, several service sectors have yet to recover from the damage they sustained during the pandemic, creating robust demand for labor in those areas. One potential avenue to boost the supply of labor would be if retirees came out of retirement and back into the labor force. However, since a retiree can earn 5% to 6% on their savings, without having to take much credit or duration risk today, this presents a hurdle for convincing many retirees to return. Indeed, we find that a nest egg of just over $600,000 (the lowest amount in 16 years) is enough to deliver half of the median household income in interest payments.
On the demand side, there is some negative convexity around creating the degree of demand destruction necessary to offset the strong structural employment trends at play. It would require forcing sectors with very large headcounts and that are still understaffed relative to pre-pandemic trends, to lay off workers (the Fed’s 2023 unemployment rate projection suggests that a bit less than 2 million workers would be laid off by year end). Above-trend employment today lies in smaller industries, like information and financial services, and eliminating that surplus does not amount to “enough” jobs lost. For a “large enough” loss in headcount, firing would have to come from already below-trend sectors that can ill afford to lose people. If forced to happen, a big contraction in these larger industries like leisure, hospitality, education, and healthcare, would probably be a severe outcome for the economy, since even a small percentage of jobs lost in these industries would amount to a large number of layoffs overall.
Rather than crushing the labor market in an attempt to bring inflation to a hard stop, it is possible that immigration can help balance labor supply and demand over time, while simultaneously nudging up the growth trajectory of the economy. The Congressional Budget Office (CBO) raised its estimate for population growth of the 25–54-year-old cohort by 1.1 million people in just the last year, with “upward revisions to the size of the population aged 25 to 54 stemming from higher projected net immigration.” This would be a meaningful contribution toward reducing the remaining supply/demand imbalance in the labor market – as well as creating more customers for essential goods and services, such as food, clothing, shelter, healthcare and education.
Reasons to believe economic resilience goes beyond the labor market
The structural forces keeping recession at bay are not unique to the labor market. Government spending is also on a glide path that makes it hard to envision a big economic contraction. Discretionary spending is already a fraction the size of mandatory obligations, like Social Security and Medicare, with little room to cut, leaving officials a choice between reneging on promised entitlements, defaulting on debt service, or monetizing the inevitable debt (the most likely outcome, in our view). While questions around the debt burden and its sustainability are certainly valid, perhaps just as important as “how much spending?” is the question “where is it being spent?” Discretionary spending is small, but a lot of it is going toward areas like infrastructure. Indeed, more than $300 billion will be spent on infrastructure in the next four years as part of various programs. Infrastructure has one of the highest growth multipliers attached to it, because it can enhance productivity, creating a ripple effect through the economy (think highways, airports and port facilities). At the high end of the CBO’s estimates, the $300 billion could be multiplied into roughly $660 billion worth of economic activity. The economy is given its best chance to “grow out of debt” if that debt is spent on productivity-enhancing investment.
Follow Rick Rieder on Twitter
Today, the private sector surpasses the government when it comes to productivity-enhancing investment in research and development (R&D). In fact, while companies are expected to spend less cash in 2023 than in 2022, amid tight financing conditions and an uncertain economic environment, this has not deterred corporate capital expenditures from growing by an expected 5%, or R&D by double that at 10%. In order to fund these investments, companies are expected to cut back on share buybacks, an incredible vote of confidence in the perceived superior return on invested capital from investment.
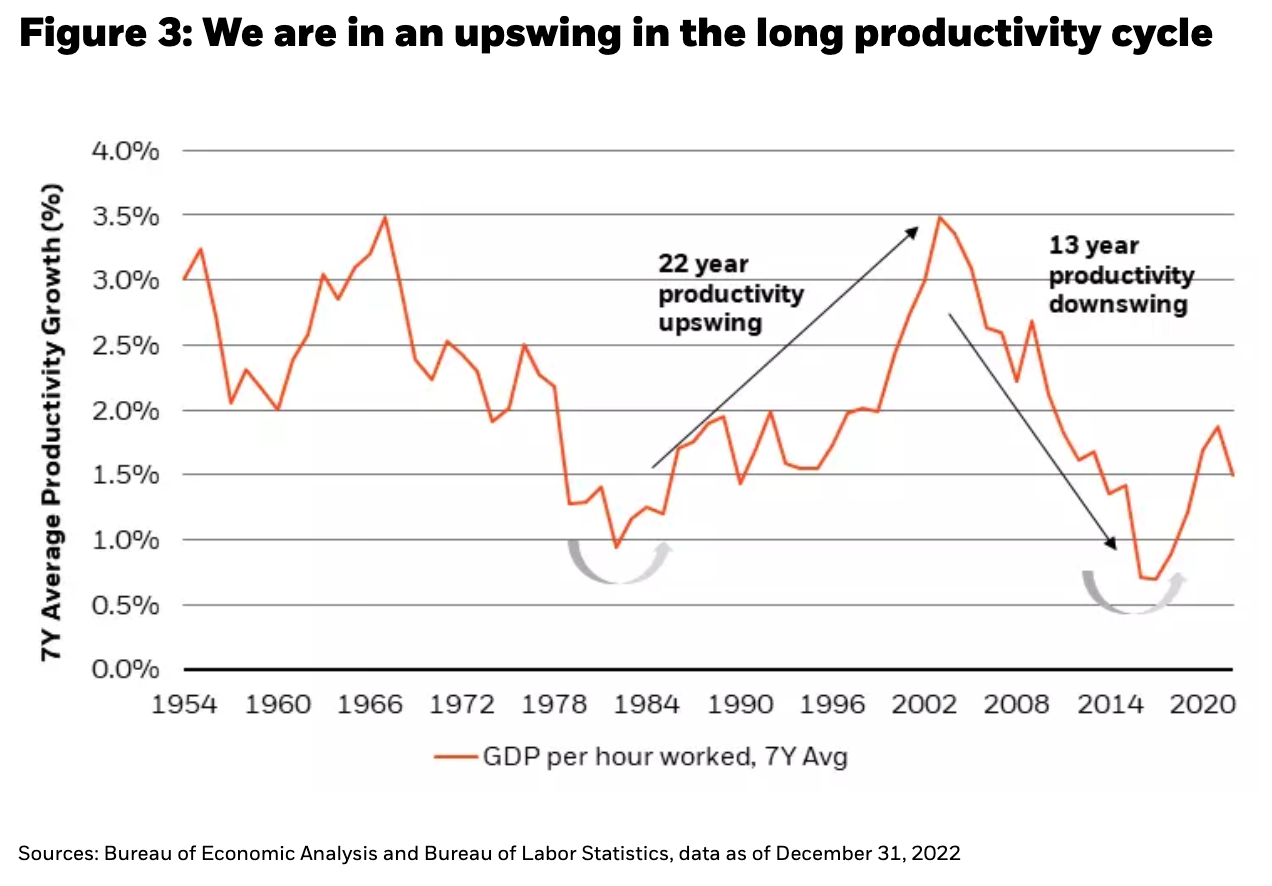
We would not be surprised if this R&D investment is linked to a need for more productivity amid cost inflation and a renewed tech race that seems to be heating up. Alongside this, deglobalization is real, and at the margin, it is reducing access to previously accessible pools of labor and resources. In many cases, “re-shoring” is driving a demand for new high-tech, highly productive facilities in a localized setting. We think we are in the midst of a long-cycle upswing in productivity, driven by a Technological Revolution, interrupted by (but also accelerated by) Covid, and well off the recent 2016 lows (see Figure 3).
Implications for the economy and even the debt sustainability debate
While one argument might be that the national debt has grown at an unsustainable pace (and this is true), another argument is that productivity recently troughed, making growth look very unflattering over the last business cycle. Some improvement here, through large, targeted investment spending, both by corporations and governments, can go a long way toward mitigating large debt burdens by compounding economic growth.
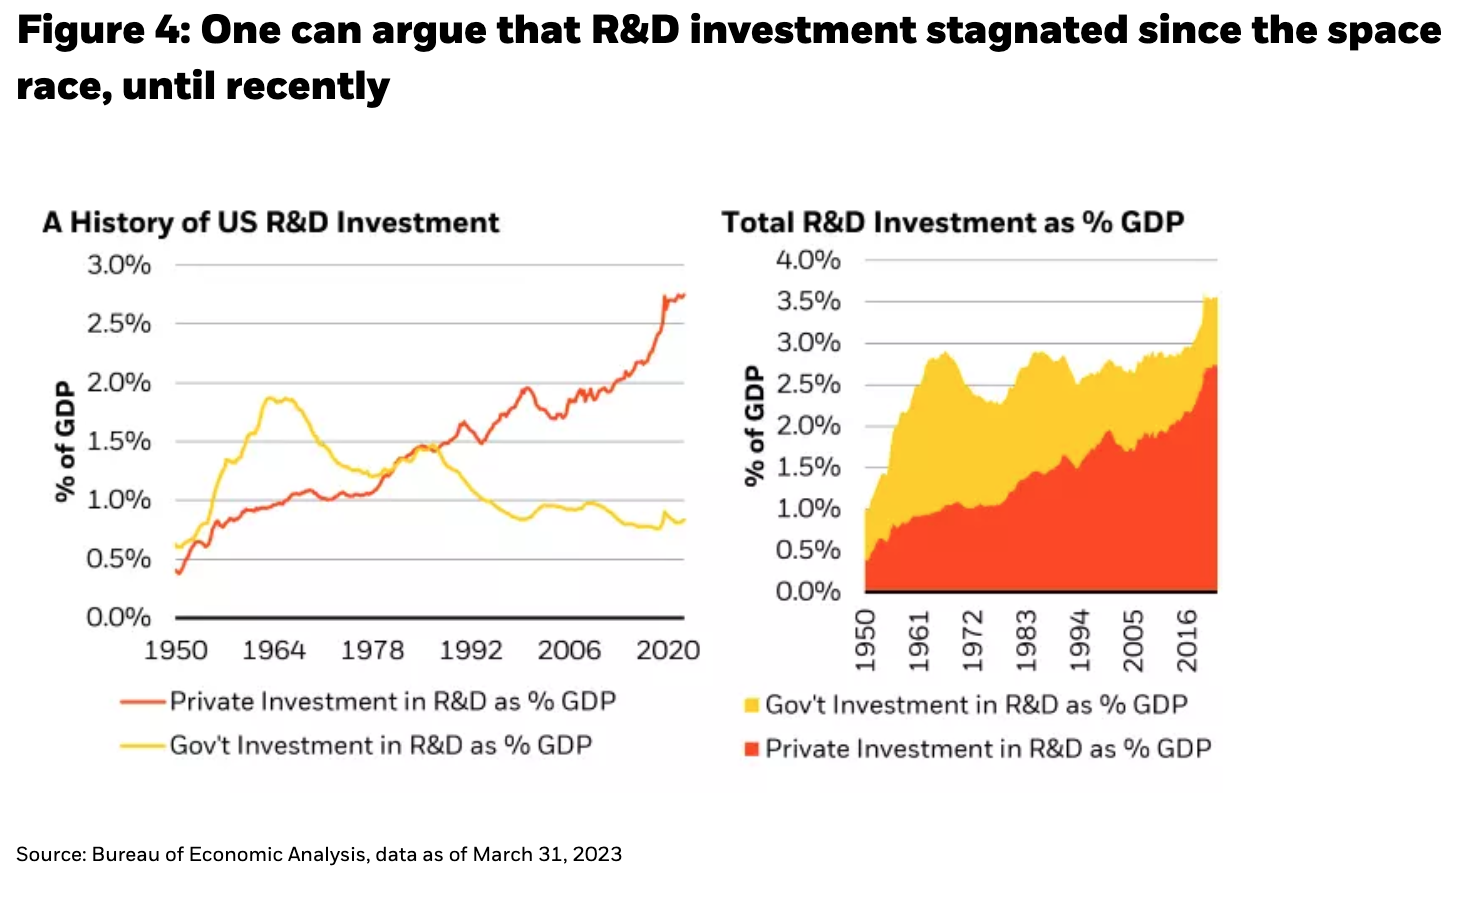
The long cycle decline in productivity has come at a time when R&D spending (the kind of spending that drives invention) has stagnated in aggregate, and declined at the government level, but may be growing from here. Government spending on R&D peaked amid the space race, during the Cold War, but led either directly or indirectly to huge productivity-enhancing inventions, from GPS (1973) to the internet (1983). Today, private investment in R&D is massive by comparison – just the top five big tech companies spend more than the U.S. government does (at greater than $200 billion a year). Aggregate data suggests that a breakout in R&D spending is occurring (see Figure 4). For now, this breakout seems to be led by the private sector, rather than the government (as in breakouts of old). Still, could the tech race with China spur government investment in R&D to a cyclical high, just as private investment is also accelerating?
A Technological Revolution in the coming years, even if it had just a fraction of the impact of either of the Industrial Revolutions, could catalyze long-term growth higher, long-term inflation lower, and consequently, could have profound implications for how investors should think about “getting paid back” in debt and equity investments today.
So, you want to get paid back?
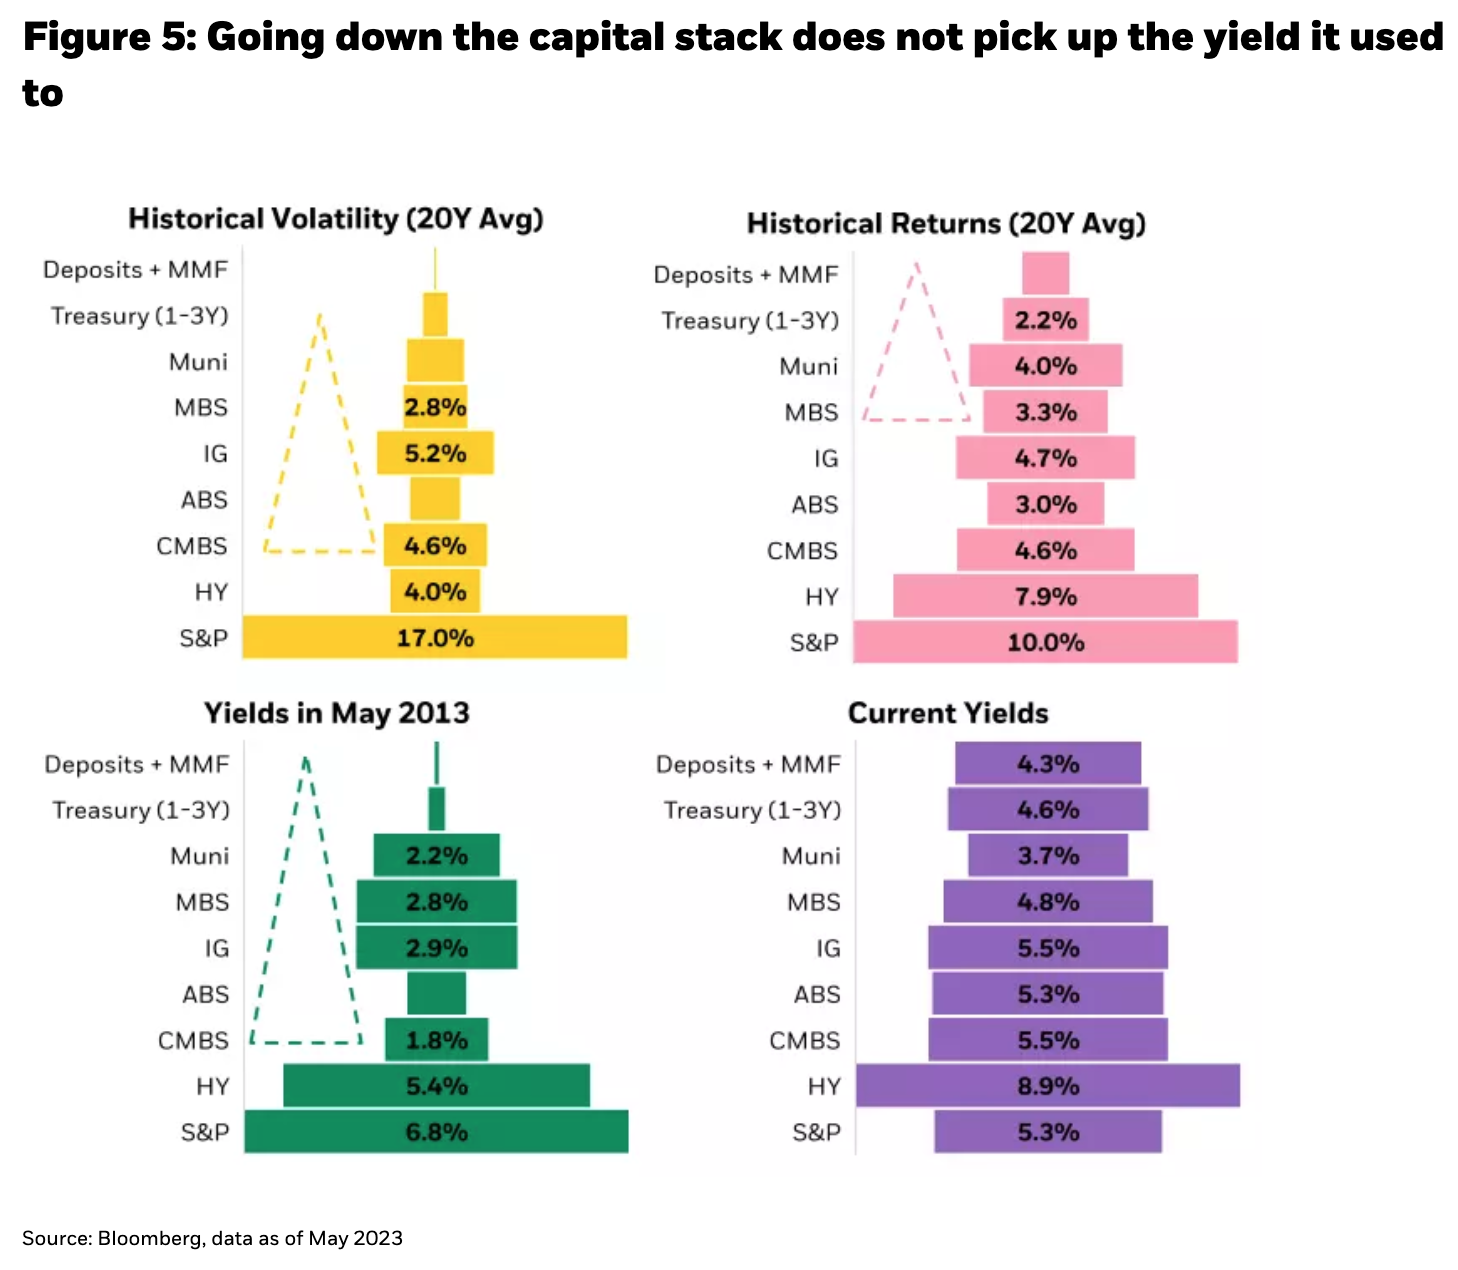
The pool of investable assets, not unlike the beach or pool by which some readers may be reading this very commentary this summer, varies in breadth (size) and depth (risk). Often, picking an asset class is only half the battle for superior risk-adjusted returns – many questions around risk (credit, liquidity and duration) and volatility need to be answered not just across asset classes, but within each rung on the capital stack. For much of the last 15 years, investors have been rewarded for taking on more volatility by going down the capital stack, as returns have been concentrated toward the bottom (the deep end of the pool). And that made sense since yield profiles looked something like an inverted funnel (see Figure 5). However, today, more risk does not necessarily equate to a higher yield.
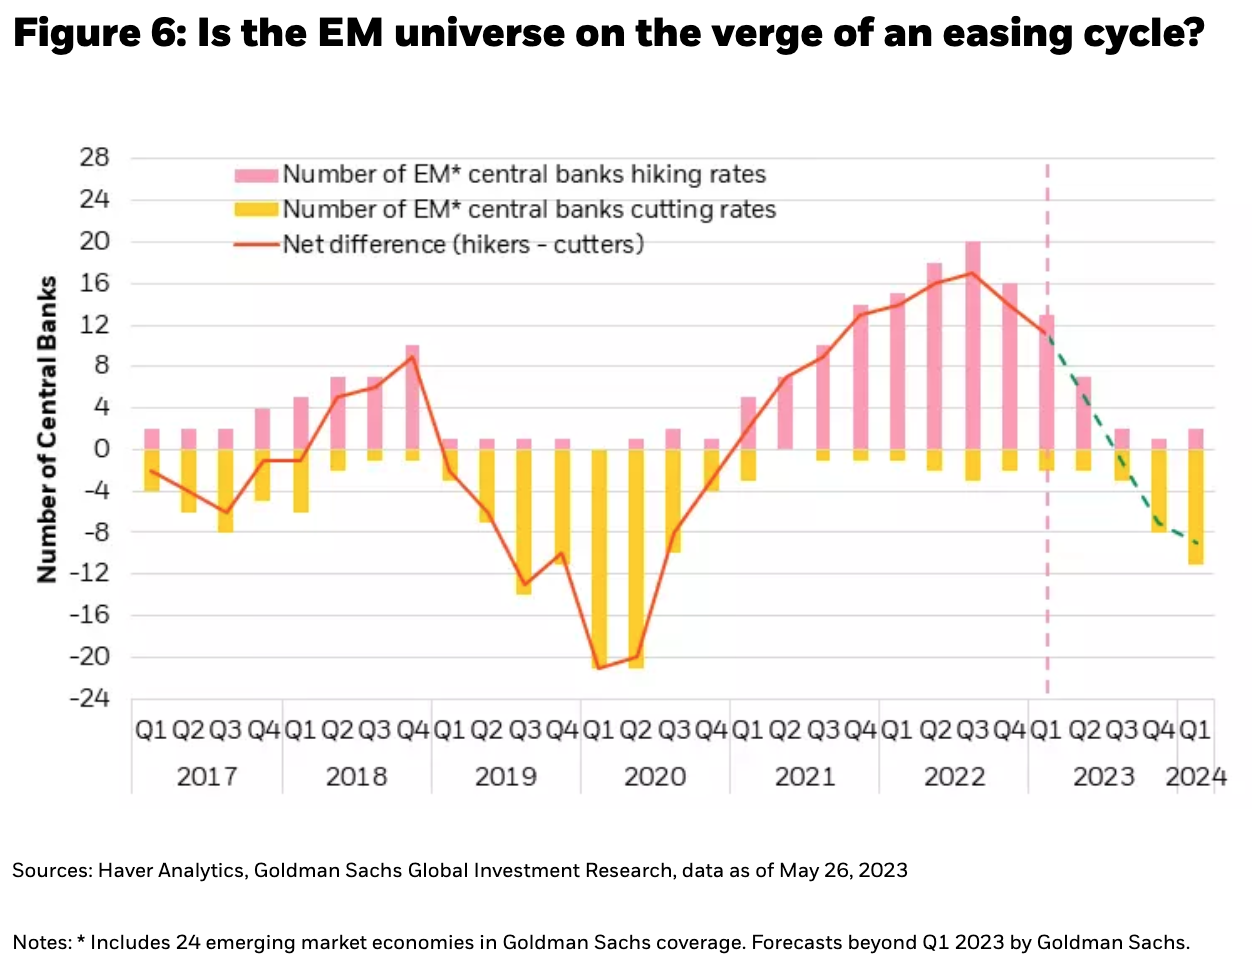
There are violent swings in the risk-free rate to consider; that have over the past 18 months radiated volatility throughout the capital stack and may continue to do so as the tightening cycle enters its late stage and central banks continue to drain liquidity from the system. The economy is resilient, but not immune to tightening financial conditions. On the other hand, there is the potential for compounding returns if invested in the equity of companies that are themselves investing in the right structural trends. And we must consider that we live in a global world, where policy in developed markets (DM) is still tightening alongside sticky inflation, but where emerging markets (EM) have become considerably more mixed, their central banks having already tightened rates early and quickly, to levels that potentially offer better return prospects. In fact, many EM central banks have either paused, are expected to pause, or have slowed the pace of hikes, with core inflation coming down more steadily and ahead of their DM counterparts (see Figure 6). We like the odds of countries like Brazil and Mexico winning their respective battles against inflation, at policy rates of 13.75% and 11.25%, respectively, and the margin of safety offered in their currencies at those yields.
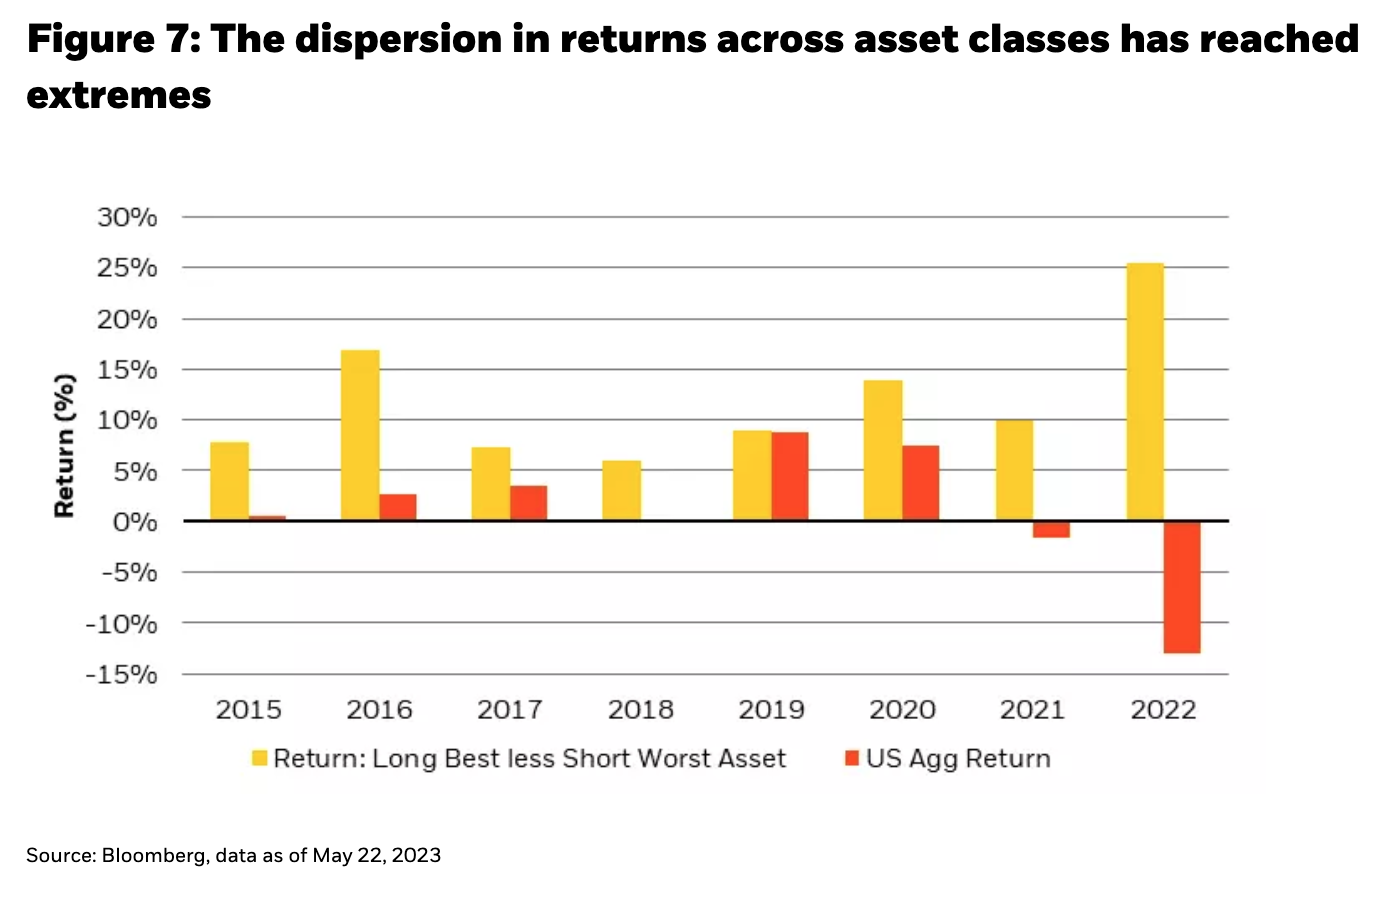
Globally, the range of yields available across major fixed income asset classes has more than doubled in the last 18 months alone. This dispersion in yields has been accompanied by a dispersion in returns, both within and across asset classes. The U.S. High Yield Index is an incredible illustration of how an index average cannot fully describe the dispersion (and opportunity) within that index: indeed, across 2,011 members, the index spread of 460 basis points (bps) is in line with less than 5% of its constituents, while more than 50% of the index trades inside of 300 bps, or outside of 800 bps. And it is not just a High Yield phenomenon – across 10 major global fixed income asset classes, owning the best returning asset and selling the worst has created increasingly large alpha in recent years. In 2019, there was virtually no differentiation, but in 2022 it was dramatic (see Figure 7).
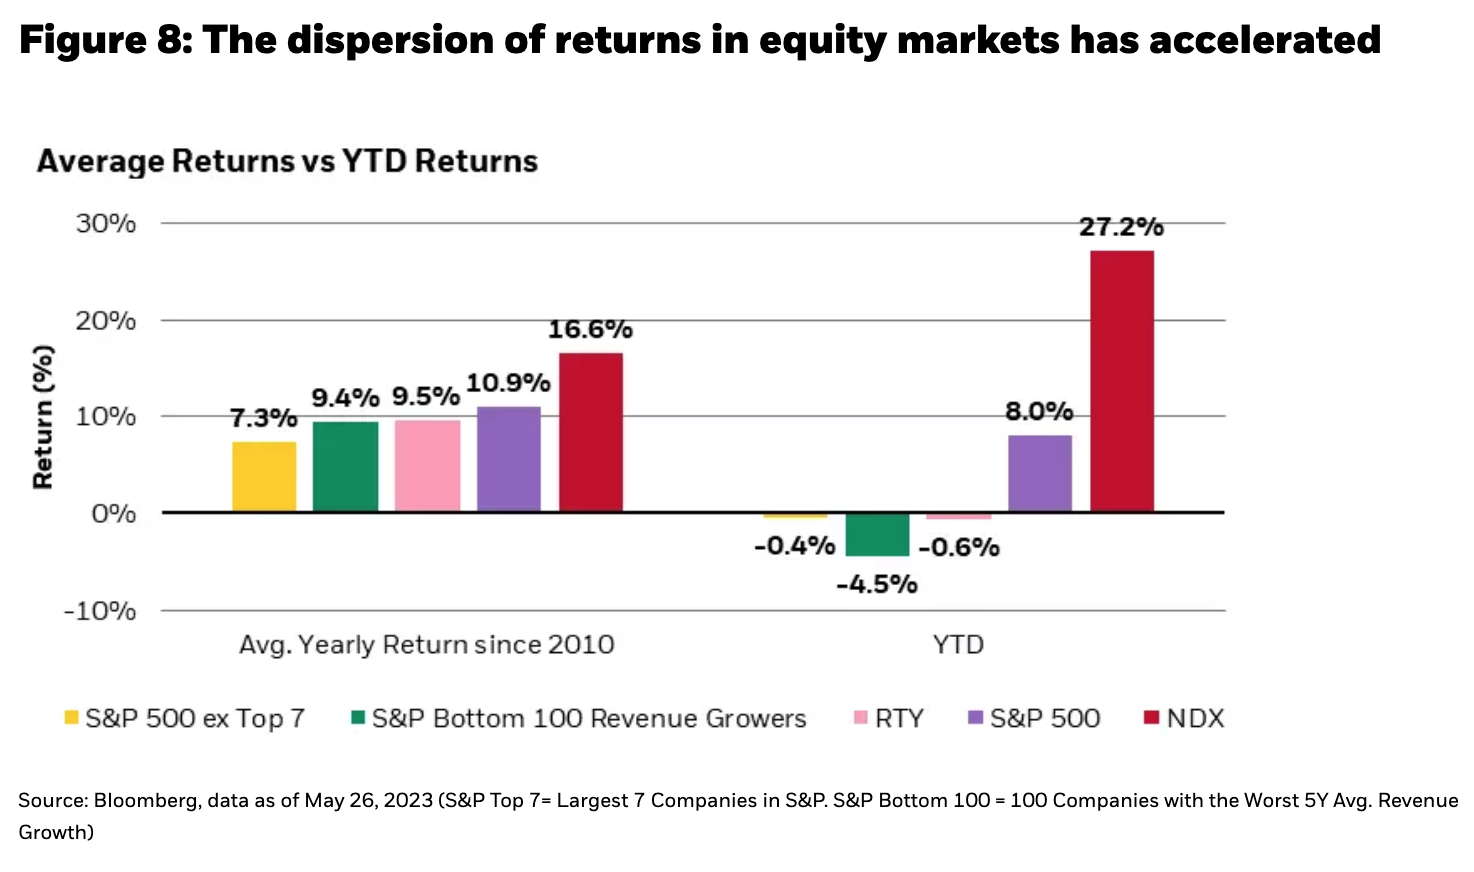
In equities, getting paid back means earning a generous return with limited volatility, in our view most sustainably done by investing in companies with growing cash flows. It requires finding companies with a topline growth that is sustainably higher than their peers and/or less susceptible to economic cycles, often because their businesses are aligned with structural trends. Companies that are spending on R&D to build out the world’s digital infrastructure, companies that are catering to the demographic evolution of an ageing population, companies that have local supply chains such that they can preserve, or even grow, cash flows in a deglobalizing world, and those that benefit from a resilient consumer, all have better odds of paying their investors back for the risk they are taking. In today’s environment of higher financing costs, sticky cost inflation, and slowing global growth, there has been rampant dispersion across equity markets this year – it has not been that straightforward to get paid back. Being selective in taking equity risk is becoming increasingly important (see Figure 8).
It’s easy to equate “getting paid back” to the simple return of principle, which is true when it comes to an individual bond. Yet, on a whole-portfolio basis, getting paid back is more complicated. It depends on return objective, risk tolerance, ability to beat inflation (real capital preservation) and the ability to consistently do this over a sufficiently long time horizon. We think a global, multi-asset portfolio that gives us the best chance of getting paid back on our risk over the next 6 to 18 months involves a mix of safety via government bonds (and concurrently yield), uncorrelated carry (especially in EM) and upside convexity through the equity of structural growers.


