Pre-opening Comment for Monday April 3rd
U.S. equity index futures were lower this morning. S&P 500 futures were down 7 points at 8:30 AM EDT.
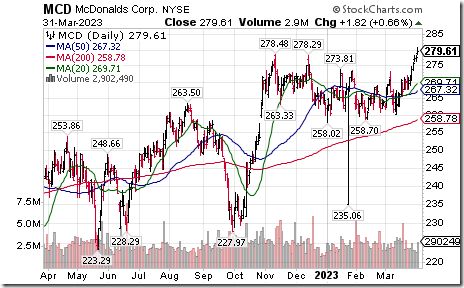
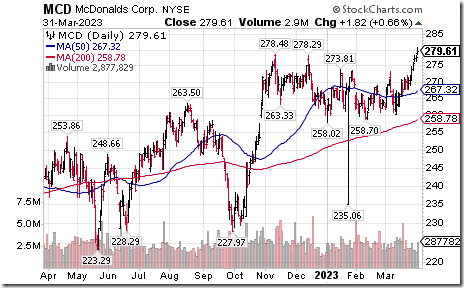
McDonalds slipped $0.09 to $279.52 after announcing plans this week to reduce corporate staff.
Crude oil jumped $4.54 to $80.21 per barrel after OPEC + announced a reduction in production by 1.16 million barrels per day. Energy equity prices are expected to respond accordingly at the open.
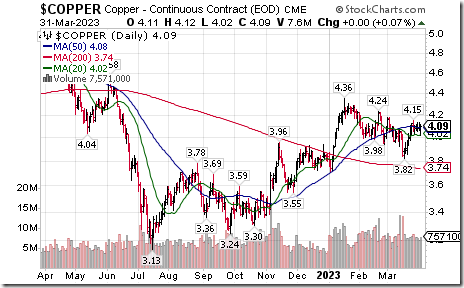
Over the weekend Goldman Sachs released a bullish report on copper and copper equities.
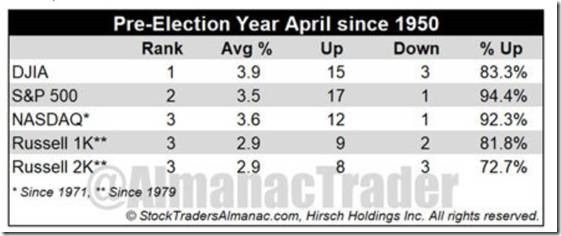
U.S. equity indices have a history since 1950 of moving higher in the month of April during U.S. Presidential Pre-election years. The year 2023 is a U.S. Presidential Pre-Election year. The following information was offered by www.StockTradersAlmanac.com
EquityClock’s Daily Comment
April has historically been the strongest month of the year for stocks with the S&P 500 Index gaining an average of 2.3%.
http://www.equityclock.com/2023/04/01/stock-market-outlook-for-april-3-2023/
The Bottom Line
North American equity markets are moving higher “on a wall of worry”. Analysts continue to lower earnings estimates for companies linked to broadly-based North American equity indices, The Federal Reserve and Bank of Canada are maintaining high regulated interest rates and have yet to signal when rates will peak let alone come down. International and political concerns are increasing including growing military tensions in Ukraine and Taiwan, instability in the U.S. banking industry and a showdown with President Biden and the House of Representatives on the U.S. debt ceiling.
On the other hand, “green shoots” have appeared. Disappointing revenue and earnings reports by selected companies (e.g. Micron, Blackberry) were met with surprising equity price strength as investors “looked through” the news to better prospects later this year. This phenomenon is expected to appear frequently in the month of April when companies hold their annual meetings and chief executive officers offer shareholders the good news for profit and revenue improvements as the year progresses. Not surprising, the month of April is the second strongest month for North American equity prices (December is the strongest month).
Technically, North American equity indices began to recover at intermediate oversold levels set on March 15th. “Risk on” sectors, most notably the technology sector are leading the advance. Stick with the trade for now, at least during the month of April.
Far East equity markets are a possible alternative to an investment in North American equity markets. Far East economies are recovering from end of the COVID 19 lockdown. Seasonality for their equity markets is favourable into May and occasionally into July. Intermediate technical parameters recently turned positive for equity ETFs representing China, South Korea, Taiwan and Hong Kong. Note that this a seasonal trade idea, not an investment idea.
Consensus for Earnings and Revenues for S&P 500 Companies
Source: www.factset.com
Year-over-year earnings and revenue estimates for 2023 continued to move lower from consensus on March 16th. First quarter 2023 earnings are expected to decrease 6.6% (versus previous decrease of 6.1%) but revenues are expected to increase 1.9% (versus previous increase of 2.0%). Second quarter 2023 earnings are expected to decrease 4.4% (versus previous decrease of 3.9%) and revenues are expected to decrease 0.1%.(versus previous increase of 0.1%) Third quarter earnings are expected to increase 2.3% (versus a previous increase of 2.7%) and revenues are expected to increase 1.4% (versus previous increase of 1.6%). Fourth quarter earnings are expected to increase 9.3% (versus previous increase of 9.6%) and revenues are expected to increase 3.8%. For all of 2023, earnings are expected to increase 1.5% (versus previous increase of 1.9%) and revenues are expected to increase 2.0% (versus previous increase of 2.1%)
Economic News This Week
Source: www.investing.com
March ISM Manufacturing PMI released at 10:00 AM EDT on Monday is expected to slip to 47.5 from 47.7 in February.
February Construction Spending released at 10:00 AM EDT on Monday is expected to slip 0.1% versus a decline of 0.1% in January.
February Canadian Merchandise Trade Balance released at 8:30 AM EDT on Tuesday is expected to drop to a deficit of $0.06 billion from a surplus of $1.92 billion in January.
February Factory Orders released at 10:00 AM EDT on Tuesday are expected to slip 0.3% versus a drop of 1.6% in January.
March ISM Non-Manufacturing PMI released at 10:00 AM EDT on Wednesday is expected to slip to 54.5% from 55.1% in February.
February U.S. Trade Deficit released at 10:00 AM EDT on Wednesday is expected to increase to $68.70 billion from $68.30 billion in January
March Canadian Employment is released at 8:30 AM EDT on Thursday.
Selected Earnings News This Week
Source: www.investing.com
Trader’s Corner
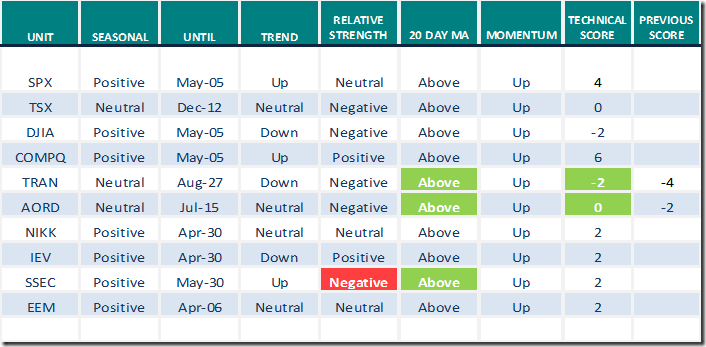
Equity Indices and Related ETFs
Daily Seasonal/Technical Equity Trends for March 31st 2023
Green: Increase from previous day
Red: Decrease from previous day
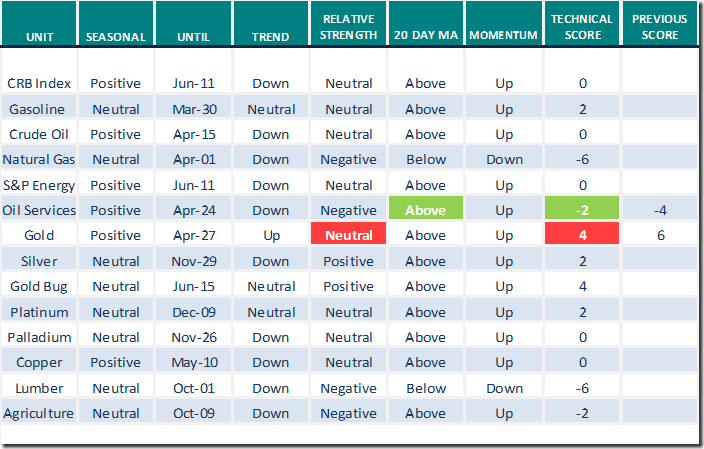
Commodities
Daily Seasonal/Technical Commodities Trends for March 31st 2023
Green: Increase from previous day
Red: Decrease from previous day
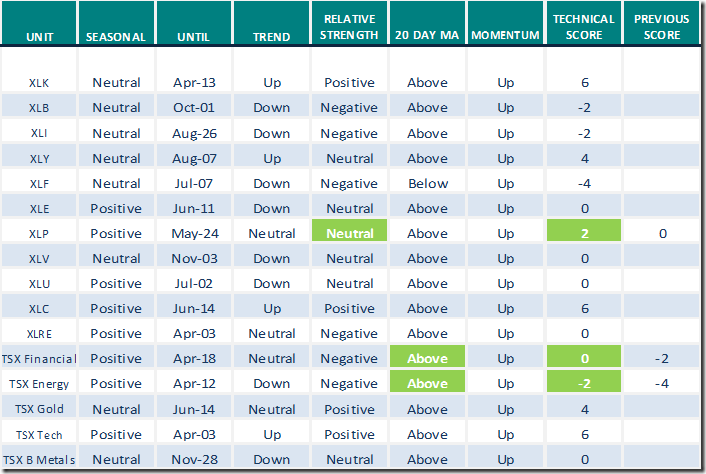
Sectors
Daily Seasonal/Technical Sector Trends for March 31st 2023
Green: Increase from previous day
Red: Decrease from previous day
Source for positive seasonal ratings: www.equityclock.com
Technical Scores
Calculated as follows:
Intermediate Uptrend based on at least 20 trading days: Score 2
(Higher highs and higher lows)
Intermediate Neutral trend: Score 0
(Not up or down)
Intermediate Downtrend: Score -2
(Lower highs and lower lows)
Outperformance relative to the S&P 500 Index: Score: 2
Neutral Performance relative to the S&P 500 Index: 0
Underperformance relative to the S&P 500 Index: Score –2
Above 20 day moving average: Score 1
At 20 day moving average: Score: 0
Below 20 day moving average: –1
Up trending momentum indicators (Daily Stochastics, RSI and MACD): 1
Mixed momentum indicators: 0
Down trending momentum indicators: –1
Technical scores range from -6 to +6. Technical buy signals based on the above guidelines start when a security advances to at least 0.0, but preferably 2.0 or higher. Technical sell/short signals start when a security descends to 0, but preferably -2.0 or lower.
Long positions require maintaining a technical score of -2.0 or higher. Conversely, a short position requires maintaining a technical score of +2.0 or lower
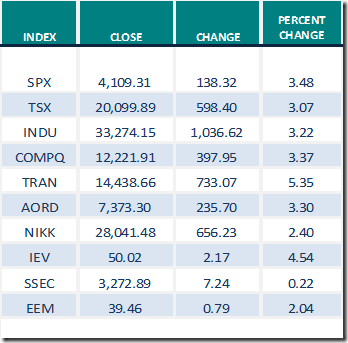
Changes Last Week
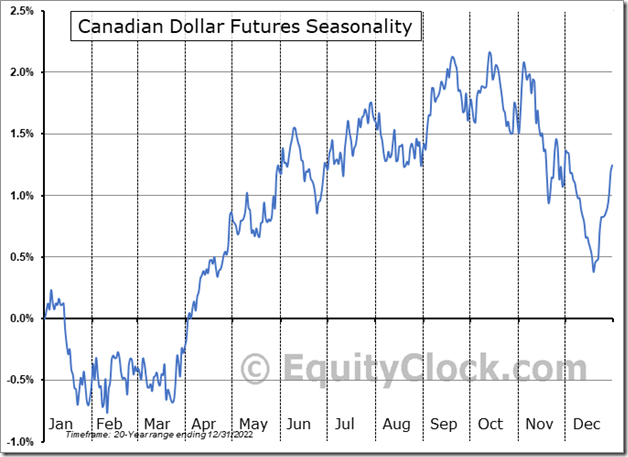
Seasonality Chart of the Day
Source: www.EquityClock.com
The Canadian Dollar has a history of moving higher relative to the U.S. Dollar between late March and early June. Gains frequently continue to the end of July.
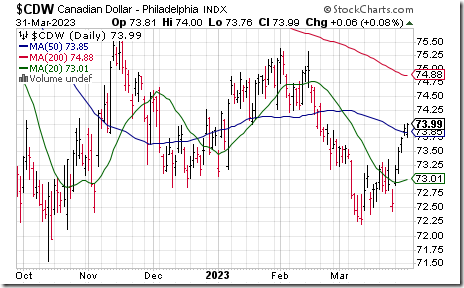
The Canadian Dollar advanced 1.5 cents to US74.00 cents during the past six trading days.
Links offered by valued providers
Michael Campbell’s Money Talks for April 1st
Michael Campbell’s MoneyTalks – Complete Show (mikesmoneytalks.ca)
Three ETFs Showing Renewed Strength: David Keller | March 31, 2023
Three ETFs Showing Renewed Strength | The Mindful Investor | StockCharts.com
Mega-Cap Leadership: Greg Schnell | March 31, 2023
Mega-Cap Leadership | The Canadian Technician | StockCharts.com
Market Flashes Green Light Amid Broad-Based Rally
Mary Ellen McGonagle | March 31, 2023
Market Flashes Green Light Amid Broad-Based Rally | The MEM Edge | StockCharts.com
March 31, 2023 | Is Inflation Really That Scary? Bob Hoye
Is Inflation Really That Scary? – HoweStreet
Mark Leibovit Mar 30, 2023: US Dollar, Gold, Banks, Bitcoin
US Dollar, Gold, Banks, Bitcoin – HoweStreet
Victor Adair’s Trading Desk Notes for April 1st
Trading Desk Notes For April 1, 2023 – HoweStreet
Links from Mark Bunting and www.uncommonsenseinvestor.com
Is the "Tech Safety Trade" a False Narrative? – Uncommon Sense Investor
Is the "Tech Safety Trade" a False Narrative? – Uncommon Sense Investor
Exuberant Investor Behaviour & Managing Risk – Uncommon Sense Investor
https://uncommonsenseinvestor.com/investor-behaviour-managing-risk/
Technical Scoop by David Chapman and www.EnrichedInvesting.com
Technical Notes for Friday
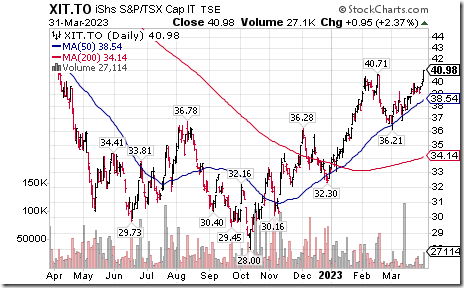
Canadian Technology iShares $XIT.TO moved above Cdn$40.71 extending an intermediate uptrend.
McDonalds $MCD a Dow Jones Industrial Average stock moved above $278.48 to an all-time high extending an intermediate uptrend.
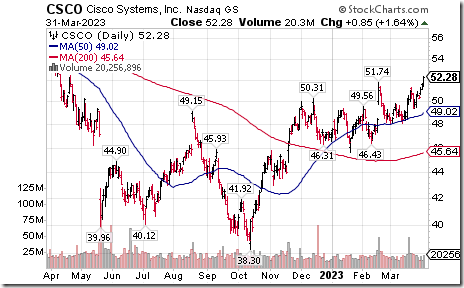
Cisco $CSCO a Dow Jones Industrial Average stock moved above $51.74 extending an intermediate uptrend.
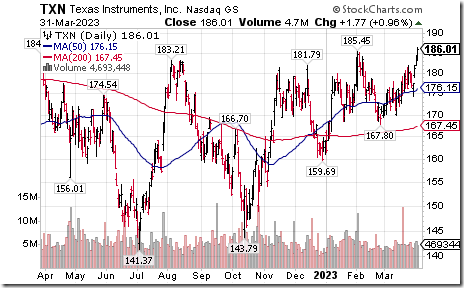
Texas Instruments $TXN an S&P 100 stock moved above $185.45 extending an intermediate uptrend.
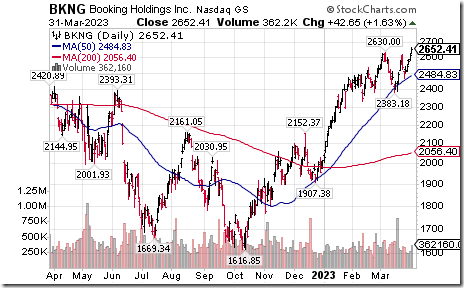
Booking Holdings $BKNG an S&P 100 stock moved above $2,630.00 extending an intermediate uptrend.
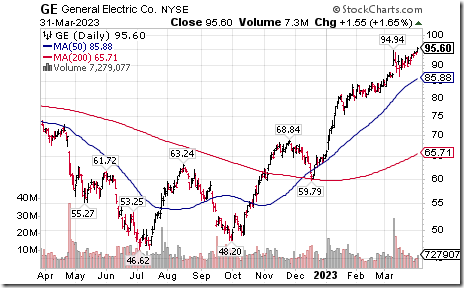
General Electric $GE an S&P 100 stock moved above $94.94 extending an intermediate uptrend.
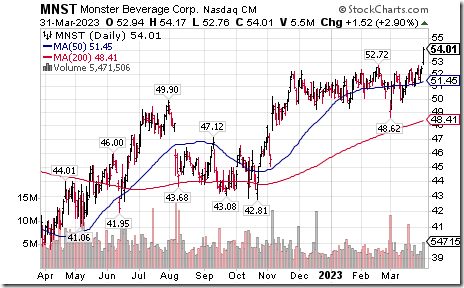
Monster Beverages $MNST a NASDAQ 100 stock moved above $52.72 to an all-time high extending an intermediate uptrend.
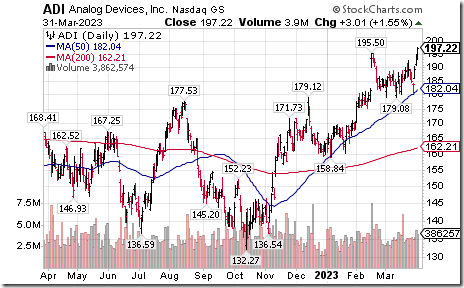
Analog Devices $ADI a NASDAQ 100 stock moved above $195.50 to an all-time high extending an intermediate uptrend.
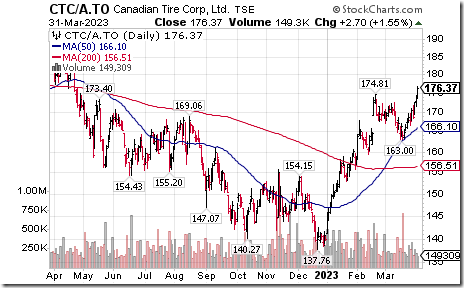
Canadian Tire $CTC.A.TO a TSX 60 stock moved above $174.81 extending an intermediate uptrend.
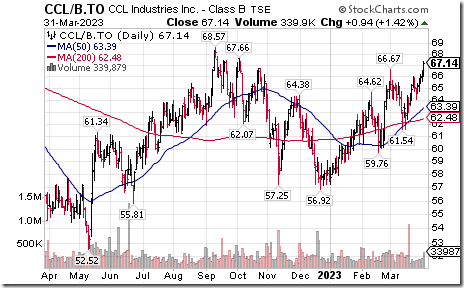
CCL Industries $CCL.B.TO a TSX 60 stock moved above $66.67 extending an intermediate uptrend.
S&P 500 Momentum Barometers
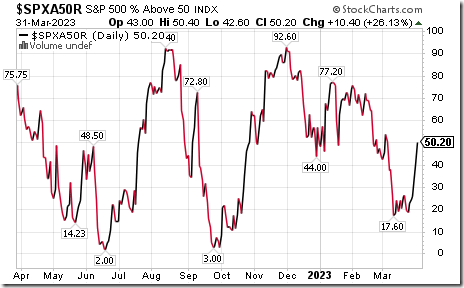
The intermediate term Barometer added 10.40 on Friday and 27.20 last week to 50.20. It changed from Oversold to Neutral on a move above 40.00. Daily trend is up.
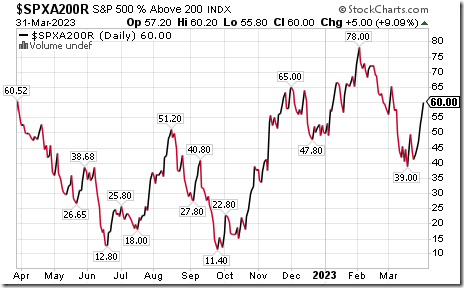
The long term Barometer advanced 5.00 on Friday and 17.20 last week to 60.00. It changed from Neutral to Overbought on a move to 60.00 or higher. Daily trend is up.
TSX Momentum Barometers
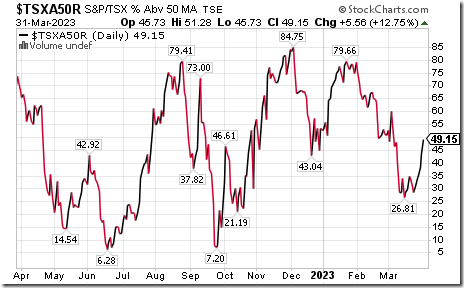
The intermediate term Barometer added 5.56 on Friday and 18.38 last week to 49.15. It changed from Oversold to Neutral on a move above 40.00. Daily trend is up.
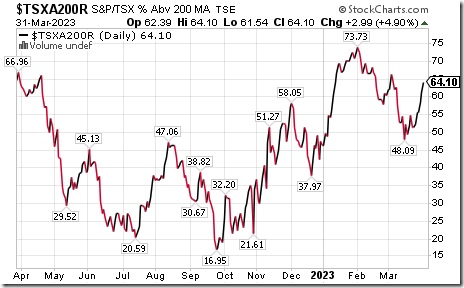
The long term Barometer added 2.99 on Friday and 11.96 last week to 64.10. It changed from Neutral to Overbought on a move above 60.00. Daily trend is up.
Source for all price charts: www.StockCharts.com
Disclaimer: Seasonality ratings and technical ratings offered in this report and at
www.equityclock.com are for information only. They should not be considered as advice to purchase or to sell mentioned securities. Data offered in this report is believed to be accurate, but is not guaranteed


