Pre-opening Comments for Thursday March 30th
U.S. equity index futures were higher this morning. S&P 500 futures were up 24 points at 8:35 AM EDT.
Index futures were virtually unchanged following release of the updated estimate for fourth quarter annualized U.S. GDP growth at 8:30 AM EDT. Consensus was unchanged at 2.7%. Actual was 2.6%.
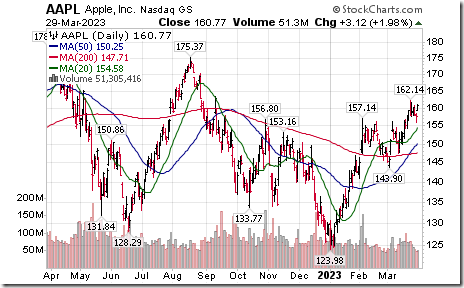
Apple added $0.70 to $161.47 after announcing date of its next World Wide Development Conference set for June 5th to June 9th. Historically, Apple has announced new products at the conference.
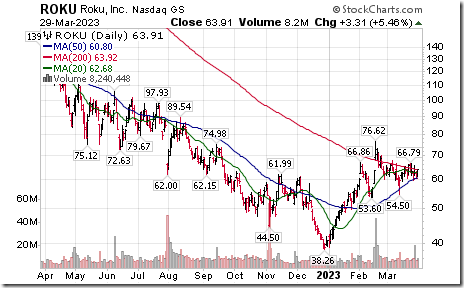
Roku gained $1.84 to $65.75 after announcing plans to cut costs by reducing staff by 6%.
Walmart advanced $2.28 to $146.51 after Evercore upgraded the stock to Outperform.

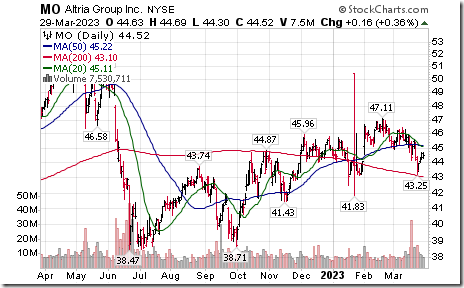
Philip Morris added $1.60 to $96.32 after JP Morgan upgraded the stock from Neutral to Overweight.
EquityClock’s Daily Comment
Headline reads “Defensive sectors are bouncing from defined levels of horizontal support, providing levels to shoot off of amidst a risk-off shift in the market”.
http://www.equityclock.com/2023/03/29/stock-market-outlook-for-march-30-2023/
Technical Notes
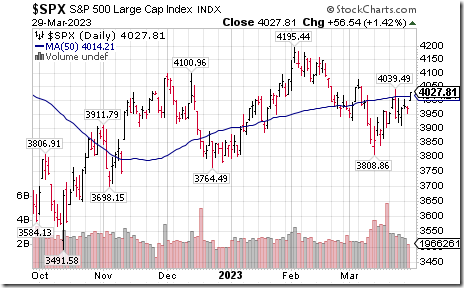
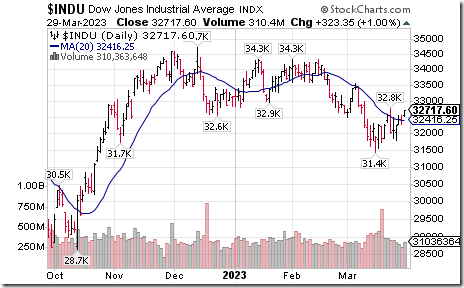
Broadly based U.S. equity indices moved above key moving averages:
S&P 500 Index moved above its 50 day moving average
Dow Jones Industrial Average moved above its 20 day moving average
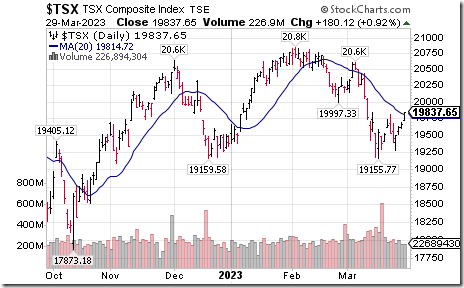
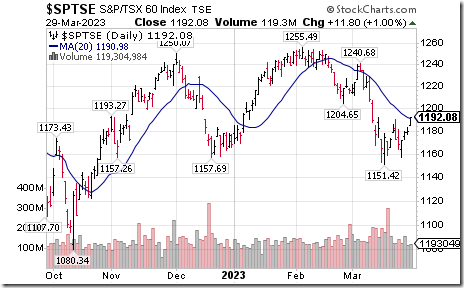
Broadly based TSX indices moved above their 20 day moving average.
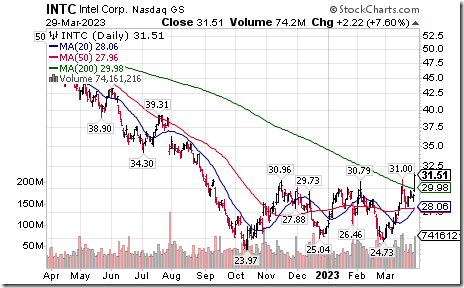
Intel $INTC a Dow Jones Industrial Average stock moved above $30.96 completing a base building pattern.
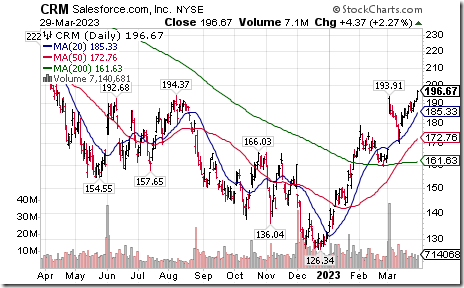
Salesforce.com $CRM a Dow Jones Industrial Average stock moved $193.91 extending an intermediate uptrend.
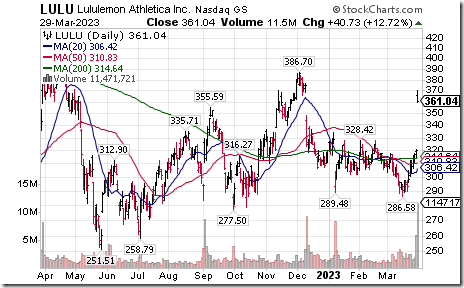
Lulu lemon $LULU a NASDAQ 100 stock moved above intermediate resistance at $328.42. The company reported higher than consensus fiscal fourth quarter results.
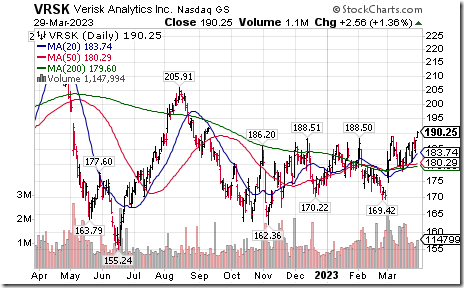
Verisk Analytics $VRSK a NASDAQ 100 stock moved above intermediate resistance at $189.09.
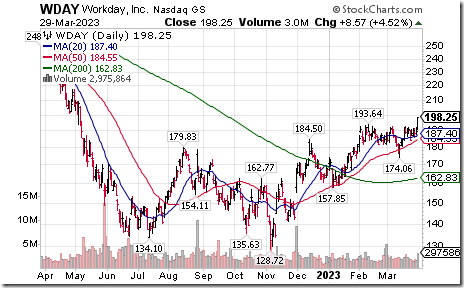
Workday $WDAY a NASDAQ 100 stock moved above $193.64 extending an intermediate uptrend.
Couche Tard $ATD.TO a TSX 60 stock moved above Cdn$65.80 to an all-time high extending an intermediate uptrend.

Trader’s Corner
Equity Indices and Related ETFs
Daily Seasonal/Technical Equity Trends for March 29th 2023
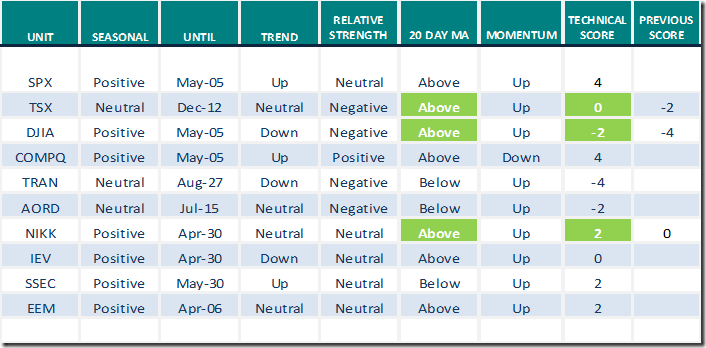
Green: Increase from previous day
Red: Decrease from previous day
Commodities
Daily Seasonal/Technical Commodities Trends for March 29th 2023
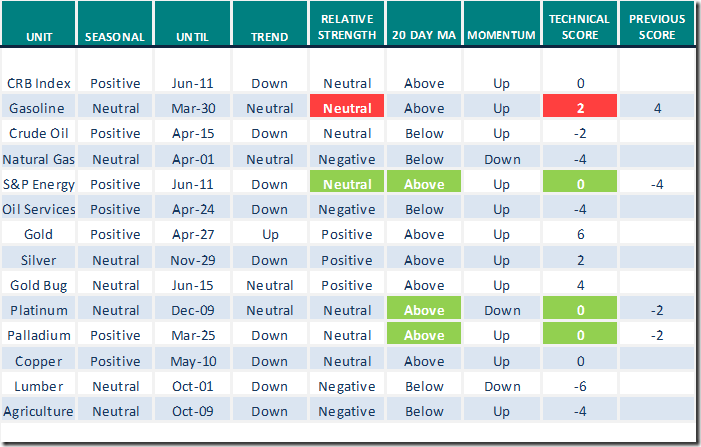
Green: Increase from previous day
Red: Decrease from previous day
Sectors
Daily Seasonal/Technical Sector Trends for March 29th 2023
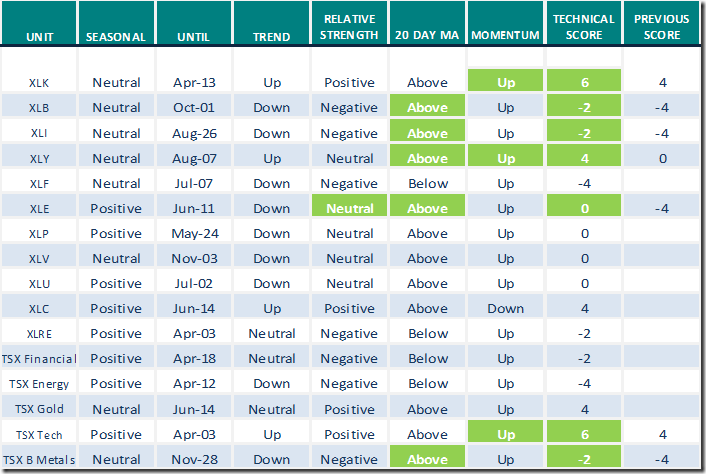
Green: Increase from previous day
Red: Decrease from previous day
Source for positive Seasonal ratings: www.equityclock.com
Links offered by valued providers
Can Energy Stocks Start To Rally? | Greg Schnell, CMT | Market Buzz (03.29.23)
Can Energy Stocks Start To Rally? | Greg Schnell, CMT | Market Buzz (03.29.23) – YouTube
Seasonality Chart of the Day
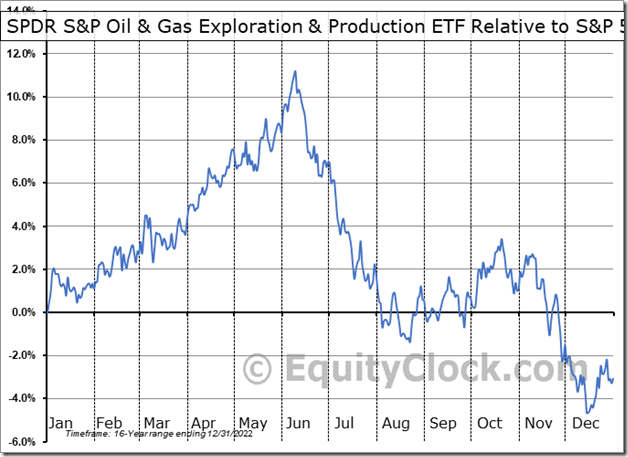
Seasonal Chart Analysis
Analysis of the SPDR S&P Oil & Gas Exploration & Production ETF (NYSE:XOP) seasonal charts above shows that a Buy Date of March 10 and a Sell Date of June 8 has resulted in a geometric average return of 7.4% above the benchmark rate of the S&P 500 Total Return Index over the past 16 years. This seasonal timeframe has shown positive results compared to the benchmark in 12 of those periods. This is a good rate of success and the return strongly outperforms the relative buy-and-hold performance of the stock over the past 16 years by an average of 14.63% per year.
S&P 500 Momentum Barometers
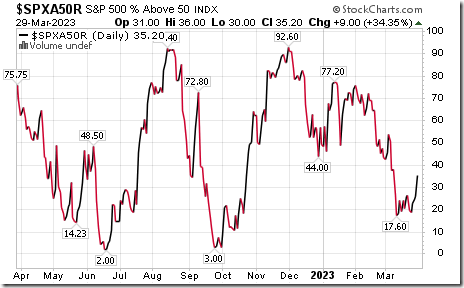
The intermediate term Barometer added 9.00 to 35.20. It remains Oversold. Daily trend has turned up.
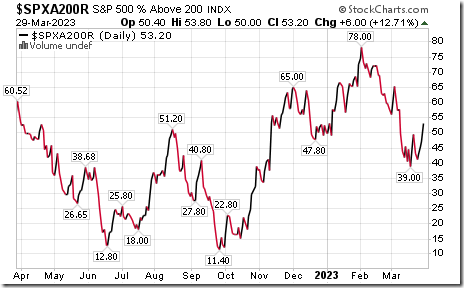
The long term Barometer advanced 6.00 to 53.20. It remains Neutral. Daily trend has turned up.
TSX Momentum Barometers
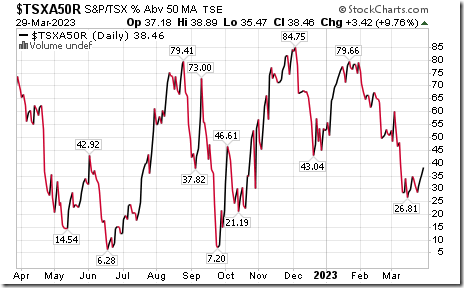
The intermediate term Barometer added 3.42 to 38.46. It remains Oversold. Daily trend has turned up.
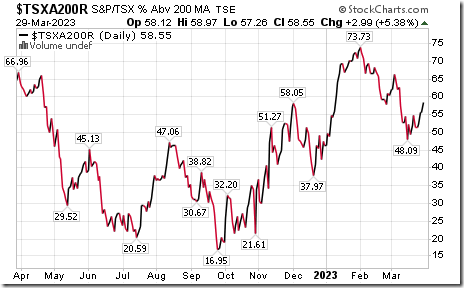
The long term Barometer added 2.99 to 58.55. It remains Neutral. Daily trend has turned up.
Disclaimer: Seasonality ratings and technical ratings offered in this report and at
www.equityclock.com are for information only. They should not be considered as advice to purchase or to sell mentioned securities. Data offered in this report is believed to be accurate, but is not guaranteed