
Pre-opening Comments for Monday March 20th
U.S. equity index futures were mixed this morning. S&P 500 futures were up 1 point at 8:30 AM EDT.
Concerns about Credit Suisse’ viability was relieved after UBS acquired the company for $3.2 billion
CF Industries slipped $0.43 to $70.50 after announcing acquisition of an ammonia plant in Louisiana for $1.675 billion.

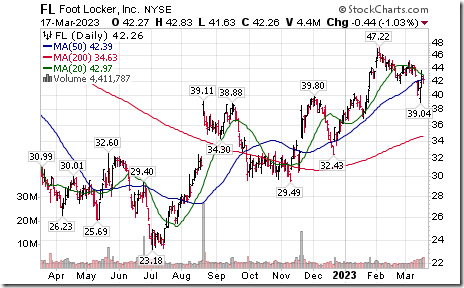
Foot Locker added $0.03 to $42.29 after reporting higher than consensus fourth quarter results. The company also lowered guidance for the first quarter.
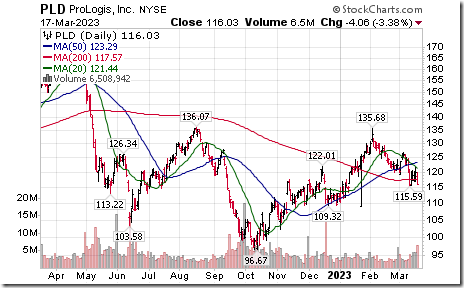
Prologis added $0.97 to $117.01 after Mizuho initiated coverage with a Buy rating and a $140 target.
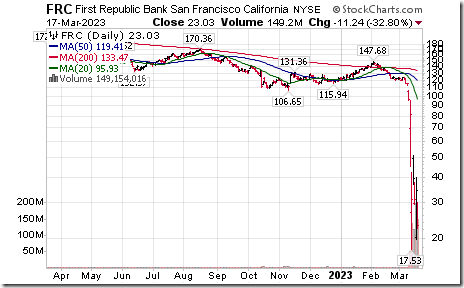
First Republic dropped $4.13 to $18.90 after S&P downgraded its credit rating from BB+ to B+.
EquityClock’ s Daily Comment
Headline reads “Shipping activity is struggling, typically a hallmark indicator of an economic slowdown/recession on the horizon”.
http://www.equityclock.com/2023/03/18/stock-market-outlook-for-march-20-2023/
The Bottom Line
Focus this week is on news from the FOMC meeting released at 2:00 PM EDT on Wednesday. Consensus calls for another increase in target for the Fed Fund Rate by 0.25% to 4.75%-5.00%.
Consensus for Earnings and Revenues for S&P 500 Companies
Earnings and revenue estimates changed slightly last week. According to www.factset.com first quarter 2023 earnings are expected to decrease 6.1% but revenues are expected to increase 1.9% (versus previous increase of 2.0%). Second quarter 2023 earnings are expected to decrease 3.8% (versus previous increase of 3.9%) and revenues are expected to increase 0.1%. Third quarter earnings are expected to increase 2.9% (versus a previous increase of 2.7%) and revenues are expected to increase 1.6%. Fourth quarter earnings are expected to increase 9.7% (versus previous increase of 9.6%) and revenues are expected to increase 3.8%. For all of 2023, earnings are expected to increase 1.9% and revenues are expected to increase 2.1%.
Economic News This Week
Source: www.investing.com
February Canadian Consumer Price Index released at 8:30 AM EDT on Tuesday is expected to increase 0.7% versus a gain of 0.5% in January. On a year-over-year basis, February CPI is expected to increase 5.4% versus a gain of 5.9% in January.
January Canadian Retail Sales released at 8:30 AM EDT on Tuesday are expected to increase 0.7% versus a gain of 0.5% in December.
FOMC announcement on the Fed Fund Rate is released at 2:00 PM EDT on Wednesday. Consensus calls for a 0.25% increase to target 4.75%-5.00%.
Conference call follows..
February U.S. Existing Home Sales released at 10:00 AM EDT on Thursday are expected to increase to 4.18 million units from 4.00 million units in January.
February Durable Goods Orders released at 8:30 AM EDT on Friday are expected to increase 0.9% versus a decline of 4.5% in January. Excluding Transportation Orders, February Durable Goods Orders are expected to increase 0.3% versus a decline of 0.8% in January.
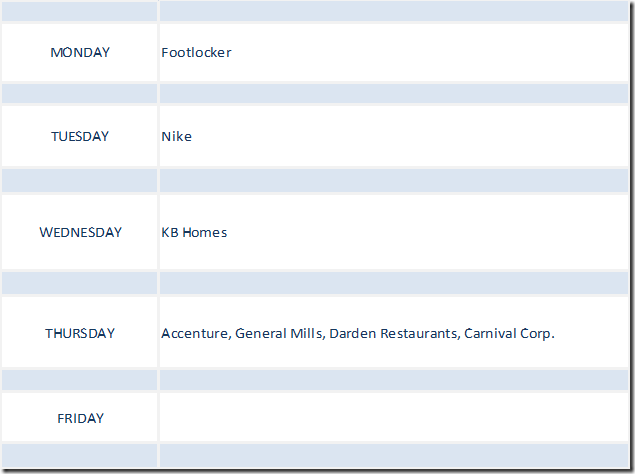
Selected Earnings News This Week
Source: www.investing.com
Trader’s Corner
Equity Indices and Related ETFs
Daily Seasonal/Technical Equity Trends for March 17th 2023
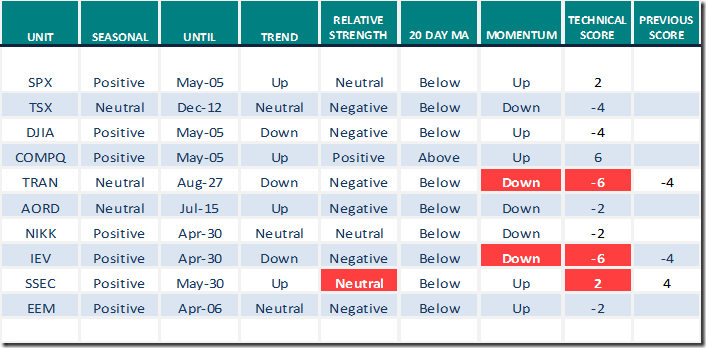
Green: Increase from previous day
Red: Decrease from previous day
Commodities
Daily Seasonal/Technical Commodities Trends for March 17th 2023
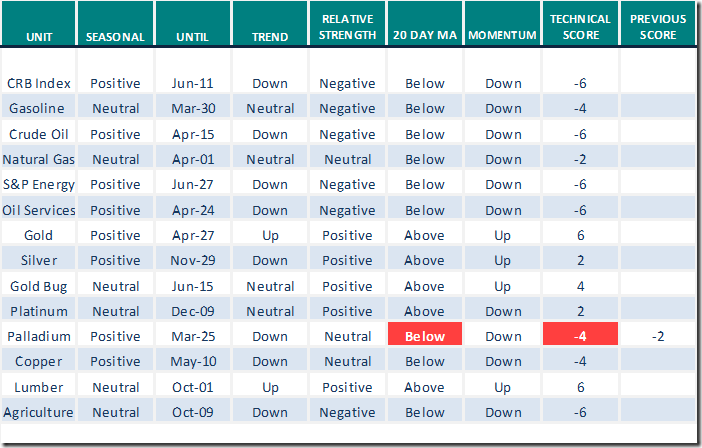
Green: Increase from previous day
Red: Decrease from previous day
Sectors
Daily Seasonal/Technical Sector Trends for March 17th 2023

Green: Increase from previous day
Red: Decrease from previous day
Source for Seasonal ratings: www.equityclock.com
Technical Scores
Calculated as follows:
Intermediate Uptrend based on at least 20 trading days: Score 2
(Higher highs and higher lows)
Intermediate Neutral trend: Score 0
(Not up or down)
Intermediate Downtrend: Score -2
(Lower highs and lower lows)
Outperformance relative to the S&P 500 Index: Score: 2
Neutral Performance relative to the S&P 500 Index: 0
Underperformance relative to the S&P 500 Index: Score –2
Above 20 day moving average: Score 1
At 20 day moving average: Score: 0
Below 20 day moving average: –1
Up trending momentum indicators (Daily Stochastics, RSI and MACD): 1
Mixed momentum indicators: 0
Down trending momentum indicators: –1
Technical scores range from -6 to +6. Technical buy signals based on the above guidelines start when a security advances to at least 0.0, but preferably 2.0 or higher. Technical sell/short signals start when a security descends to 0, but preferably -2.0 or lower.
Long positions require maintaining a technical score of -2.0 or higher. Conversely, a short position requires maintaining a technical score of +2.0 or lower
Changes Last Week
Technical Notes
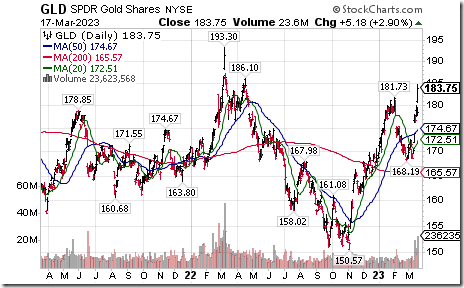
Gold SPDRs $GLD moved above $181.73 extending an intermediate uptrend.
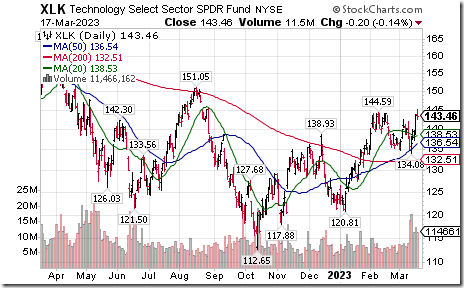
Technology SPDRs $XLK moved above $144.59 extending an intermediate uptrend.
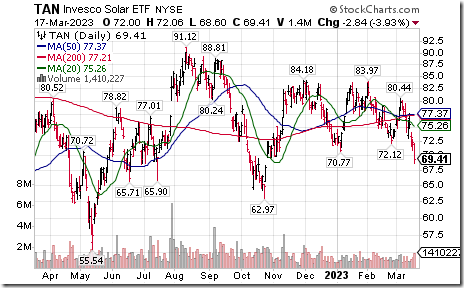
Solar ETF $TAN moved below intermediate support at $70.77.
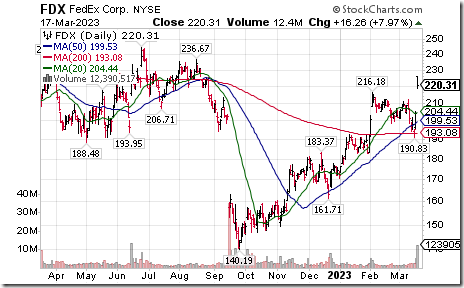
FedEx $FDX an S&P 100 stock moved above $216.18 extending an intermediate uptrend. The company reported higher than consensus fiscal third quarter earnings.
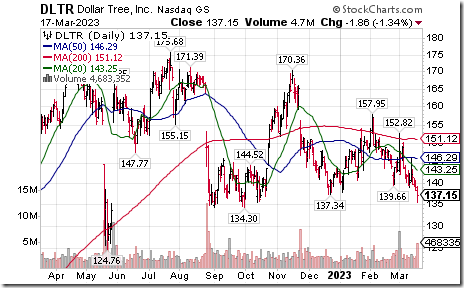
Dollar Tree $DLTR a NASDAQ 100 stock moved below $137.34 extending an intermediate downtrend.
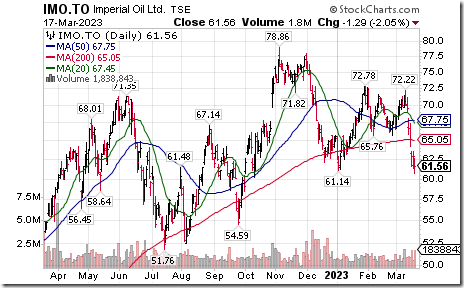
Imperial Oil $IMO.TO a TSX 60 stock moved below $61.14 extending an intermediate downtrend.
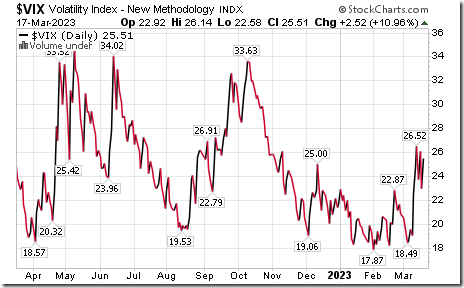
The VIX Index remains elevated above 22%.
Links offered by valued providers
Michael Campbell’s Money Talks for March 18th
Note comments on the economy by James Thorne and on energy by Josef Schachter.
Michael Campbell’s MoneyTalks – Complete Show (mikesmoneytalks.ca)
Mark Leibovit’s Weekly Comment
Maybe You Should Be Doing What Warren Buffet is Doing – HoweStreet
Gold gets a shine: Greg Schnell March 17th
Gold Gets A Shine | The Canadian Technician | StockCharts.com
Market Trend Model Turns Bearish: David Keller
Market Trend Model Turns Bearish | The Mindful Investor | StockCharts.com
Larry Williams Special Presentation for StockCharts.com
Larry Williams | StockCharts.com
Here’s What the Markets are Telling Us – And It’s Not All Bad: Mary Ellen McGonagle
March 17, 2023
Here’s What the Markets are Telling Us – And It’s Not All Bad | The MEM Edge | StockCharts.com
Crude Oil Collapses – Will It Move Even Lower? Erin Swenlin March 15, 2023
Crude Oil Collapses – Will It Move Even Lower? | DecisionPoint | StockCharts.com
Bonds Rally in Flight to Safety | David Keller, CMT | The Final Bar (03.17.23)
Bonds Rally in Flight to Safety | David Keller, CMT | The Final Bar (03.17.23) – YouTube
Bob Hoye: March 17, 2023 | Can US Banking System Weather SVB Collapse?
Can US Banking System Weather SVB Collapse? – HoweStreet
Mike Swanson: Mar 16, 2023: Banking Concerns Should See a Big Boost in
Banking Concerns Should See a Big Boost in Gold – HoweStreet
Victor Adair: Trading Post Notes for March 18th
Trading Desk Notes For March 18, 2023 – HoweStreet
Mark Bunting and www.uncommonsenseinvestor.com comments
What’s Causing the Largest Moves on Record for Safe Haven Assets? – Uncommon Sense Investor
Why Dangerous Assumptions Are Embedded in "Cheap" Stocks – Uncommon Sense Investor
John O’Connell’s Market Outlook – John O’Connell’s Market Outlook (bnnbloomberg.ca)
Technical Scoop from David Chapman and www.enrichedinvesting.com
S&P 500 Momentum Barometers
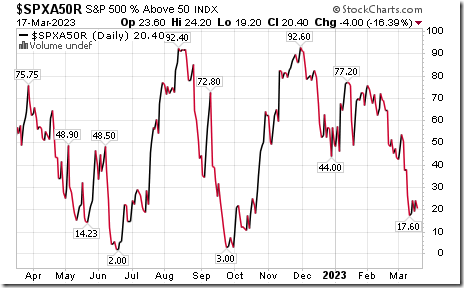
The intermediate term Barometer slipped 4.00 on Friday, but gained 2.80 last week to 20.40. It remains Oversold, but is showing early signs of bottoming.
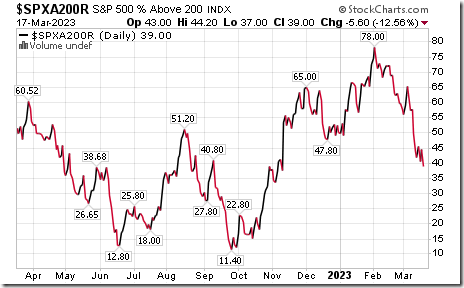
The long term Barometer dropped 5.60 on Friday and 4.80 last week to 39.00. It changed on Friday from Neutral to Oversold on a drop below 40.00. Trend remains down.
TSX Momentum Barometers

The intermediate term Barometer added 1.28 on Friday and 1.28 last week to 29.79. It remains Overbought.
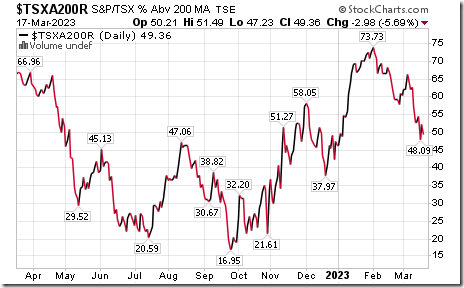
The long term Barometer dropped 2.98 on Friday and 3.41 last week to 49.36. It remains Neutral. Trend is down.
Disclaimer: Seasonality ratings and technical ratings offered in this report and at
www.equityclock.com are for information only. They should not be considered as advice to purchase or to sell mentioned securities. Data offered in this report is believed to be accurate, but is not guaranteed