The Bottom Line
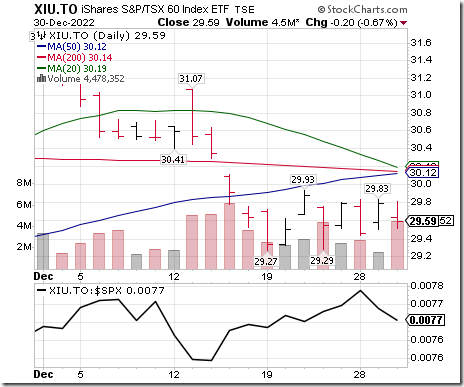
History is repeating! iShares on the TSX 60 Index recorded an intermediate bottom on December 19th. It also started to show positive performance relative to the S&P 500 Index and Dow Jones Industrial Average in line with seasonal expectations.
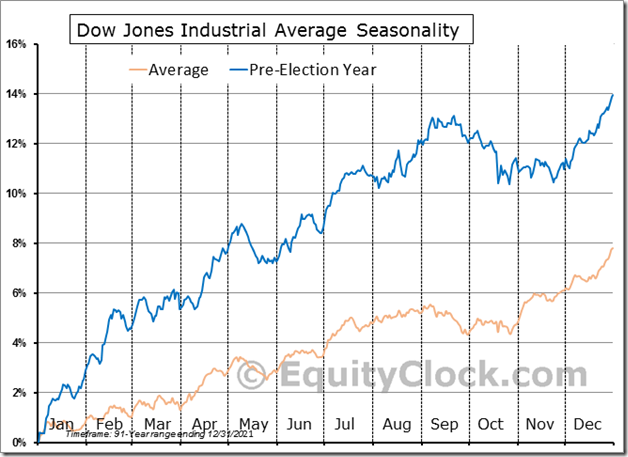
Historically, the third year (i.e. Pre-election year) of the U.S. Presidential Cycle (e.g. 2023) is the best year for broadly based U.S. equity indices. However, note Tom McClellan’s qualification later in this report.
Consensus for Earnings and Revenues for S&P 500 Companies
Not available this week
Economic News This Week
November Construction Spending released at 10:00 AM EST on Tuesday is expected to drop 0.4% versus a decline of 0.3% in October.
December ISM Manufacturing PMI released at 10:00 AM EST on Wednesday is expected to slip to 48.5 from 49.0 in November.
November U.S. Trade Deficit released at 8:30 AM EST on Thursday is expected to slip to $76.4 billion from $78.20 billion in October.
November Canadian Trade released at 8:30 AM EST on Thursday is expected to slip to a surplus of $0.50 billion from $1.21 billion in October.
December Non-Farm Payrolls released at 8:30 AM EST on Friday is expected to increase 200,000 versus a gain of 263,000 in November. December Unemployment Rate is expected to remains unchanged from November at 3.7%. December Average Hourly Earnings are expected to increase 0.4% versus a gain of 0.6% in November. On a year-over-year basis, December Average Hourly Earnings are expected to increase 5.0% versus a gain of 5.1% in November.
December Canadian Employment released at 8:30 AM on Friday is expected to increase 5,000 versus a gain of 10,100 in November. December Canadian Unemployment Rate is expected to increase to 5.2% from 5.1% in November.
November Factory Orders released at 10:00 AM EST on Friday are expected to drop 0.8% versus a gain of 1.0% in October.
December ISM Non-Manufacturing ISM released at 10:00 AM EST on Friday is expected to drop to 55.0 from 56.5 in November.
Selected Earnings News This Week
Thursday: Constellation Brands, Walgreens Boots, ConAgra, Bed Bath & Beyond
Trader’s Corner
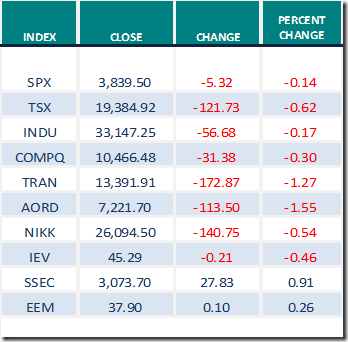
Equity Indices and Related ETFs
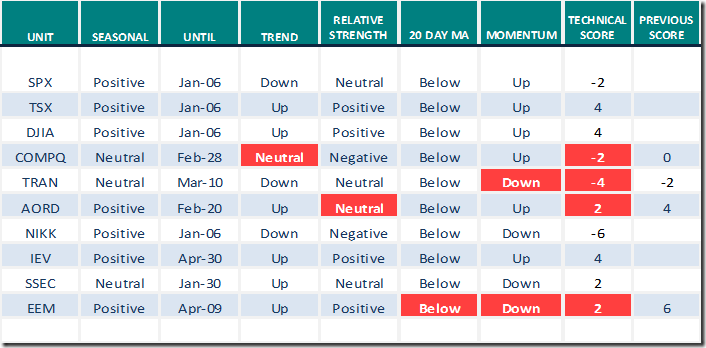
Daily Seasonal/Technical Equity Trends for December 30th 2022
Green: Increase from previous day
Red: Decrease from previous day
Commodities
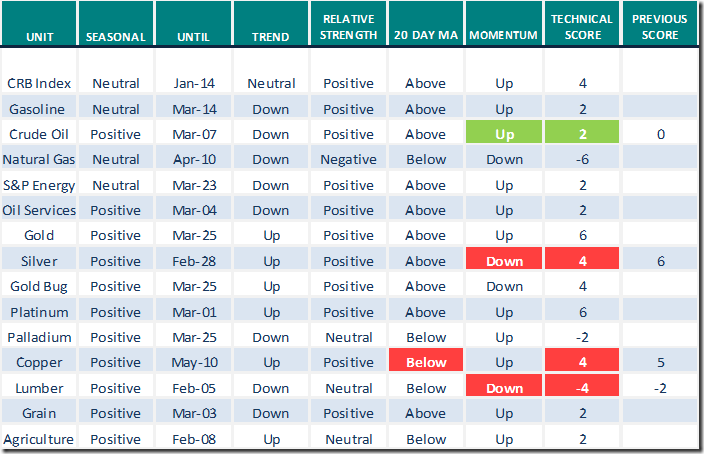
Daily Seasonal/Technical Commodities Trends for December 30th 2022
Green: Increase from previous day
Red: Decrease from previous day
Sectors
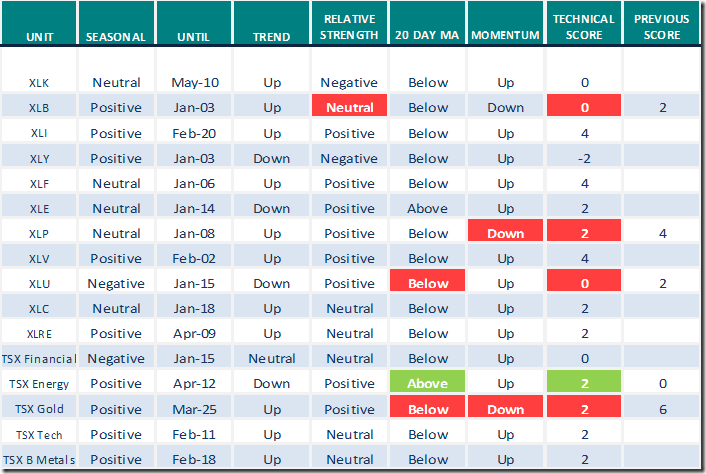
Daily Seasonal/Technical Sector Trends for December 30th 2021
Green: Increase from previous day
Red: Decrease from previous day
Technical Scores
Calculated as follows:
Intermediate Uptrend based on at least 20 trading days: Score 2
(Higher highs and higher lows)
Intermediate Neutral trend: Score 0
(Not up or down)
Intermediate Downtrend: Score -2
(Lower highs and lower lows)
Outperformance relative to the S&P 500 Index: Score: 2
Neutral Performance relative to the S&P 500 Index: 0
Underperformance relative to the S&P 500 Index: Score –2
Above 20 day moving average: Score 1
At 20 day moving average: Score: 0
Below 20 day moving average: –1
Up trending momentum indicators (Daily Stochastics, RSI and MACD): 1
Mixed momentum indicators: 0
Down trending momentum indicators: –1
Technical scores range from -6 to +6. Technical buy signals based on the above guidelines start when a security advances to at least 0.0, but preferably 2.0 or higher. Technical sell/short signals start when a security descends to 0, but preferably -2.0 or lower.
Long positions require maintaining a technical score of -2.0 or higher. Conversely, a short position requires maintaining a technical score of +2.0 or lower
Changes Last Week
Links Offered By Valued Providers
Mark Leibovit comment on December 29th
https://www.howestreet.com/2022/12/gold-and-silver-in-2023-mark-leibovit/
Greg Schnell asks “When should we start to get bullish”?
When Should We Start To Get Bullish? | The Canadian Technician | StockCharts.com
Top 5 New Year’s resolutions every stock trader should make
Top 5 New Year’s Resolutions Every Stock Trader Should Make | ChartWatchers | StockCharts.com
John Hopkins asks “What’s your vision for 2023”?
What’s Your Vision for 2023? | Top Advisors Corner | StockCharts.com
Mish Schneider offers “Tips for trading profitably in a bear market”
Weekend Daily: Tips for Trading Profitably in a Bear Market | Mish’s Market Minute | StockCharts.com
Tom Bowley says “This is the chart is the chart to watch”
This Is The Chart To Watch | Don’t Ignore This Chart! | StockCharts.com
Tom McClellan says “Third year of Presidential term is supposed to be bullish”
3rd Year of Presidential Term is Supposed to Be Bullish | Top Advisors Corner | StockCharts.com
The Economy in 2023: Jeremy Siegel’s Forecast – Wharton Business Daily Interview
The Economy in 2023: Jeremy Siegel’s Forecast – Wharton Business Daily Intervew – YouTube
Goldman’s Currie Says Commodities Will Surge in 2023
Goldman’s Currie Says Commodities Will Surge in 2023 – YouTube
Todd Horwitz says “Gold price to ‘explode’ in 2023”.
Tom Bowley says “Watch Market Vision 2023”
Market Vision 2023 | January 7, 9 AM ET | Free Virtual Event – YouTube
Victor Adair’s Trading Desk Notes for December 31st
https://www.howestreet.com/2022/12/trading-desk-notes-for-december-31-2022/
Bob Hoye asks “Will gold and the U.S. Dollar outperform the stock market in 2023?
Will Gold and US Dollar Out Perform 2023 Stock Market? – HoweStreet
Technical Notes for Friday
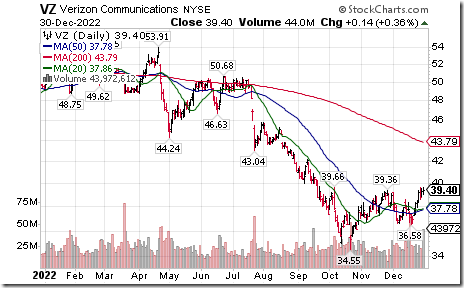
Verizon $VZ a Dow Jones Industrial Average stock moved above $39.36 extending an intermediate uptrend.The stock was selected as a Top Pick in 2023 among the “Dogs of the Dow” stocks.
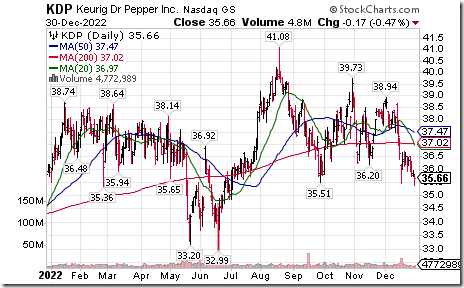
Keurig Dr. Pepper $KDP a NASDAQ 100 stock moved below $35.51 extending an intermediate downtrend.
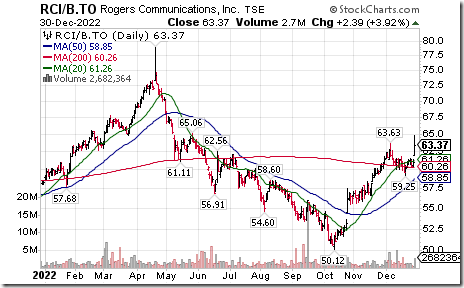
Rogers Communications $RCI.B.TO $RCI a TSX 60 stock moved above Cdn$63.63 and US$46.51 extending an intermediate uptrend. The company received next stage approval for purchase of Shaw Communications.
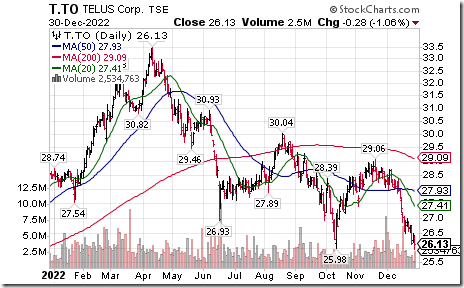
Telus $T.TO a TSX 60 stock moved below $25.98 extending an intermediate downtrend.
S&P 500 Momentum Barometers
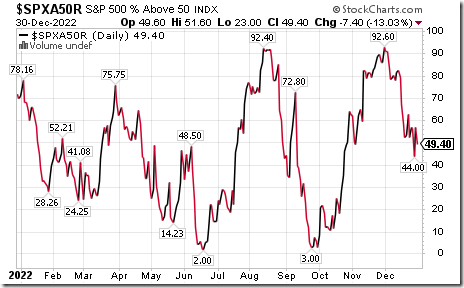
The intermediate term Barometer dropped 7.40 on Friday and 7.60 last week to 49.40. It remains Neutral. Trend is down.
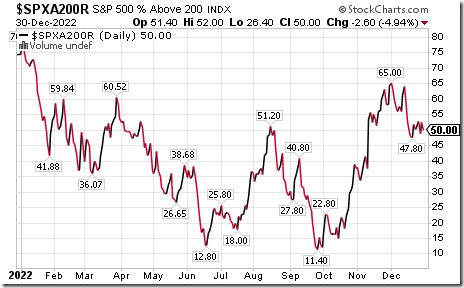
The long term Barometer slipped 2.60 on Friday and 1.80 last week to 50.00. It remains Neutral. Trend is down.
TSX Momentum Barometers
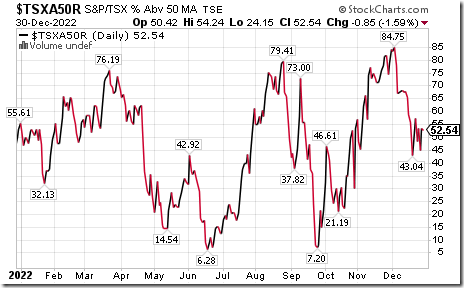
The intermediate term Barometer slipped 0.85 on Friday and slipped 0.85 last week to 52.54. It remains Neutral..
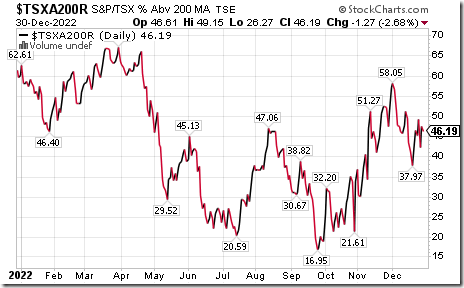
The long term Barometer slipped 1.27 to 46.19 on Friday and 2.96 last week to 46.19. It remains Neutral.
Disclaimer: Seasonality ratings and technical ratings offered in this report and at
www.equityclock.com are for information only. They should not be considered as advice to purchase or to sell mentioned securities. Data offered in this report is believed to be accurate, but is not guaranteed


