
The Bottom Line
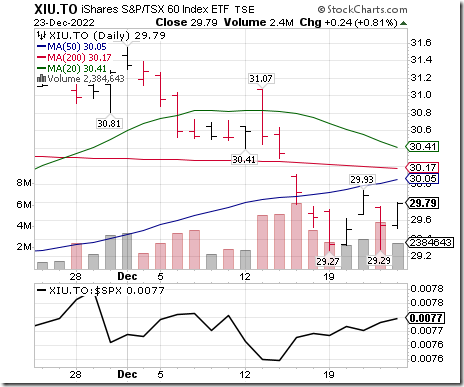
‘Tis the season for the TSX 60 Index and its related ETF: XIU.TO to move higher and to outperform the S&P 500 Index from December 14th to March 7th! Both currently are lower from their close on December 14th, but both have nicely outperformed the S&P 500 on schedule.
From www.EquityClock.com
Analysis of the iShares S&P/TSX 60 Index ETF (TSE:XIU.TO) seasonal charts shows that a Buy Date of December 14 and a Sell Date of March 7 has resulted in a geometric average return of 2.43% above the benchmark rate of the S&P 500 Total Return Index over the past 20 years. This seasonal timeframe has shown positive results compared to the benchmark in 16 of those periods. This is a very good rate of success and the return strongly outperforms the relative buy-and-hold performance of the stock over the past 20 years by an average of 4.08% per year.
Consensus for Earnings and Revenues for S&P 500 Companies
Not available this week.
Economic News This Week
Nil
Selected Earnings News This Week
Nil
Trader’s Corner
Equity Indices and Related ETFs
Daily Seasonal/Technical Equity Trends for December 23rd 2022
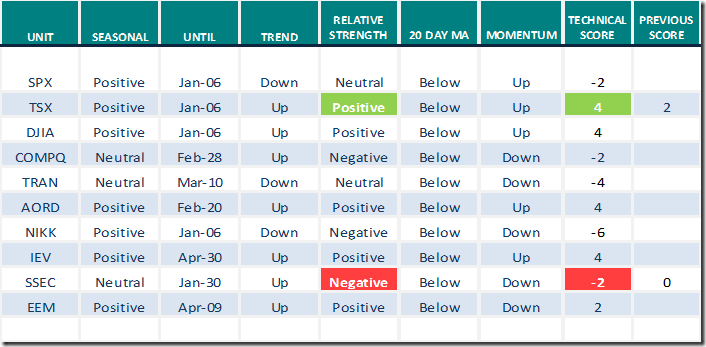
Green: Increase from previous day
Red: Decrease from previous day
Commodities
Daily Seasonal/Technical Commodities Trends for December 23rd 2022
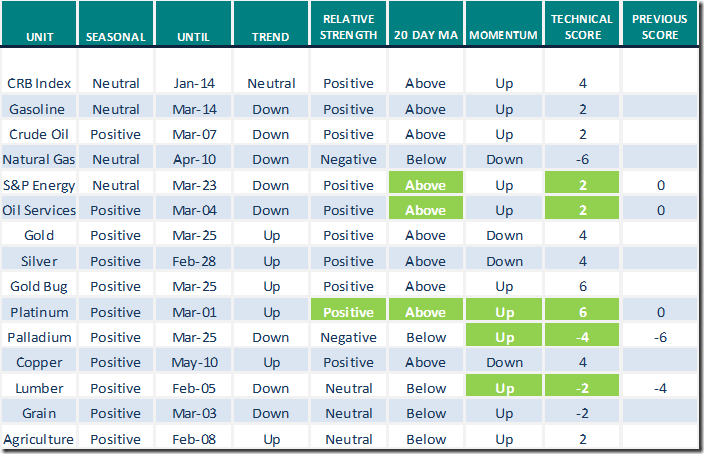
Green: Increase from previous day
Red: Decrease from previous day
Sectors
Daily Seasonal/Technical Sector Trends for December 23rd 2021
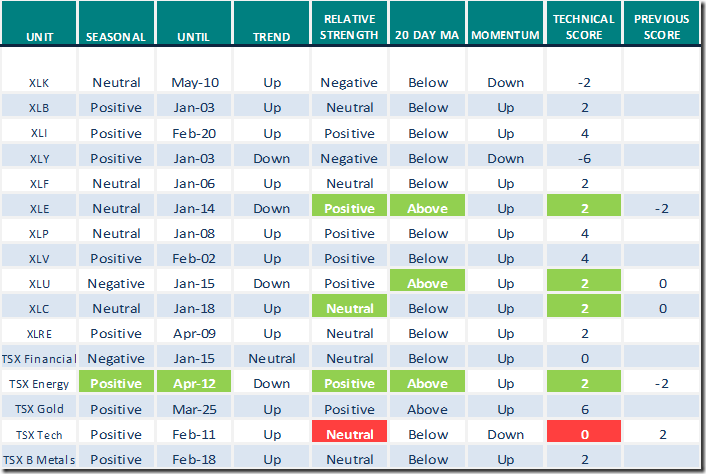
Green: Increase from previous day
Red: Decrease from previous day
Technical Scores
Calculated as follows:
Intermediate Uptrend based on at least 20 trading days: Score 2
(Higher highs and higher lows)
Intermediate Neutral trend: Score 0
(Not up or down)
Intermediate Downtrend: Score -2
(Lower highs and lower lows)
Outperformance relative to the S&P 500 Index: Score: 2
Neutral Performance relative to the S&P 500 Index: 0
Underperformance relative to the S&P 500 Index: Score –2
Above 20 day moving average: Score 1
At 20 day moving average: Score: 0
Below 20 day moving average: –1
Up trending momentum indicators (Daily Stochastics, RSI and MACD): 1
Mixed momentum indicators: 0
Down trending momentum indicators: –1
Technical scores range from -6 to +6. Technical buy signals based on the above guidelines start when a security advances to at least 0.0, but preferably 2.0 or higher. Technical sell/short signals start when a security descends to 0, but preferably -2.0 or lower.
Long positions require maintaining a technical score of -2.0 or higher. Conversely, a short position requires maintaining a technical score of +2.0 or lower
Changes Last Week
Links offered by valued providers
Mark Leibovit’s comment for December 22nd
2023 Stock Markets, Gold, US Dollar, Interest Rates, Cryptos – HoweStreet
Tom Bowley offers “Tips for trading success”
Tips For Trading Success | Tom Bowley | Trading Places (12.22.22) – YouTube
An interview with Tom Dorsey and Ralph Acampora
https://get.investors.com/podcast/?src=A00511A
Greg Schnell discusses “A Chilly Ending”
A Chilly Ending | The Canadian Technician | StockCharts.com
Dave Keller offers “Ten questions that every investor should ask at yearend”
My Worst Call of the Year | The Mindful Investor | StockCharts.com
Top five charts every trader needs to watch in 2023
Top 5 Charts Every Trader Needs to Watch in 2023 | ChartWatchers |
StockCharts.com
Erin Swenlin notes “Crude oil (USO) flashes a PMO Buy Signal while long term bonds flash a PMO sell signal”
Bob Hoye asks “Where is the Christmas Rally”?
Where is the Santa Claus Rally? – HoweStreet
Josef Schachter discusses “Cold snap energy demand”.
Cold Snap Energy Demand – HoweStreet
Market Watch notes “How a Santa Claus rally sets the stage for the first quarter”
S&P 500 Momentum Barometers
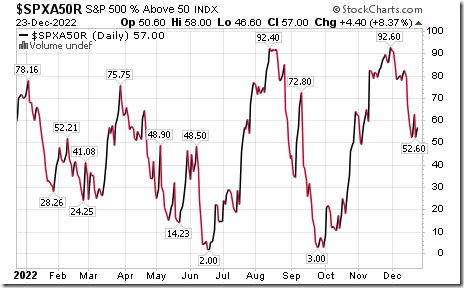
The intermediate term Barometer added 4.40 on Friday, but slipped 1.80 last week to 57.00. It remains Neutral. Trend is down.
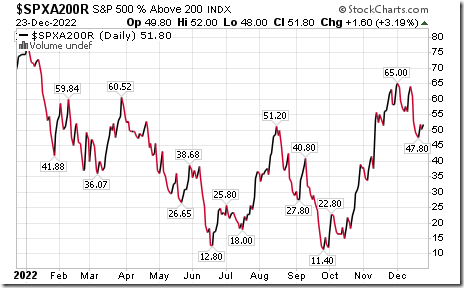
The long term Barometer added 1.60 on Friday and 2.40 last week. It remains Neutral. Trend is down.
TSX Momentum Barometers
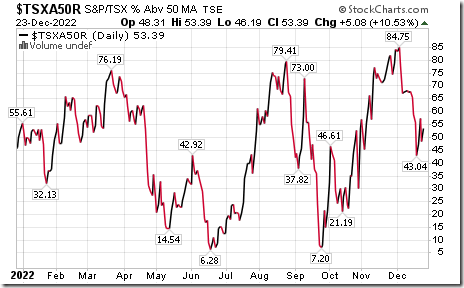
The TSX Barometer added 5.08 on Friday, but dropped 2.31 last week to 53.39. It remains Neutral. Trend is down.
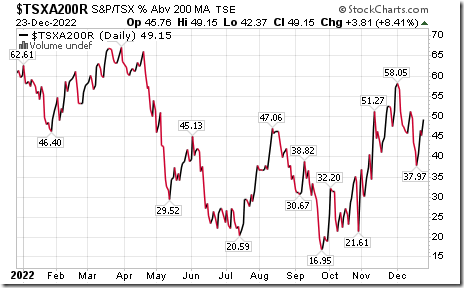
The long term Barometer added 3.81 on Friday and 7.80 last week to 49.15. It remains Neutral. Trend remains down.
Disclaimer: Seasonality ratings and technical ratings offered in this report and at
www.equityclock.com are for information only. They should not be considered as advice to purchase or to sell mentioned securities. Data offered in this report is believed to be accurate, but is not guaranteed