by Eugenio Alemán, Chief Economist, Raymond James
Chief Economist Eugenio J. Alemán discusses current economic conditions.
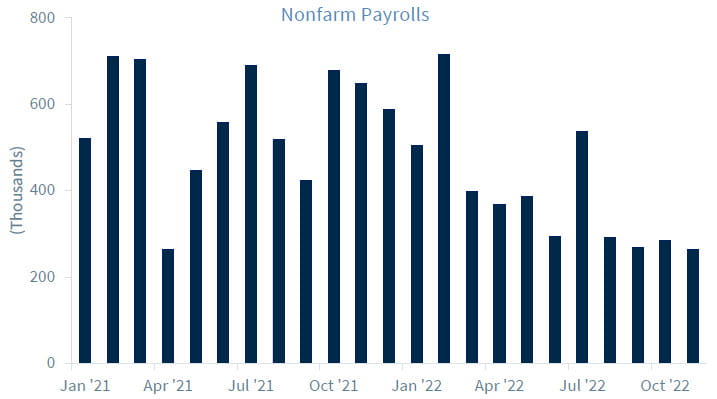
While economists have been lowering their employment forecast month over month over month, the U.S. labor market has continued to disappoint those forecasts and has remained relatively strong as well as relatively stable, with jobs growing at an average of 392,000 per month during 2022.
November did not disappoint this trend, although it disappointed economists and probably the Federal Reserve (Fed), as the Fed needs to see the labor market weaken considerably in order to put an end to the increases in the federal funds rate. Furthermore, markets are going to be disappointed because they have been ‘fishing’ for data that will support their desire to see the Fed end its rate increase campaign and this November report was not reassuring.
But as we have been saying for a long time, as long as the service sector continues to boom, it is highly unlikely that the U.S. labor market would slow down considerably, and all indicators have continued to point to a still strong service sector. Furthermore, recall that this holiday shopping season is going to be the first fully ‘reopened’ holiday shopping season in two years, so Americans are probably hitting the ground running during the last month of the year. Thus, we should not expect to put a ‘RIP’ sign on the labor market just yet.
Next year, and once the holiday shopping season is over, well, that is a different story. But for now, Americans seem to be plowing along and if the labor market continues to remain strong, they will continue to borrow in order to support spending because they can. As long as the labor market remains strong, consumers will feel that they will be able to pay back those debts.
Thus, the fact that this will be the first holiday shopping season without a pandemic affecting behavior plus the added benefit of a strong labor market, will probably guarantee that the economy will stay the course for what is left of this year.
Personal Income and Spending in October
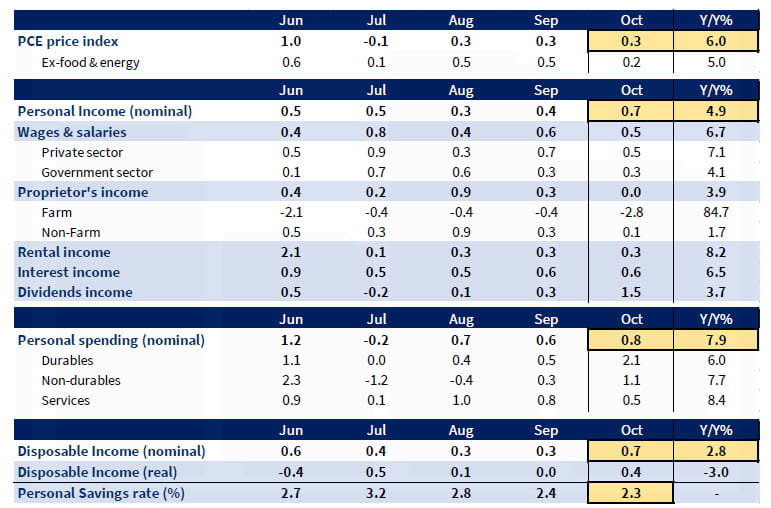
Both personal income and personal spending were strong in October, according to the Bureau of Economic Analysis (BEA). Personal income increased 0.7% in October at a seasonally adjusted annual rate, while personal consumption expenditures (PCE) increased by 0.8%. The largest contributors to October’s increase in personal income were a 1.0% increase in personal income receipts on assets and a 1.6% increase in personal current transfer receipts. Wages and salaries were up 0.5% while supplements to wages and salaries were up 0.4% during the month.
The improvement in inflation meant that real disposable personal income increased 0.4% in October after being flat in September. The not so good news was that part of this increase was due to the increase in transfer payments. Real personal income excluding transfer receipts increased 0.2% during the month of October.
On a year-over-year basis, real disposable personal income remains in negative territory, down 3.0% in October compared to a decline of 3.4% in September, but it is on an improving trend. However, the 12-month moving average is still not improving. Real disposable personal income was down 6.1% on a 12-month moving average basis in October after being down on a 12-month moving average in September of this year.
As inflation continues to improve, these measures of income are going to continue to improve as well but for now, it means that the consumers are still struggling due to the still difficult inflation environment. Thus, Americans have continued to bring down savings in order to continue to consume even if they still have some savings available from what had been accumulated during the two years of the COVID-19 pandemic. Furthermore, Americans are also using their credit cards to complement incomes to continue consuming. However, this process cannot go on forever, so we are expecting PCE to continue to slow going forward.
Revision to U.S. GDP for Q3 2022
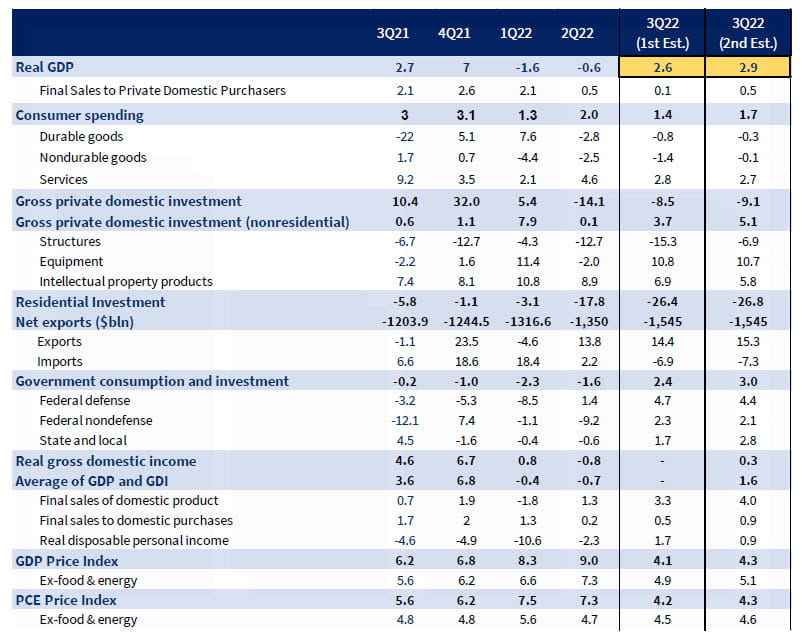
The Bureau of Economic Analysis (BEA) upwardly revised the growth rate of the U.S. economy during the third quarter of this year, from an original increase of 2.6% at a seasonally adjusted annual rate to 2.9%. The largest changes to the third quarter result were stronger consumer demand for goods and an improvement in nonresidential investment. Although consumption of goods remained negative during the quarter, it was revised from a decline of 1.2% to a decline of just 0.2%. Both durable and nondurable goods consumption was better than originally reported even though they remained in negative territory. Durable goods consumption was revised upward from a decline of 0.8% to a decline of 0.3% while nondurable goods consumption was revised up from -1.4% to a decline of just 0.1%.
Nonresidential fixed investment was also revised up, from an original increase of 3.7% to an increase of 5.1%. The biggest reason for the improvement in nonresidential fixed investment was the improvement to nonresidential structures investment, which was originally reported to have declined by 15.3% but was revised to a decline of just 6.9%.
Even with this improved performance during the third quarter, the U.S. economy remained weak with net exports being the largest contributors to growth during the quarter, at 2.9% compared to an estimated contribution of 2.8% during the advanced release. Thus, we expect the economy to continue to weaken in the next couple of quarters with a mild recession hitting the economy during the second quarter of 2023.
Economic and market conditions are subject to change.
Opinions are those of Investment Strategy and not necessarily those Raymond James and are subject to change without notice the information has been obtained from sources considered to be reliable, but we do not guarantee that the foregoing material is accurate or complete. There is no assurance any of the trends mentioned will continue or forecasts will occur last performance may not be indicative of future results.
Consumer Price Index is a measure of inflation compiled by the U.S. Bureau of Labor Studies. Currencies investing are generally considered speculative because of the significant potential for investment loss. Their markets are likely to be volatile and there may be sharp price fluctuations even during periods when prices overall are rising.
Consumer Sentiment is a consumer confidence index published monthly by the University of Michigan. The index is normalized to have a value of 100 in the first quarter of 1966. Each month at least 500 telephone interviews are conducted of a contiguous United States sample.
Personal Consumption Expenditures Price Index (PCE): The PCE is a measure of the prices that people living in the United States, or those buying on their behalf, pay for goods and services. The change in the PCE price index is known for capturing inflation (or deflation) across a wide range of consumer expenses and reflecting changes in consumer behavior.
Consumer confidence index is an economic indicator published by various organizations in several countries. In simple terms, increased consumer confidence indicates economic growth in which consumers are spending money, indicating higher consumption.
The Consumer Confidence Index (CCI) is a survey, administered by The Conference Board, that measures how optimistic or pessimistic consumers are regarding their expected financial situation.
Leading Economic Indicators: The Conference Board Leading Economic Index is an American economic leading indicator intended to forecast future economic activity. It is calculated by The Conference Board, a non-governmental organization, which determines the value of the index from the values of ten key variables
Certified Financial Planner Board of Standards Inc. owns the certification marks CFP®, CERTIFIED FINANCIAL PLANNER™, CFP® (with plaque design) and CFP® (with flame design) in the U.S., which it awards to individuals who successfully complete CFP Board's initial and ongoing certification requirements.
Currencies investing are generally considered speculative because of the significant potential for investment loss. Their markets are likely to be volatile and there may be sharp price fluctuations even during periods when prices overall are rising.
The STOXX Europe 600, also called STOXX 600, SXXP, is a stock index of European stocks designed by STOXX Ltd. This index has a fixed number of 600 components representing large, mid and small capitalization companies among 17 European countries, covering approximately 90% of the free-float market capitalization of the European stock market (not limited to the Eurozone).
Geographical Revenues: Overall country-specific revenues as a percentage of total revenues from a specific index such as the S&P 500 or the STOXX Europe 600.
Source: FactSet, data as of 9/30/2022


