
by Rick Rieder, Managing Director, Chief Investment Officer, Global Fixed Income, Blackrock
Over the last few months, the Federal Reserve (Fed) has changed its angle of attack quite dramatically, in an attempt to battle surprisingly and stubbornly high inflation. There is nothing wrong with this – pilots often do it due to unforeseen circumstances, be it inclement weather or crowded skies. However, forcing a plane into a nosedive to create a more immediate path to the runway could risk life and limb, while trying to move the runway itself would, of course, be futile. Instead, simply allowing the pilot’s skill with the instruments in the cockpit to guide a plane back to the right trajectory is much more likely to engineer a desired soft landing, even if it results in a 20- or 30-minute delay.
So, what are the economic indicators telling the Fed today, and can it engineer a soft landing? Inflation data has suggested that the Fed’s policy trajectory was far too shallow earlier this year. While data in August might seem to reinforce this by its ubiquitous strength, the Fed has already made substantial corrections to the trajectory of interest rates, with the policy rate now above most estimates of “neutral,” with more tightening to come. While August’s 8.3% inflation is much too high, suggesting that there is work still to be done, the Fed can exhale slightly knowing that July’s print was the first miss in 18 months, and that June’s peak is unlikely to be exceeded in the foreseeable future. The challenge will be to continue making progress on the inflation front without sending the labor market into a nosedive.
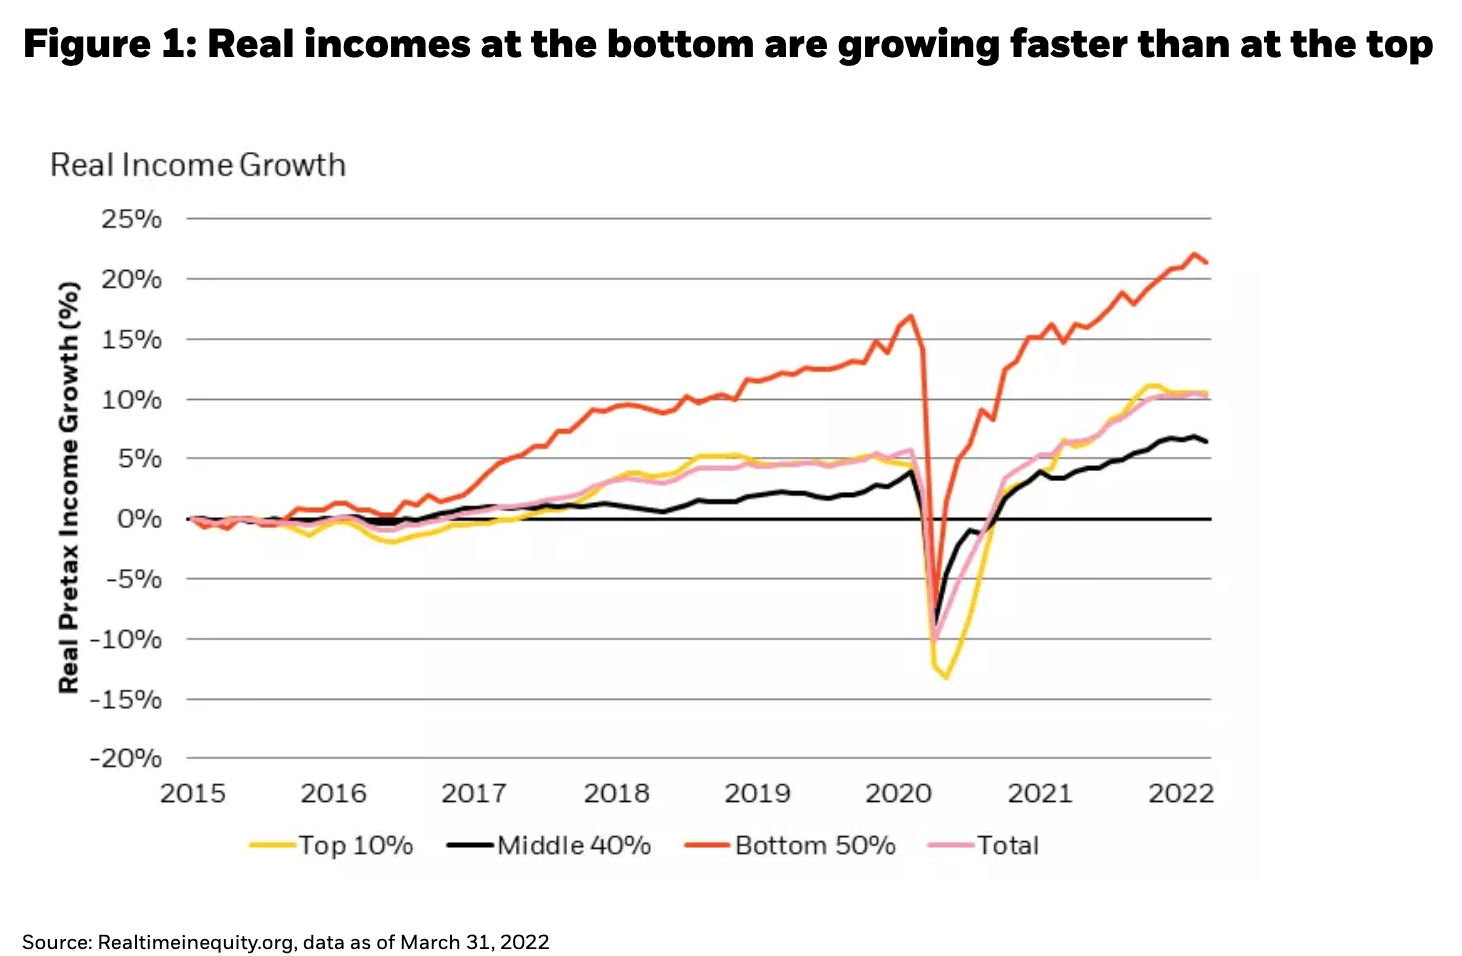
There is much to appreciate in recent employment reports: while the strongest labor market in decades has, rightly, been identified as one of the causes of inflation, it also means that it can withstand an unusually stern degree of policy tightening without crashing. And one of the reasons not to deliberately crash the labor market is the equitable distribution of income that has accompanied this rude health. The bottom half of earners have seen real incomes grow faster than the top 10%, an unusual pattern that should be nurtured, not nixed (see Figure 1).
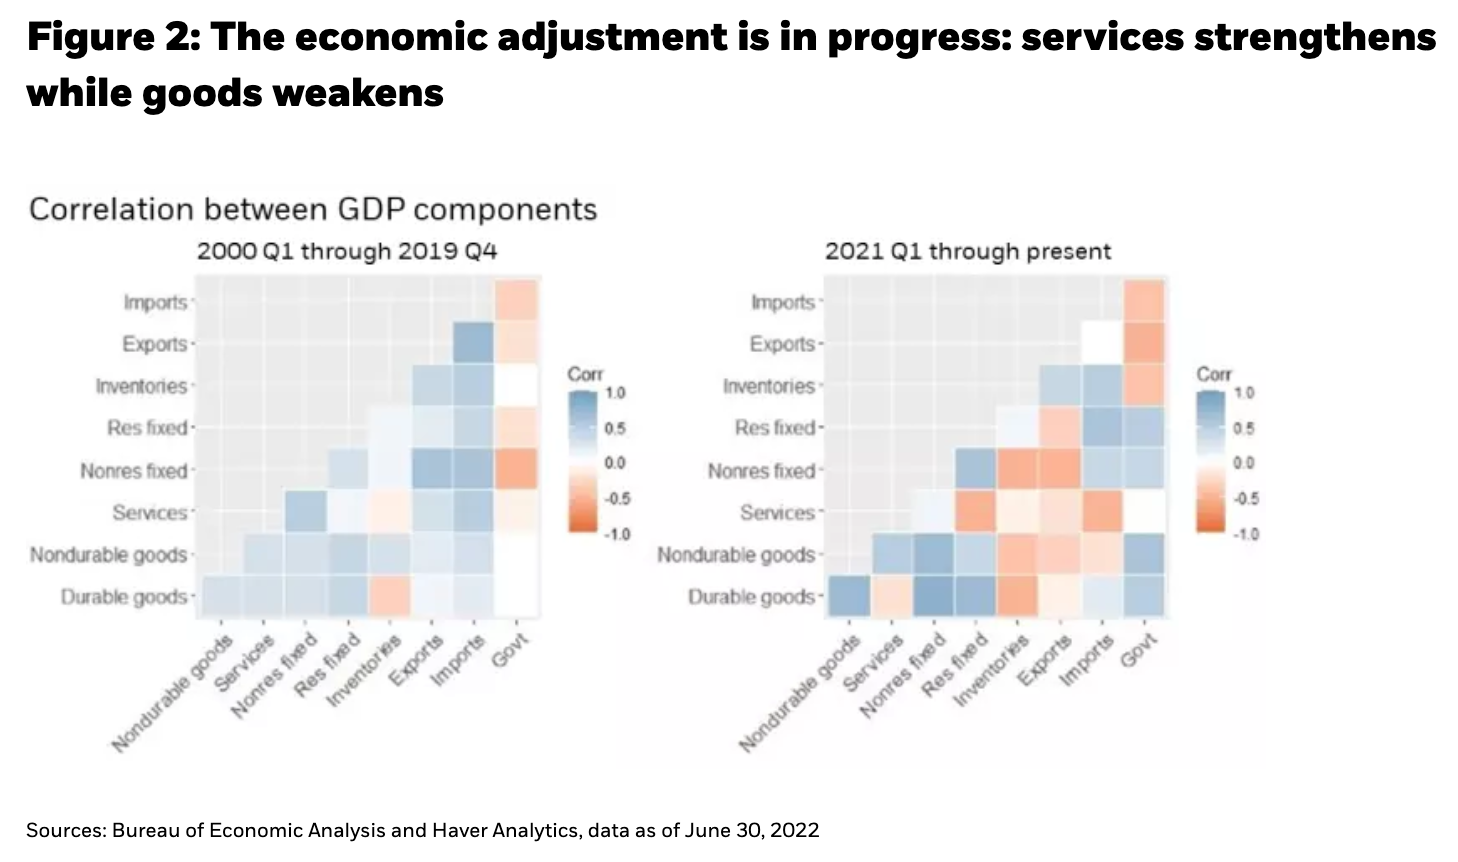
Preserving the current state of the labor market may not be as difficult as it appears. The U.S. economy is an adaptive and flexible one, and over time, has shown an ability to dynamically reallocate resources (labor and capital) to where they are needed. This happened in the early stages of the pandemic, as the services component of GDP detracted from growth, while goods gained ground (see Figure 2). Today that trend is being reversed, both in terms of output and its impact on the labor market. We often view net job gains of 300K a month as a strong number, but the reality under the surface is staggering – a full 30% of all unemployed people find a job each month, and over 6 million people churn through from one job to the next…every month.
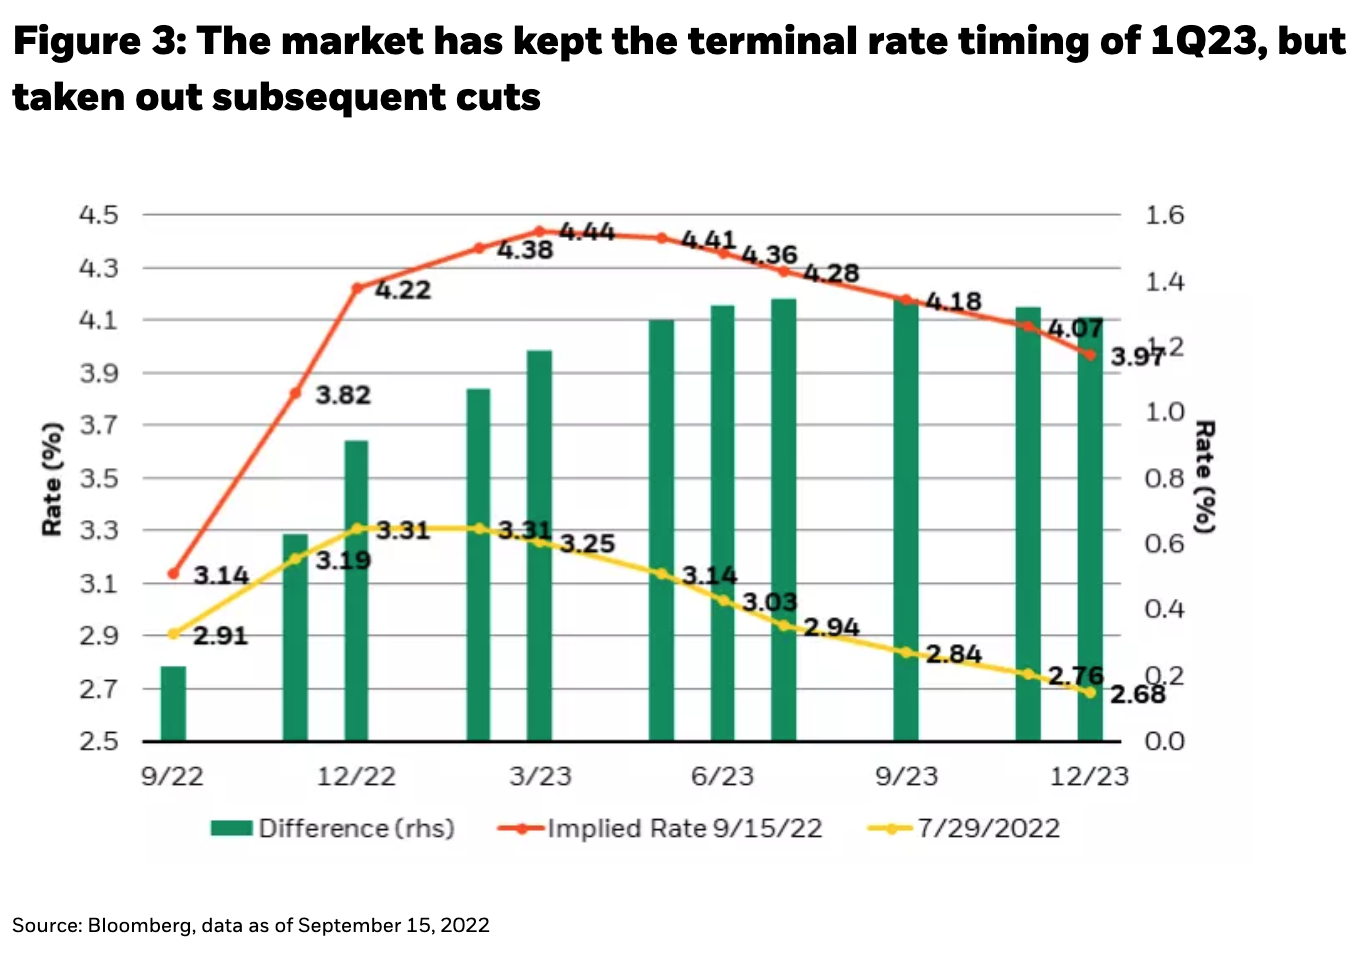
The more gentle, natural, path back down to the runway means the policy rate should probably stay above neutral, but not excessively above, for a longer duration, rather than to an ever-higher peak. After a series of rapid movements into restrictive territory, the market has started pricing this very trajectory – “taking out cuts” from 2023 rather than “adding more hikes,” resulting in a flattening out of the “hump” in the curve (see Figure 3).
While inflation is clearly uncomfortably high, the Fed needs to work hard to read the collective suite of instruments at its disposal and not disrupt the economic plane’s adaptive and flexible adjustment process by yanking rates much higher for longer until inflation is forced down – possibly confusing the instrument panel and crash-landing the plane. We think there is ample room for the Fed to maneuver the U.S. economy into a gentler approach, even if it takes six months more than otherwise, in order to lower the risk of derailing the labor market’s strength via a crash landing (though some other global economies may not have that luxury). To be sure, it is a fine line between showing sufficient near-term aggression, allowing for recalibration, but not over-tightening.
This policy posture inevitably means slower growth, which may be intimidating, but in the current inflation regime should be expected and even welcomed. At the same time, there is enough data to suggest that the sky is not falling. Consumption, industrial production, and capital expenditures are all still booming, while the unambiguously strong labor market takes impending disaster off the table. Job growth remains well above pre-pandemic rates with almost no slack in the labor market.
And there are still significant pockets of dry powder for continued consumption. Auto sales (and inventories) have languished due to supply chain issues, meaning there is room for real growth as those issues clear up; growth that can offset weakness in sectors like housing, which has had an excellent run but is running into higher mortgage rates. Notably, housing inventories themselves remain severely depleted, suggesting that the U.S. is still short up to 5 million units, greatly reducing the chances that higher mortgage rates single-handedly crater the housing market. Further, if house prices hold up (albeit they stop appreciating) there is still a historically healthy $10 trillion in new, untapped, home equity. That is not to say that higher fuel and food costs aren’t hurting consumption potential, particularly for the lowest income cohorts, they are, but the starting point and potential endurance of the consumer is arguably better than at any time in recent history, at least in the U.S.
Follow Rick Rieder on Twitter
Things look a bit different outside the U.S., though. Europe is facing economic and concurrently unclear policy complications that are in some ways similar to the U.S., but in many ways are much worse. The amount of fuel in the ‘economic tank’ is dependent on the strength of the labor market and the rate at which inflation is coming down. There is a lot less fuel in the tank in Europe than the U.S., and we think the European Central Bank’s (ECB) hawkish path, while necessary, is much more likely to result in demand destruction, making financial asset returns more unclear from here and consequently requiring a more conservative asset allocation mix.
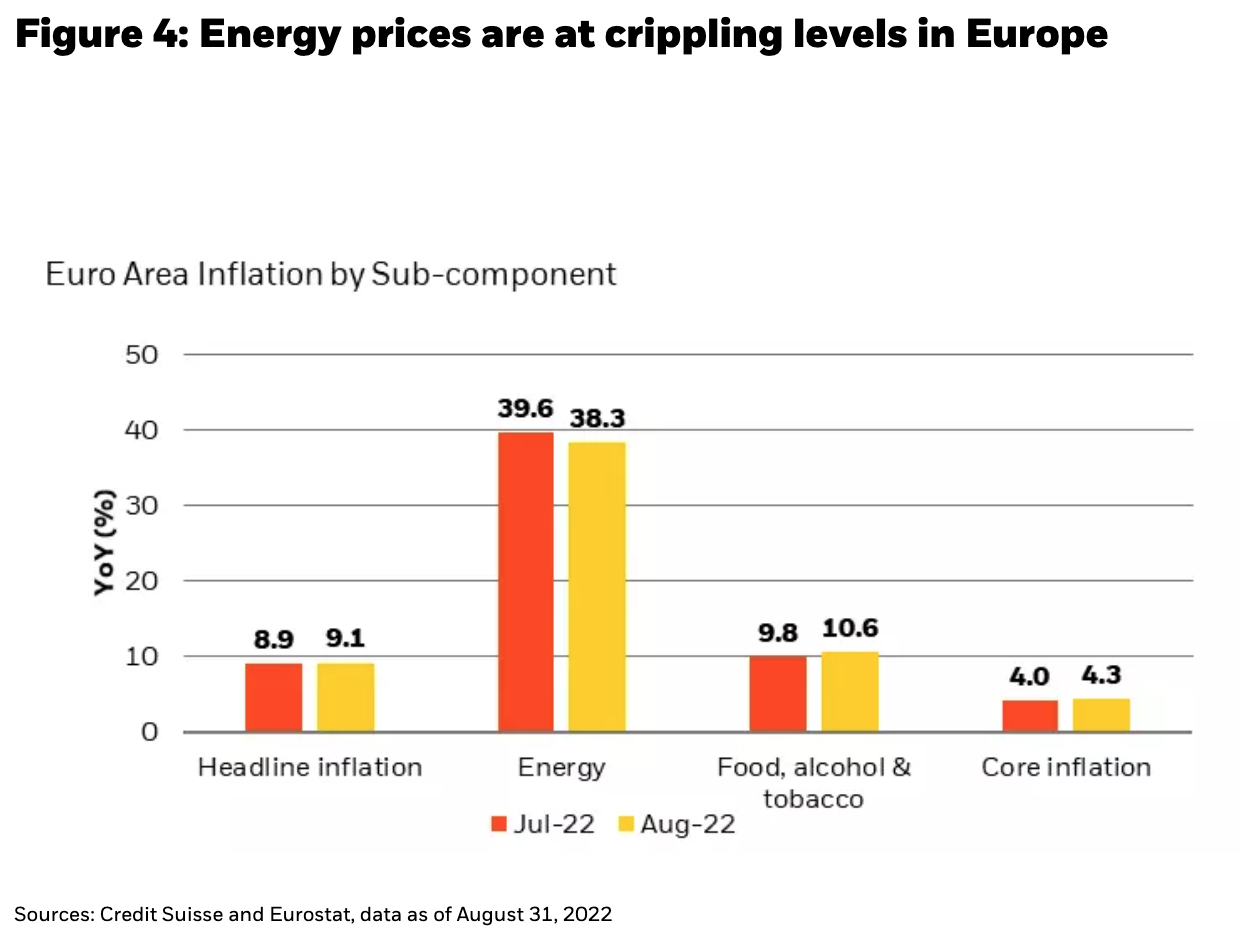
Moreover, while the labor market in Europe remains encouragingly firm, soaring natural gas and electricity prices (see Figure 4) mean that the economic plane cannot afford to circle around too much – or risk running out of gas (quite literally). There are other considerations that warrant a conservative posture, including continued bias towards being long the U.S. dollar. The continued property crisis in China and limited stimulus transmission mean that China’s heavy debt burden is not being alleviated, as M2 velocity remains sluggish. And in the U.S., policy uncertainty has a second angle: the fiscal angle. Control of Congress is projected to shift in Washington, D.C., creating some uncertainty around the nature of government spending at a time when monetary stimulus is already being pared back.
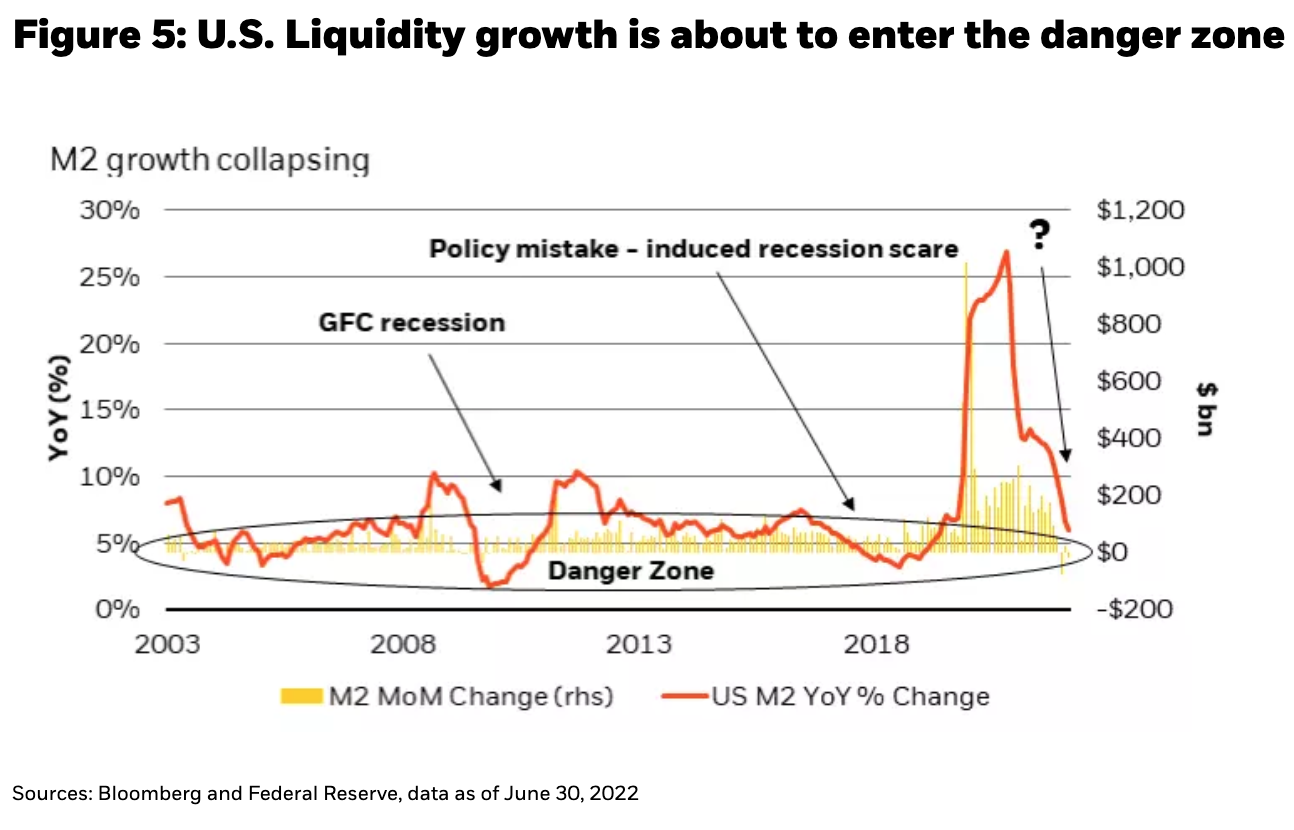
All this raises the question of whether the USD can keep strengthening, despite its 13% rally since the start of this year and its 6% rally in just the last three months. We think the U.S. dollar is becoming the primary mechanism by which further financial tightening expresses itself, and by which portfolios are hedged against an over-tightening or crash-landing scenario. While the easy money has likely been made in the long dollar trade, there is probably still a persistent bid for the currency as global liquidity continues to drain (see Figure 5), and questions around central banks’ abilities to land their respective economic planes do not get answered just yet.
What are the soft-landing investment considerations of all this?
Amidst a long list of economic bad news, there is some good news for portfolios. The front-end of the yield curve now provides a cash surrogate at a very attractive yield without taking much duration, or credit risk, in what is still a risk-laden marketplace. Short-dated credit and securitized assets now yield 4.5% to 6.5%, levels that have not been seen in more than a decade. If we are indeed closer to seeing the high end of a potent 2022 rate tightening cycle (albeit that high mark might be held into 2023) then the front-end at these levels offers a very attractive source of carry for portfolios, with limited downside, in our view. Large cap corporations are not likely to default in the next one to three years, given the underlying strength in the U.S. economy and ample cash on balance sheets, while toplines continue growing, even if at the very least because of inflation. While 1-year yields still carry some interest rate risk, they are overcharging for default risk.
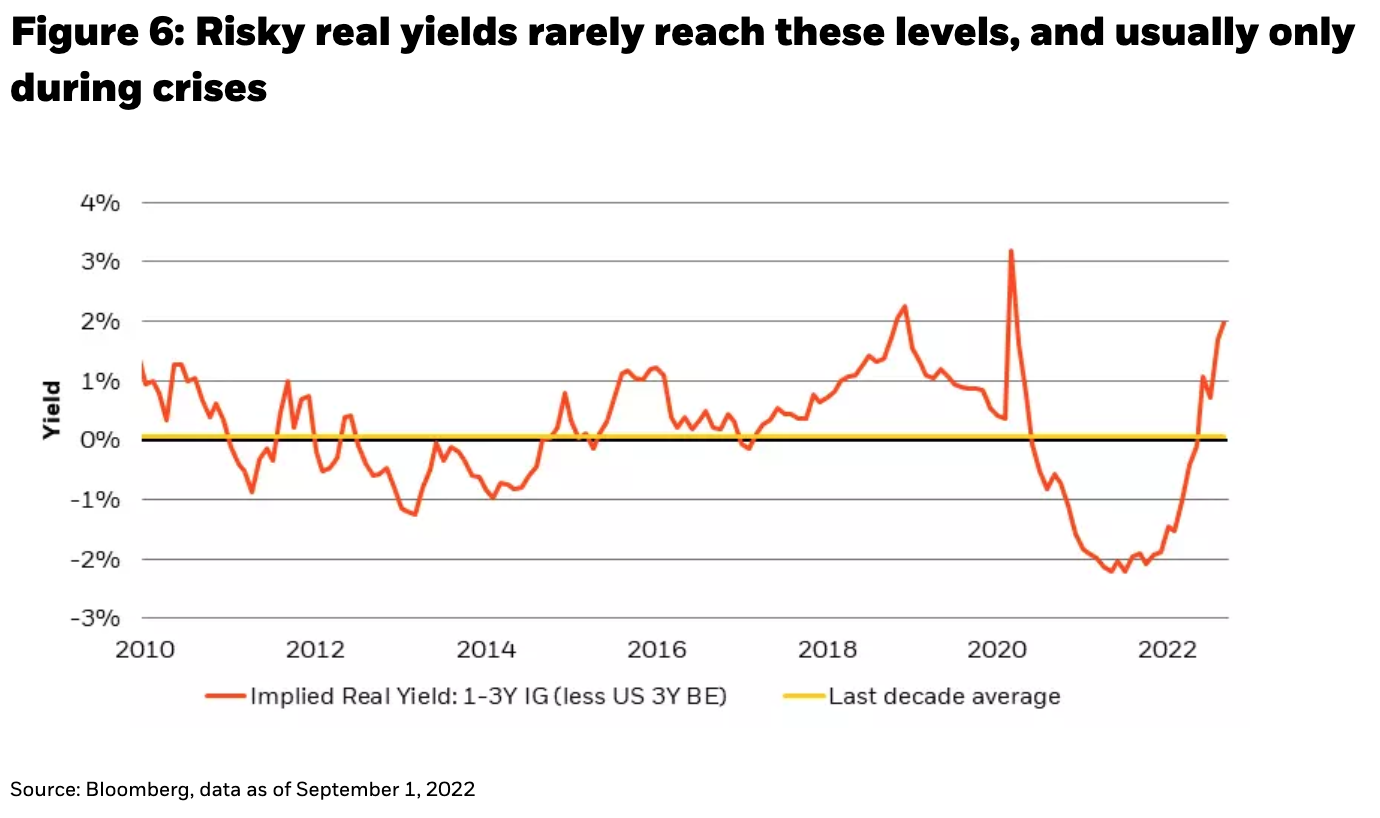
The attraction of front-end yields, and indeed most of fixed income, is further amplified when viewed in real terms. Forward inflation expectations (breakevens) are the lowest they’ve been relative to trailing inflation in decades; the implied risky real yield (yield to an investor after discounting inflation) is in healthy positive territory – a rare phenomenon (see Figure 6). Indeed, many real yields in fixed income today are higher than last year’s nominal yields! Of course, the market could be wrong about forward inflation, but if breakevens are right, many nominal yields are too high. And if breakevens are wrong, we can take comfort in the fact that we are getting the highest nominal front-end yields in a decade, without taking much downside risk compared to other assets with more duration, beta, and/or credit risk. If the first half of this year was about hoarding cash, the last quarter of this year could be about hoarding front end bonds with little-to-no duration and credit risk that deliver a positive real yield, particularly if rates keep adjusting higher.
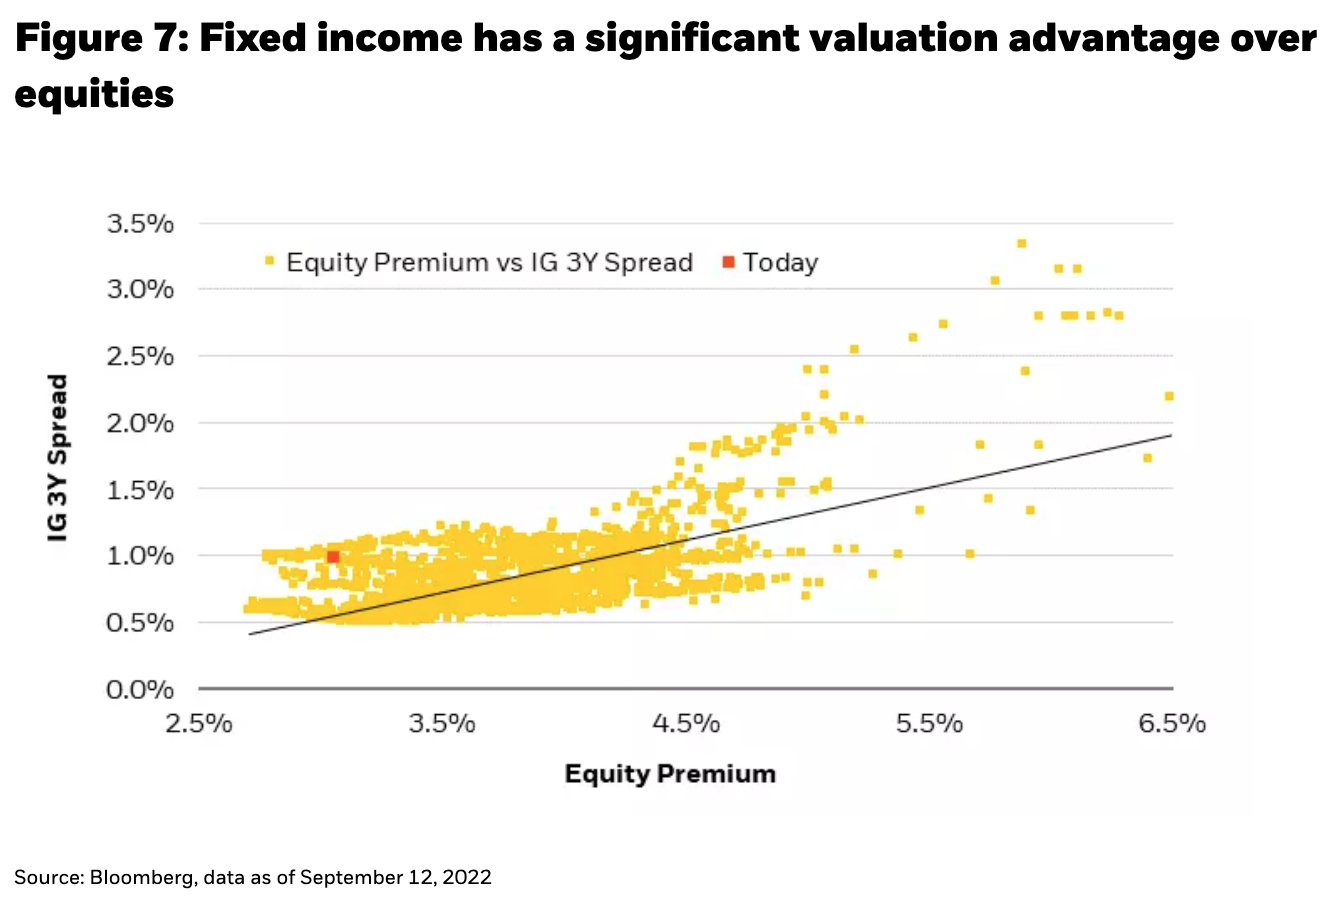
Equities, on the other hand, are not offering the same inflation risk premium that is available in fixed income, with a lot more implicit duration and beta risk, especially as earnings growth flattens out (see Figure 7). Equity yields are not historically high, and while earnings are at record levels, earnings growth (a major driver of equity returns) looks to be slowing in line with the economy. There isn’t a compelling valuation argument to prefer equities over fixed income, but it’s hard to ignore the asset class completely when sentiment and positioning are both at rock bottom, while nominal GDP and corporate buybacks continue to grow at above-average levels, implying that rallies could be more violent in equities than in fixed income.
From a whole-portfolio perspective, today’s investment regime supports building a higher income portfolio, with a lower volatility profile. The level of yields available in fixed income markets allow for such a portfolio to be constructed quite easily (see Figure 8). In November last year, for example, one would have needed 63% of a portfolio to be allocated to equities in order to meet a 7% yield target, but today that drops to 40%.
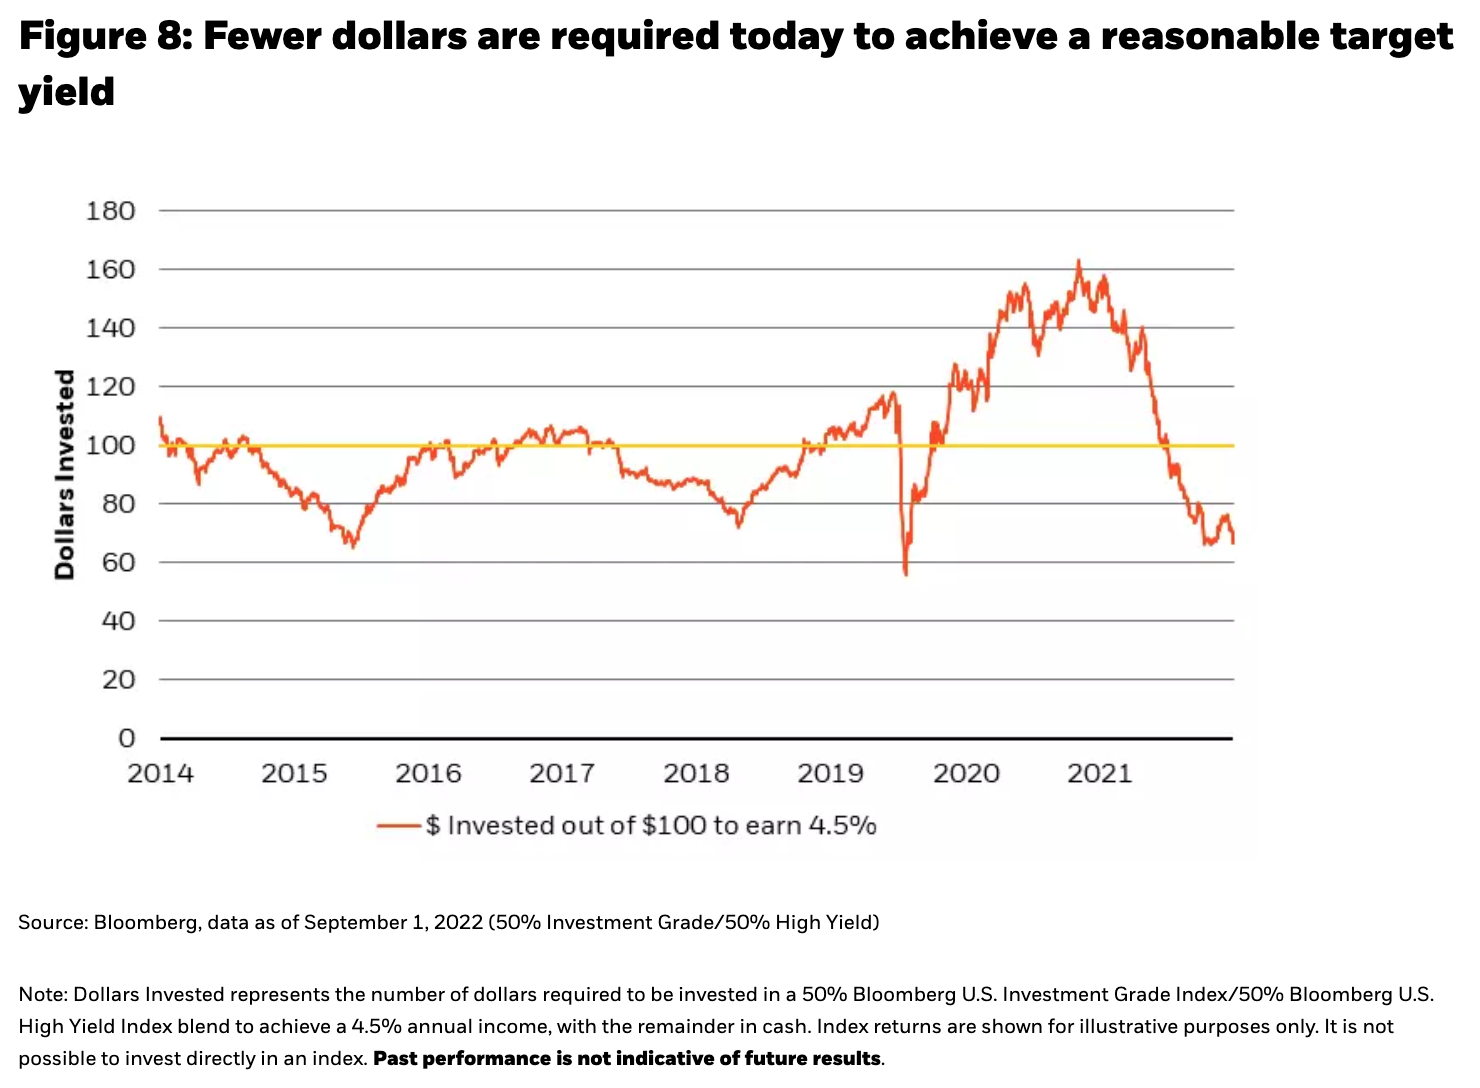
Note: Dollars Invested represents the number of dollars required to be invested in a 50% Bloomberg U.S. Investment Grade Index/50% Bloomberg U.S. High Yield Index blend to achieve a 4.5% annual income, with the remainder in cash. Index returns are shown for illustrative purposes only. It is not possible to invest directly in an index. Past performance is not indicative of future results.
At these levels of yield, not much upside is being given up by allocating marginal dollars to fixed income instead of equities, should a soft landing become more certain, but a lot of potential volatility is being shed. Unless the Fed decides to overtighten policy to dramatically bring down current levels of inflation (attempting to move the runway to meet the plane in our opinion), we believe the investment regime today is becoming ever more attractive for fixed income, especially if one were to take a more medium-term view. Indeed, a high-quality fixed income portfolio with a carry profile north of 6% and a volatility profile of 3% would require a 2 standard deviation negative move just to erase any chance of a positive return over the course of a year.
While most airlines allow only one bag as a ‘carry-on,’ we see a unique opportunity for portfolios to provide financing to companies at historically attractive real rates, and for lower levels of beta, credit, and interest rate risk, which may ’carry-on’ particularly well in the coming months, as the market continues to weigh the probability of a soft landing, even while navigating an unusual degree of turbulence.
 Rick Rieder, Managing Director, is BlackRock’s Chief Investment Officer of Global Fixed Income and is Head of the Global Allocation Investment Team
 Russell Brownback, Managing Director, is Head of Global Macro positioning for Fixed Income
 Trevor Slaven, Managing Director, is a portfolio manager on BlackRock’s Global Fixed Income team and is also the Head of Macro Research for Fundamental Fixed Income
 Navin Saigal, Director, is a portfolio manager and research analyst in the Office of the CIO of Global Fixed Income, and he serves as Chief Macro Content OfficerCopyright © Blackrock