by Rick Rieder, Managing Director, Chief Investment Officer, Global Fixed Income, Blackrock
Sports fans and travel junkies will recognize the “shoulder season” as the period between peak and trough seasons in their respective fields. Indeed, the U.S. economy is going through its own version of a shoulder season as it tangibly slows down after the post-Covid peak. The next few months will bring with them a lot of visibility on just how much the economy will slow, the outcomes of several milestone monetary policy decisions and an update on corporate health (July’s earnings reports should be instructive), each of which holds the potential to keep markets in a turbulent state. After all, doctors and physiologists understand the shoulder to be “extremely unstable, far more prone to dislocation and injury than other joints.”
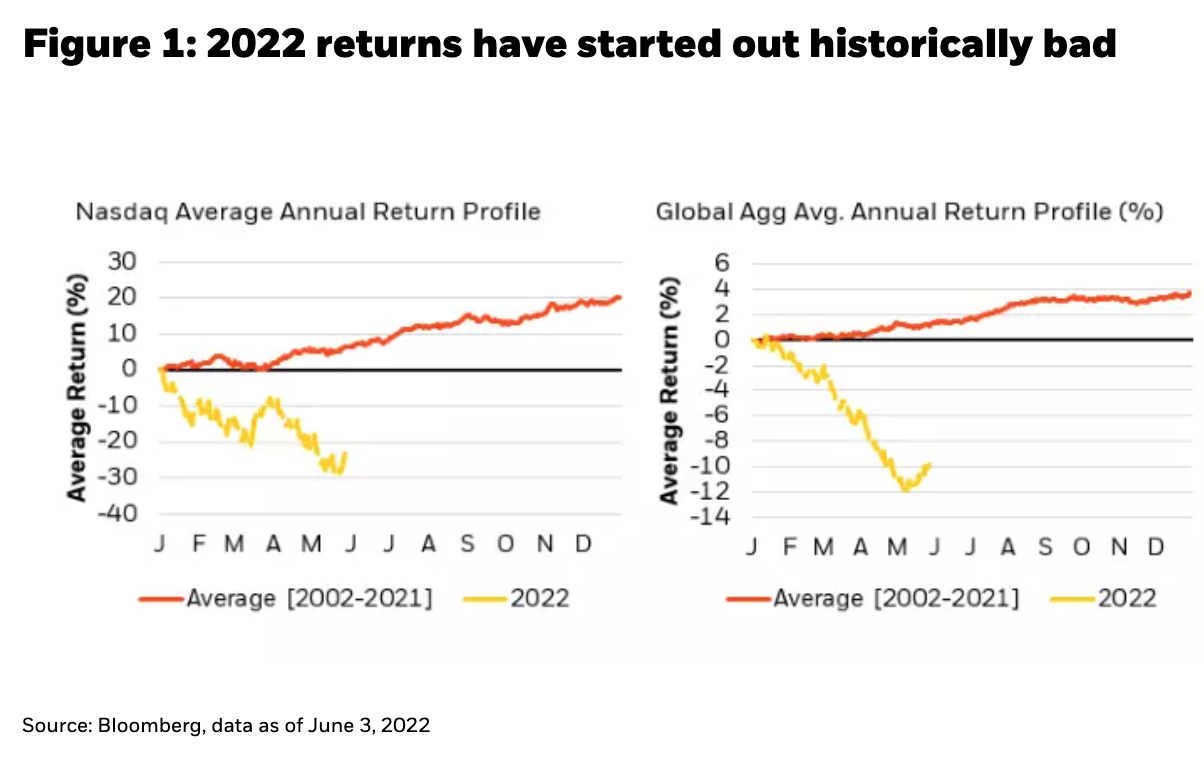
Still, it’s also possible that the slowing of the economy could mark the bottoming in financial markets, and a transitional period toward ultimately better returns. Seasonally, May and June are the second worst two months of the year, while July has been one of the best months to be invested in a balanced portfolio (based on return data for the S&P 500 and Bloomberg U.S. Aggregate Bond Index, dating back to 2010). And after a year of terrible returns, some of which have been in anticipation of this economic shoulder season, market participants are pining for a turn (see Figure 1).
The rhythm of the markets has gradually, but permanently, changed over the last 40 years. Policy has superseded the economy to become such a dominant driver of markets today. In fact, this is so much the case that the mere thought of tightening policy in 2022 has led to cross-market chaos so far this year. Given that financial asset valuations are underpinned by the risk-free rate, when there is uncertainty around the path of the policy rate, it is very difficult to price virtually all financial assets. And policymakers’ increasing use of the liquidity tool to manage real economy volatility has arguably increased market volatility. As a case in point: prior to 2008, the U.S. monetary base was never more volatile than the 60/40 portfolio, but astoundingly since then the 60/40 portfolio has never been more volatile than the monetary base (see Figure 2).
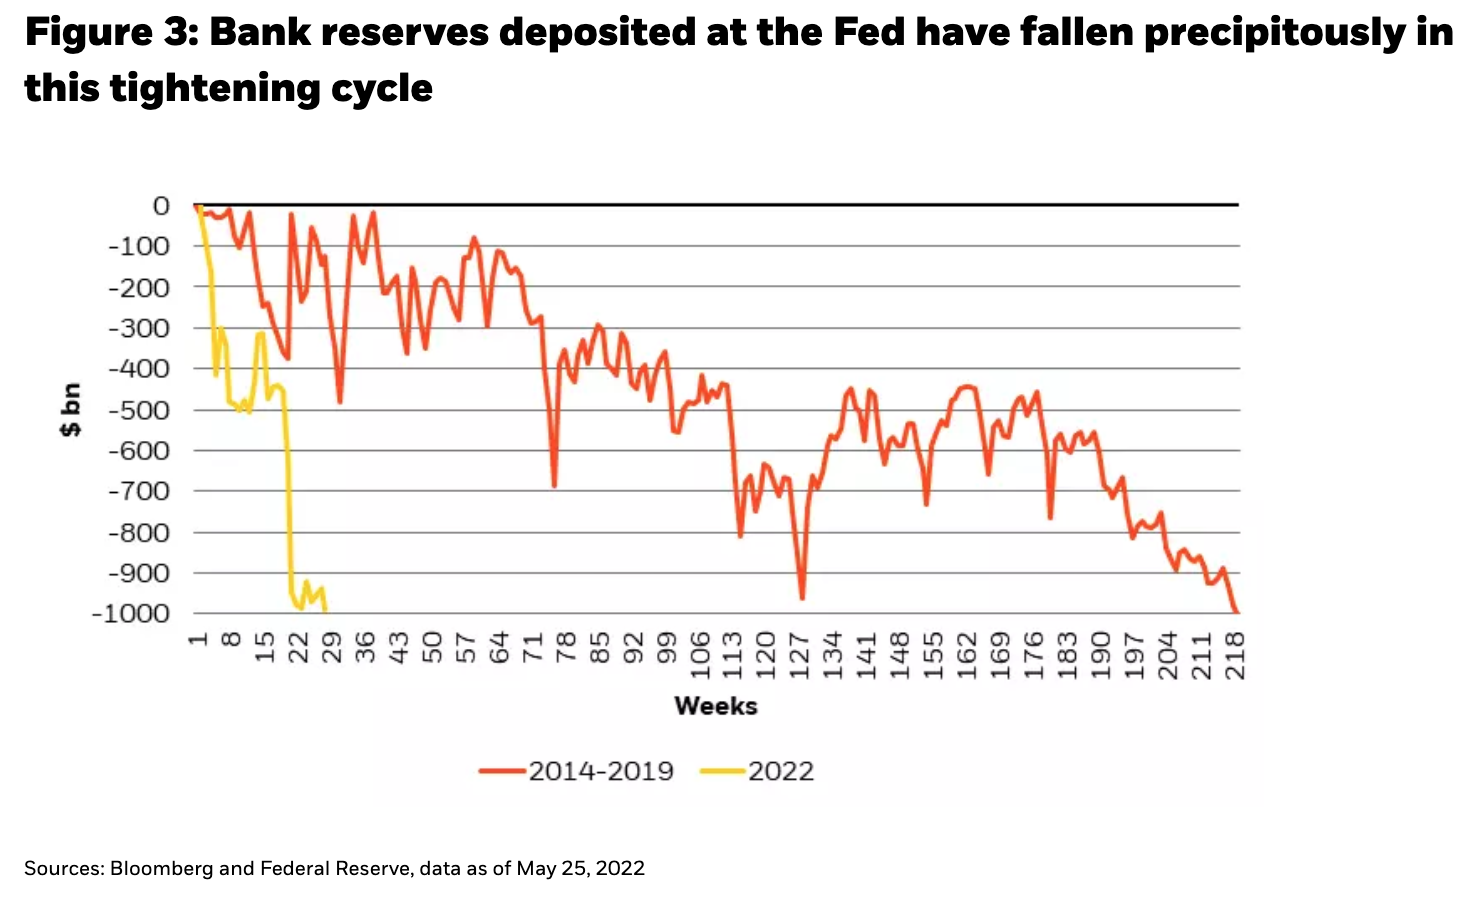
When policy volatility is greater than the rate of return in the economy, or in the capital markets, it becomes the dominant influence on financial assets. A less volatile policy path going forward (particularly for liquidity) will allow the economy and financial markets to calm down eventually too. Thus far, it’s been more the opposite: bank reserves deposited at the Fed have fallen nearly $1 trillion in just 21 weeks, or about 5x faster than during the previous cycle, which raises the risk that a liquidity withdrawal in the financial economy can become a painful slowdown in the real economy, if corporations and consumers were to hoard cash (see Figure 3).
Why is policy tightening so quickly?
Inflation is much further from target than normal, meaning policy has had to be more aggressive than normal in its response. The Fed’s “preferred” inflation metric of core inflation (core PCE) should gradually turn down, but headline inflation (CPI) may be propped up for an uncomfortably long time by upward pressure on commodity prices. CPI’s weights – higher for housing, lower for health care – more closely track the out-of-pocket cash flows of middle-class households. The challenge over the next few months is evaluating this evolution in prices, the concurrent growth conditions and employment trends and how monetary policy reacts to these cues.
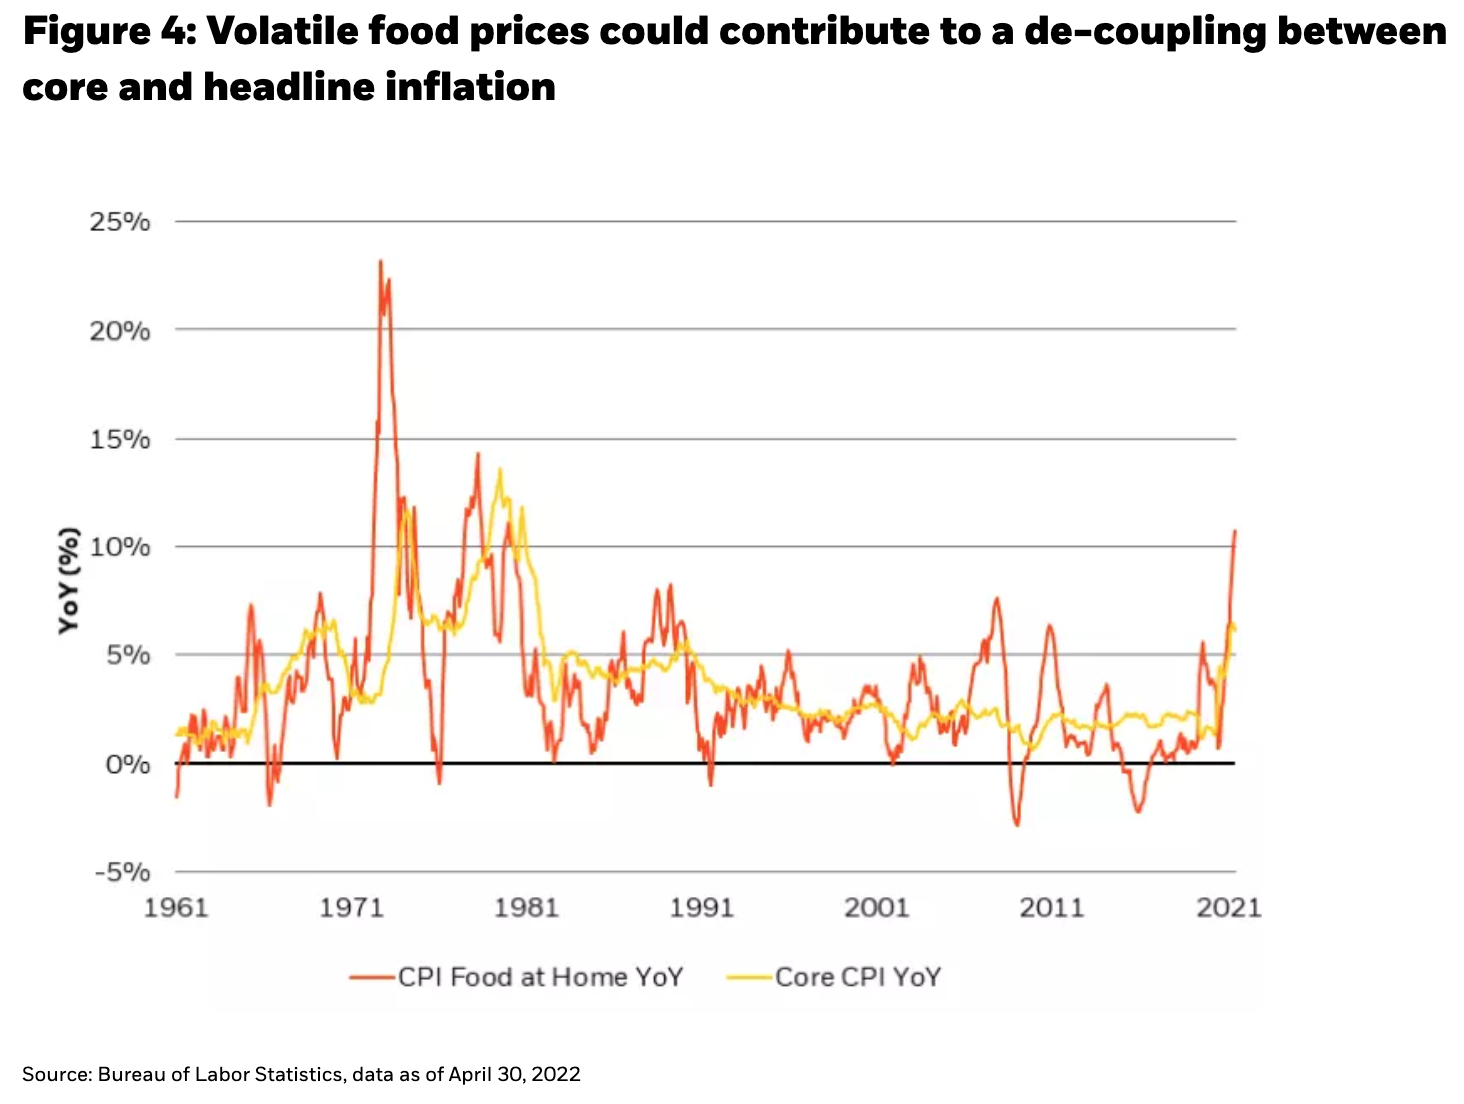
A brief look at the commodity landscape can perhaps be helpful in assessing the appropriate policy response to inflation. Generally speaking, energy prices continue to rise, shocked by supply disruptions stemming from Russia’s invasion of Ukraine, and food prices remain stubbornly high. Interestingly, the industrial metals prices have plateaued, or even rolled over, with many year-over-year rates of change now sharply negative, depending on the period under consideration. That dynamic could well be a function of China’s Covid lockdowns, or signs of a normalization in U.S. goods-sector consumption, or both. It seems fairly clear to us that if inflation doesn’t broadly cool off in the next several months, it will be due to higher than anticipated food and energy price increases (see Figure 4), so how does the Fed evolve policy around this possibility?
The fact is that the Fed has very little ability to control food prices, which today are a function of supply/demand mismatches from late-2020 to early-2021, higher energy and wage costs, and notably the on-going crisis in the Ukraine, a major agricultural commodity production region of the world. Likewise, with energy, demand declines can cause reduced oil consumption, but oil prices don’t often follow demand. In fact, historical data suggests that oil prices are driven mostly by supply factors, and with the loss of Russian oil from the market, a major source of supply is gone. Furthermore, the longer-standing transition toward clean energy sources, and away from traditional energy (and thus investment in this area) have created something of a perfect storm, when looked at alongside the geopolitical dynamics.
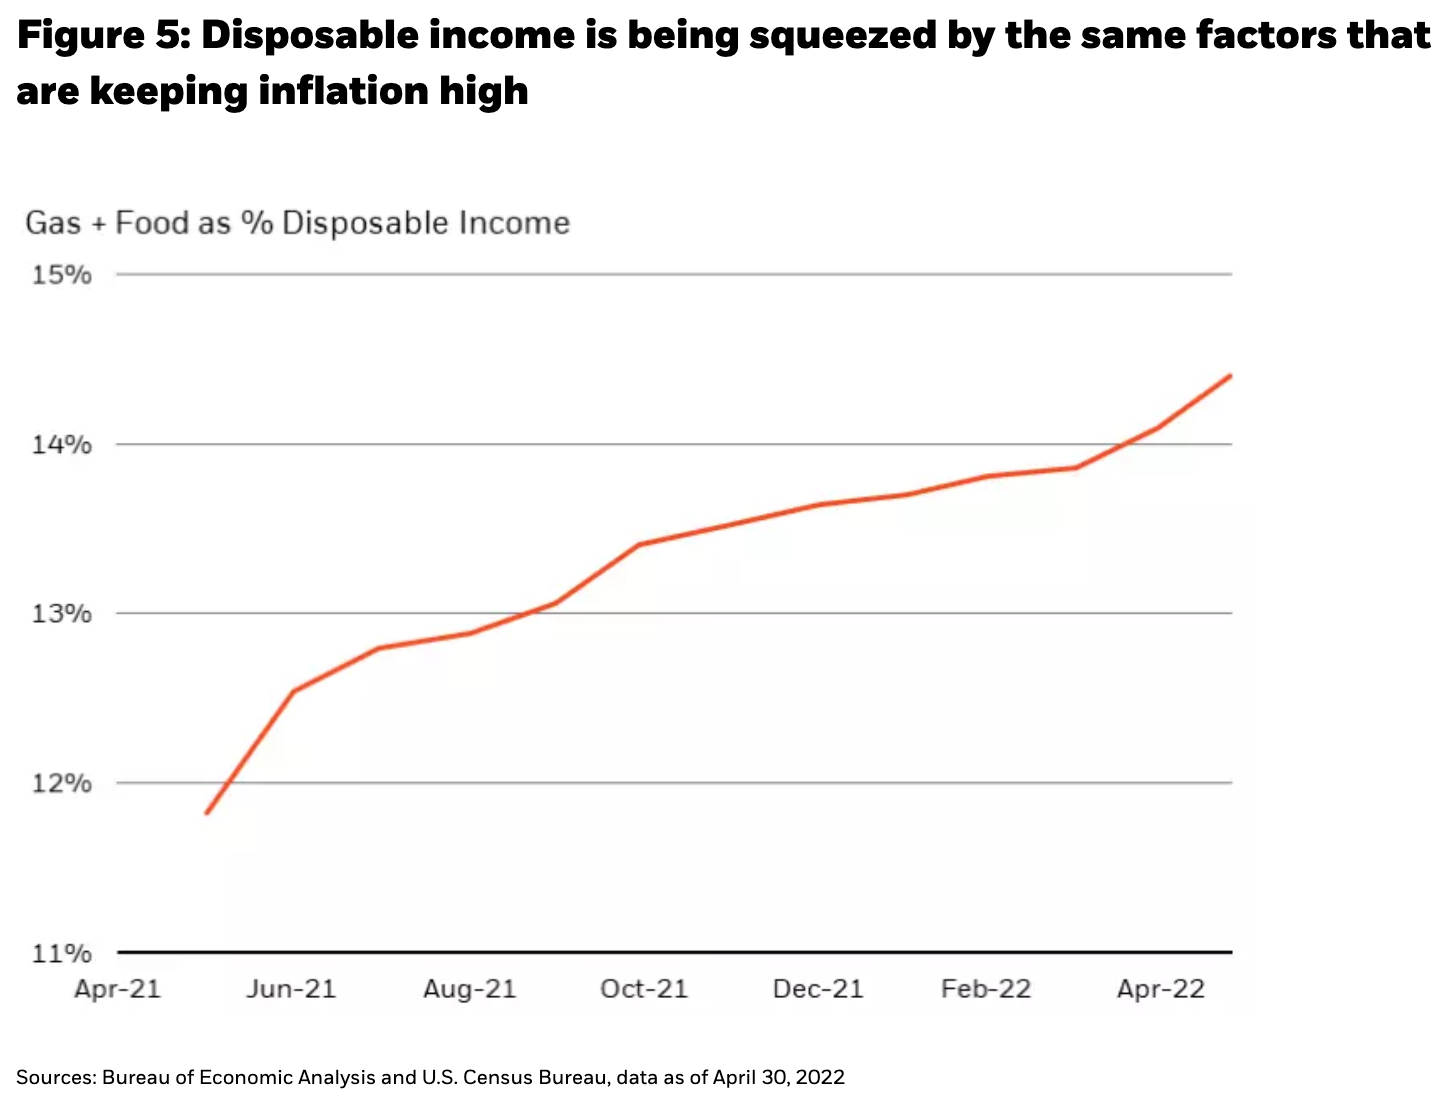
Therefore, the major risk to consumption, employment, and the economy overall, isn’t an organic growth slowdown, but the extent to which extreme energy and food price increases could cause central banks to push (ineffectually) against the string, and essentially fall into a damaging policy mistake. The feed through from higher gas and food prices to consumption is a critical input in the evolution of growth and employment data from here - factors for the Fed to consider, even amidst growing rhetoric that the Fed has to be as aggressive as Paul Volcker was in the 1970s-80s to deal with high levels of inflation today (see Figure 5).
But was monetary policy singlehandedly responsible for “curing” inflation after Volcker took office? While Paul Volcker was an extraordinary central banker, an examination of oil’s contribution to inflation in the pre-Volcker era, and to disinflation during and after the Volcker era, suggests that he was also the beneficiary of good luck. Oil prices had increased 1800% from 1970 to 1980 on the back of 2 wars in the eastern hemisphere, worsened by Nixon’s ineffective policies around attempted price controls. Yet, after Volcker took office, oil began a 20-year run of outright deflation - a fortunate turn of events for someone trying to fight inflation.
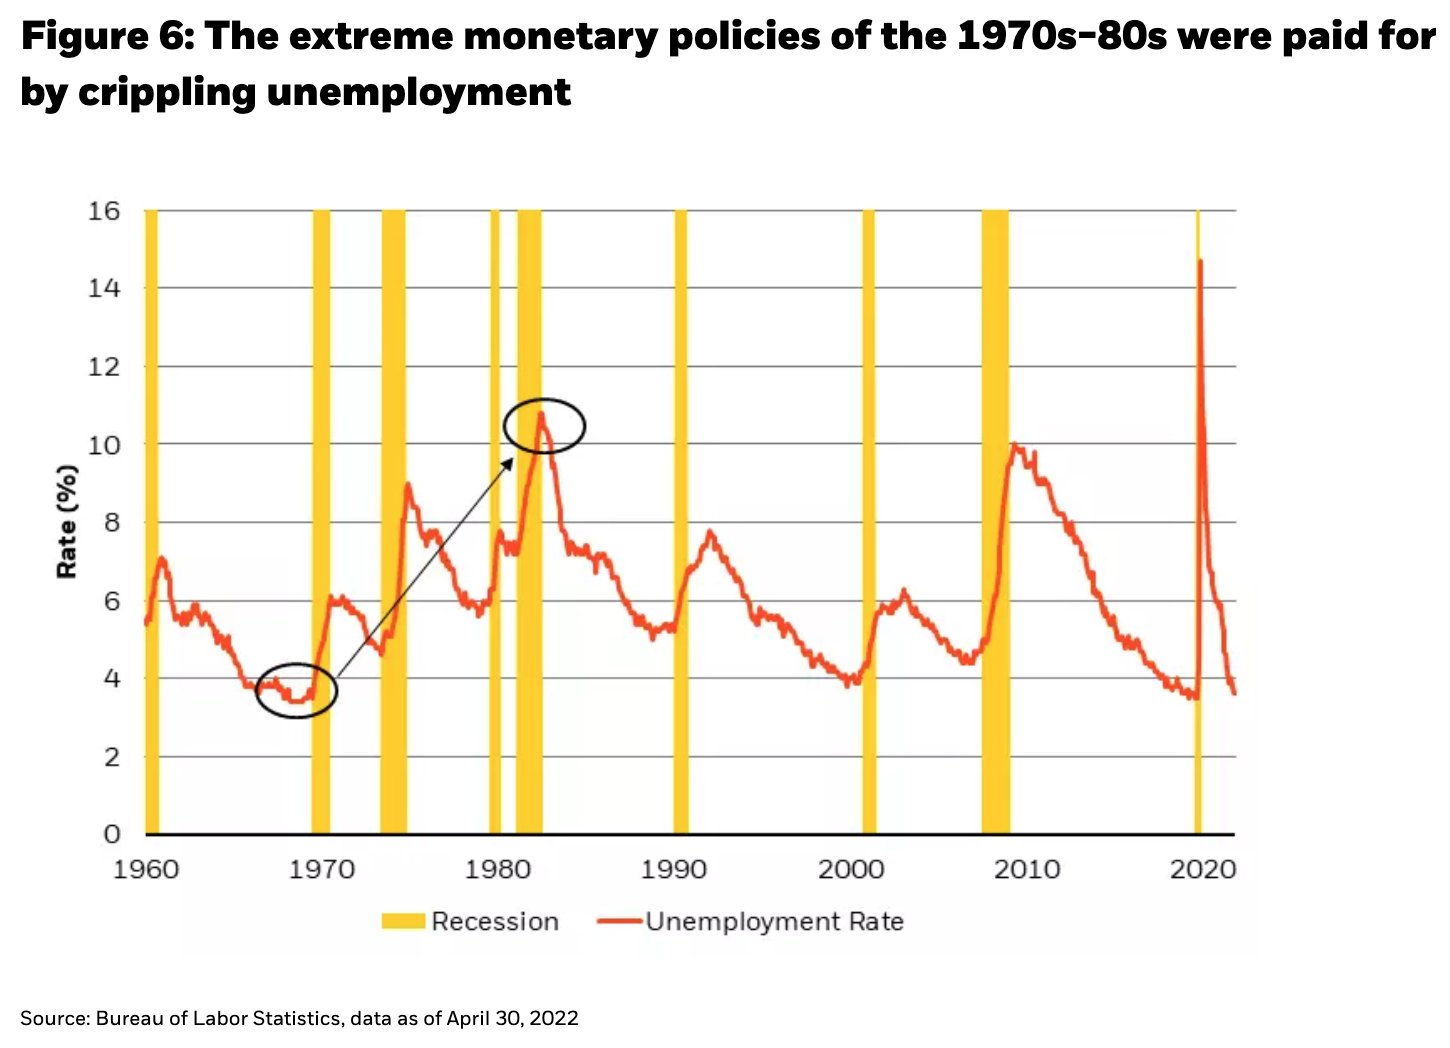
Volcker’s policies also came at a cost: they engineered two recessions in three years, and a 5.1% (pp) gain in unemployment, to a whopping 10.8%, worse than the Global Financial Crisis and any other recession going back to the Great Depression (see Figure 6). Inevitably, this helped lower oil demand temporarily, as did the 1800% increase in prices, but as mentioned oil prices are more driven by supply than demand – the end of price controls and a 50% increase in non-OPEC production did more to facilitate the structural oil price decline in the years after Volcker took office.
The good news is that there are some pockets of relief on the horizon today that may preclude the extreme policies (and recessionary outcomes) of the 1980s. Early signs of goods prices coming off the boil suggest that spending is getting pulled back. At the individual company level, inventories at large retailers like Target and Walmart, and smaller retailers like Abercrombie, have been built up to record levels in anticipation of a more durable continuation of the pandemic-era surge in goods demand.
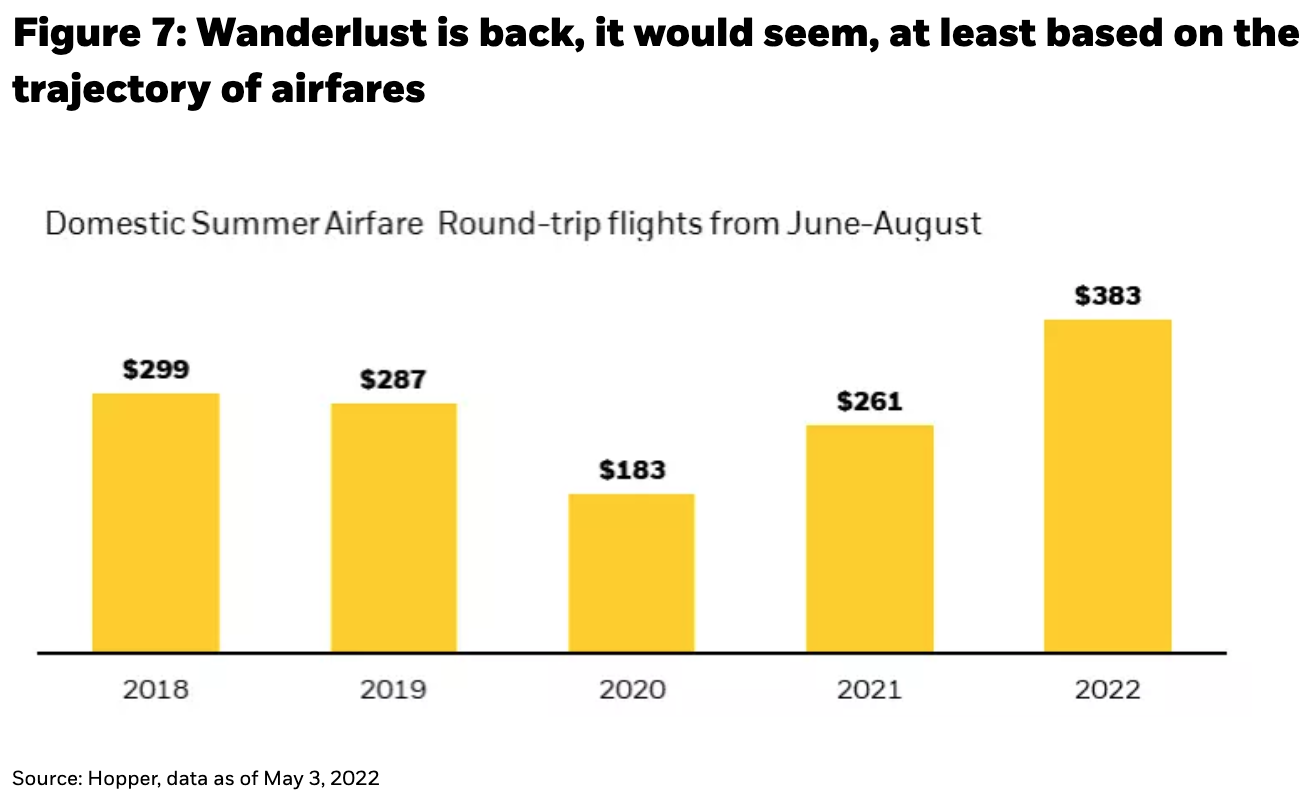
However, goods demand has given way to services demand: we believe the goods and services economies are both in shoulder seasons, but the opposite shoulder. Goods consumption is descending toward its pre-Covid trend, while services consumption is rising back to its pre-Covid trend (see Figure 7). There is a pent-up demand to emerge from one’s house and return to normal life (and see what one missed the last two years). Some services prices are being held up by aforementioned shortages in commodities (such as jet fuel impacting airfares), which creates a very narrow tightrope for the Fed to navigate, since it might require an uncomfortable degree of demand destruction to counter these kinds of commodity-related inflationary pressures that manifest themselves in services prices.
Despite the (relatively) positive trend in reopening sectors of the economy, the labor market is showing signs of slowing. A high payroll print last month (390k), quite possibly the last strong payroll print for some time, belies the trend of a clear employment slowdown (including within that payroll print). A consistent (and marked) decline in regional employment surveys, a plateauing in job postings (see Figure 8) on both sides of the Atlantic, and wage growth that has slowed back to pre-pandemic rates are all signs that policy tightening (amidst other shortages) is already having its intended effect and does not need to reach Volcker-esque levels of tightness.
So, we have described how the economy should slow through this shoulder season - yet it should ultimately be supported by strong enough foundational influences to prevent a recession in 2022. Capital spending is still near its peak, household and corporate balance sheets are pristine, household excess savings still stand at a whopping $2.4 trillion and the tightness in the labor market should provide structural support for consumption, even if it is slowing. Simply put, starting levels in the economy are so strong that they can absorb a large amount of tightening, and slow down substantially without stalling (avoiding a stall being key).
One way to avoid over-utilizing monetary policy aimed at dramatically curtailing demand, investment, and employment might be to replace it with targeted fiscal initiatives aimed at efficient (cleaner) energy development, refining and distribution, alongside of precision-agricultural incentives, and multi-family housing development incentives (to bring down energy, food and rental costs, respectively). Still, we fully recognize that dreaming about the good is less relevant than investing relative to reality and the more critical concern is how the markets handle the slowing economy, amidst tightening financial conditions.
The potential for dramatically higher energy prices, higher borrowing costs that risk pushing the weighted average cost of capital for companies above their return on invested capital and an uncertain outlook that curtails investment near-term are all significant risks to consider. Further, globally induced economic or geopolitical shock, or policy-induced excessive tightness in financial conditions, would also keep us firmly in shoulder season and consequently staying patient.
Given this tighter policy prescription, and the risk of overtightening, we have been big advocates of “hiding out” in the front-end of the yield curve for fixed income investments, and in owning quality assets that provide reasonable yield, spread and carry-breakevens. In fact, front-end yields have now priced a lot in relation to what the Fed will do over the next few months (50 basis point hikes for June, July and September, although the June meeting delivered a 75 bps policy rate hike), with a dwindling probability of pricing in even more hikes at FOMC meetings further out the timeline as the economy and labor market slow.
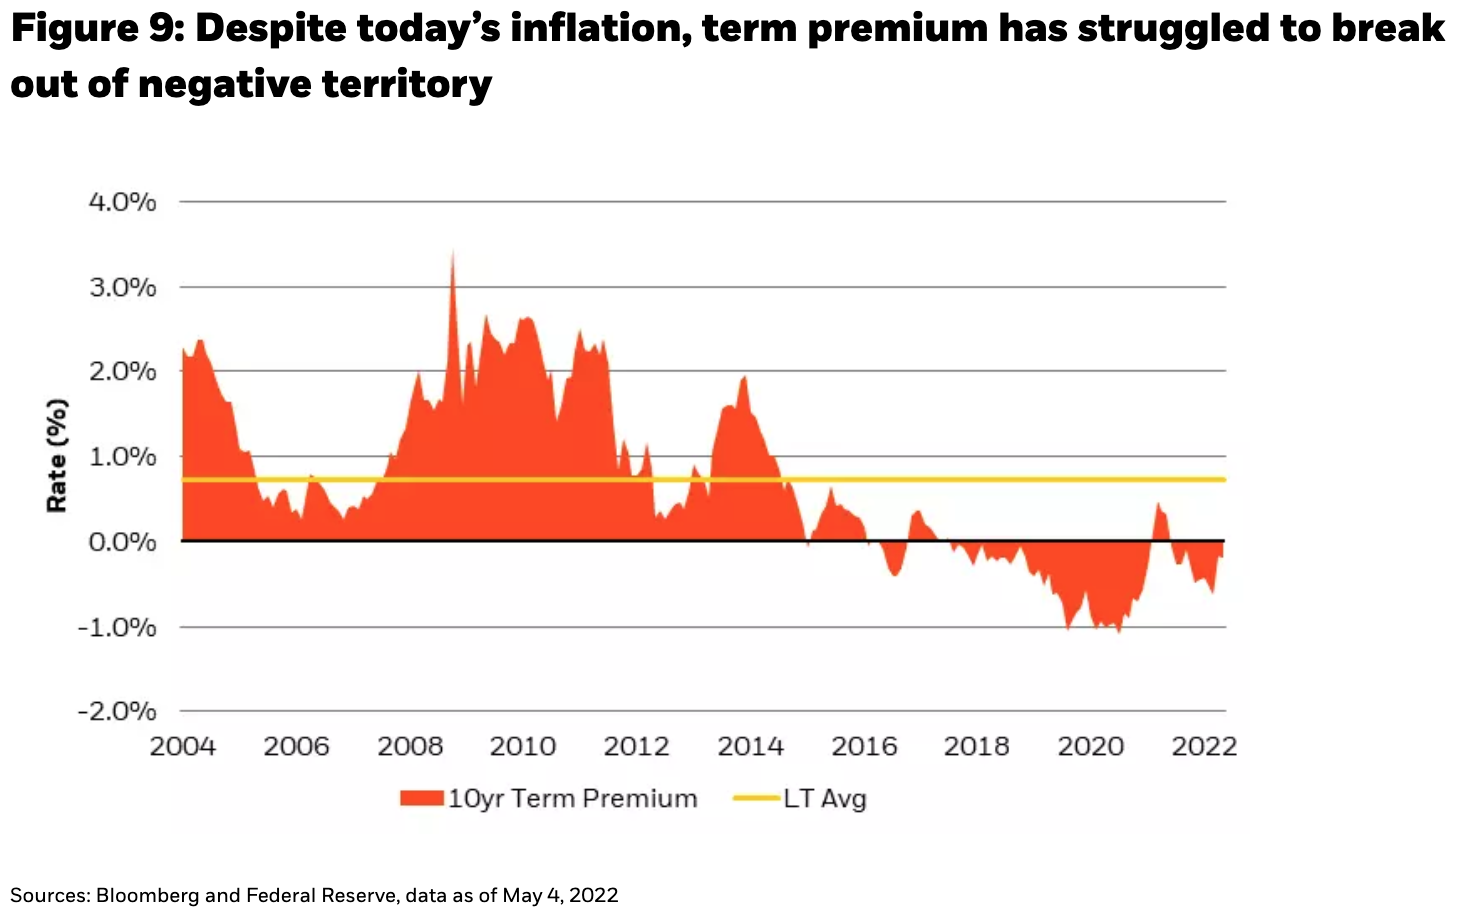
Meanwhile, term premium out the curve has been crushed through years of policy programs targeting this very factor (see Figure 9). Term premium can and should rise, alongside the more uncertain inflationary resting place we’ve described. Is this a reflection of future slowing growth and lower inflation? Probably, but from these depressed levels, term premium still has a high chance of expanding given a very different Fed balance sheet and policy paradigm today, suggesting to us that it may be too early to add long duration assets to portfolios.
We believe in owning the most “efficient” yield in portfolios today, particularly in places less correlated to a potentially expanding term premium further out the curve. Leveraged loans were something we discussed heavily at the beginning of the year, but with the repricing that has rippled through fixed income markets, high yield bonds have become significantly more attractive, albeit with a recognition that financial conditions are still tightening, something financially levered companies are more sensitive to.
Follow Rick Rieder on Twitter
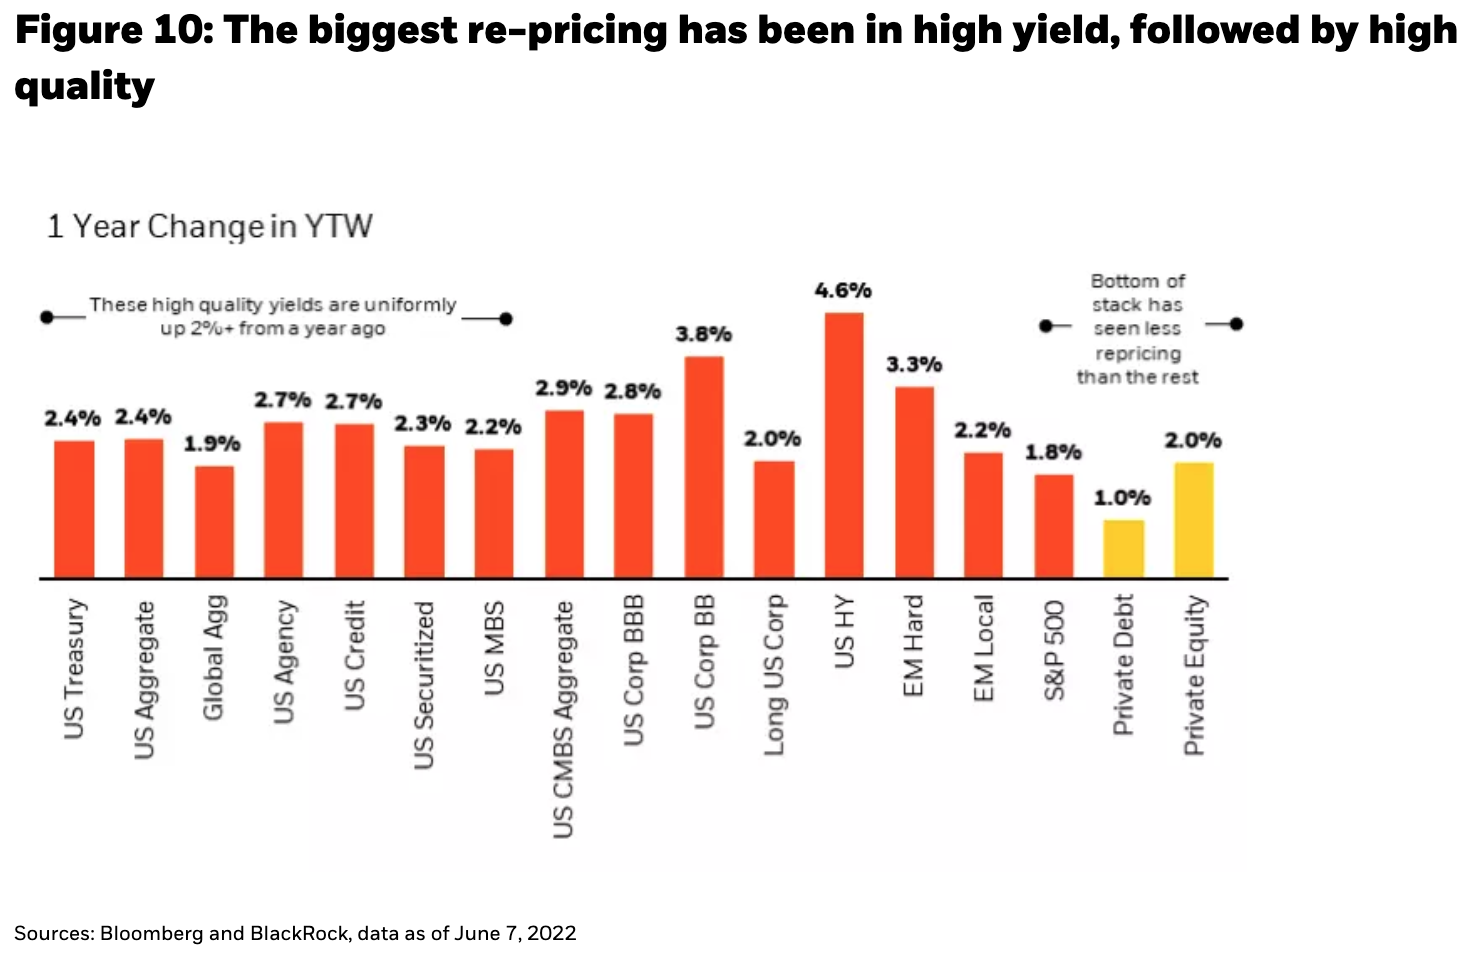
In the U.S., high yield issuer default rates are still at record lows even as bonds in aggregate head closer to 8% yields (an unimaginable yield for most market participants a year ago). In Europe, high yield spreads are discounting a worse default outcome than has been realized at any time since 2009, suggesting that investors are now “getting paid” to take some default risk. Also, the structure of the high yield bond market is incredibly different from seven or eight years ago. During the default cycle of 2014-16, the energy sector was over-levered on the back of a heavy capex cycle, dragging the high yield market down with it. Today, after having gone through a balance sheet cleansing over the last few years of depressed energy prices, energy is “under-levered” relative to cash flow, and the high yield index consequently is a healthier asset class. The correlation of high yield to the risk-free rate is also much lower than the rest of fixed income, which gives it some tangible value as a portfolio complement today, given the risk of higher term premium (see Figure 10).
So, yields on risk-free rates are stubbornly high and potentially heading higher as central banks continue this tightening cycle, while the bottom of the capital stack (equities) is still just okay at best, relative to building a higher yielding portfolio. With credit spreads having widened much more than equity risk premiums, the relative value between the two suggests that equities have not been less attractive relative to credit in almost 15 years (see Figure 11). Nonetheless, selling expensive insurance in rates and equities (the best time to sell insurance is just before a hurricane ends, as we wrote about last month in Prepping for a Financial Hurricane) can help supplement the beta in a portfolio, diversify income sources, and allow one to participate in short-covering rallies within bear markets in either risk free and risky assets alike.
So, when does shoulder season end?
There are no simple answers. For now, inflation is the “singular mandate” of major central banks, but over the next few months we would anticipate that the employment side of the Fed’s mandate will re-enter the equation as companies are increasingly freezing hiring, with a number of them executing layoffs. We will continue to keep an eye on core inflation, but consumers, and increasingly employers, are keeping their eyes on gas and food prices (nominal CPI readings) as they make commercial decisions.
In the game of Operation, the “patient” has injuries all over his body, from feet to neck, but interestingly never at the head. This year has been like a game of Operation for markets, where we started at the bottom of the body, encountering more injuries and pain than we could have imagined during the first five months of the year (many of which were related), and we are finally at the shoulder (season). Investors are best served by letting asset prices “come to them” this shoulder season, patiently adding those that reprice the most, as the economy and policy come to a head – a moment that we think will signal the all-clear for markets.
 Rick Rieder, Managing Director
Rick Rieder, Managing Director, is BlackRock’s Chief Investment Officer of Global Fixed Income and is Head of the Global Allocation Investment Team.
Copyright © Blackrock


