by Don Vialoux, EquityClock.com
The Bottom Line
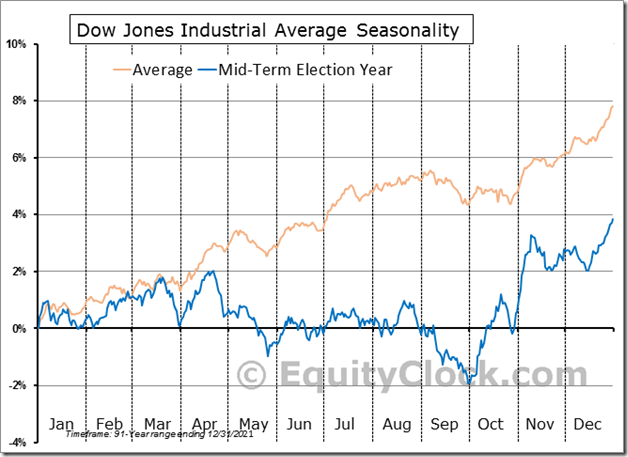
U.S. equity markets closely are following their historic trend during a U.S. mid-term Presidential Election year: From January to June during the year, investor uncertainty increases following initiation by the President of difficult federal programs (e.g. increases in taxes to pay for new programs). The President’s subsequent less favourable political ratings trigger anticipation a loss of at least some Congressional seats by the President’s party during mid-term elections held in November. This year, Democrats only have a 12 seat control over the House of Representatives and a one seat (i.e. the Vice President) control over the Senate implying that control of Congress could flip to the Republicans if recent polls are maintained at current levels.
Uncertainty has been heightened this year by the Federal Reserve’s program to tighten monetary policy. More information about the Federal Reserve’s intentions is expected to be released at 2:00 PM EDT on Wednesday when release of minutes to the last FOMC meeting are scheduled.
Observations
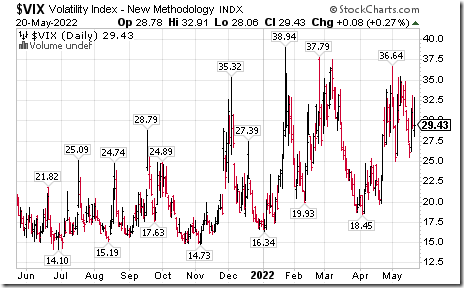
Increasing fiscal and monetary uncertainties have boosted volatility in U.S. equity markets.
Consensus earnings estimates for S&P 500 companies on a year-over-year basis in the first quarter of 2022 were unchanged last week. Ninety five percent of companies have reported quarterly results to date. According to www.FactSet.com first quarter earnings on a year-over-year basis increased 9.1% and revenues increased 13.6% (versus 13.4% last week)
Consensus earnings and revenue estimates for S&P 500 companies beyond the first quarter on a year-over-year basis moved slightly lower last week. According to www.FactSet.com second quarter earnings are expected to increase 4.1% (versus 4.4% last week) and revenues are expected to increase 9.7% (versus 9.9% last week). Earnings in the third quarter are expected to increase 10.1% (versus 10.3% last week) and revenues are expected to increase 9.2%. Earnings in the fourth quarter are expected to increase 9.8% and revenues are expected to increase 7.0% (versus 7.1% last week). Earnings on a year-over-year basis for all of 2022 are expected to increase 10.0% (versus 10.1% last week) and revenues are expected to increase 10.2%.
Recovery by U.S. equity indices during the last two hours of trading on Friday was related to expiration of May equities options, index options and futures options.
Economic News This Week
Focus this week is on FOMC Meeting Minutes to be released at 2:00 PM EDT on Wednesday.
April New Home Sales to be released at 10:00 AM EDT on Tuesday are expected to slip to 748,000 units from 763,000 units in March.
April Durable Goods Orders to be released at 8:30 AM EDT on Wednesday are expected to increase 0.6% versus a gain of 0.8% in March. Excluding Transportation Orders, April Durable Goods Orders are expected to increase 0.6% versus a gain of 1.2% in March.
FOMC Meeting Minutes for the last meeting are released at 2:00 PM EDT on Wednesday.
Next First quarter annualized real GDP estimate to be released at 8:30 AM EDT on Thursday is expected to be -1.3% from the previous estimate at -1.4%
March Canadian Retail Sales to be released at 8:30 AM EDT on Thursday are expected to increase 1.4% versus a gain of 0.1% in February.
April Personal Income to be released at 8:30 AM EDT on Friday is expected to increase 0.6% versus a gain of 0.5% in March. April Personal Spending is expected to increase 0.7% versus a gain of1.1% in March.
May Michigan Consumer Sentiment to be released at 10:00 AM EDT on Friday is expected to remain at 59.1 set in April.
Selected Earnings News This Week
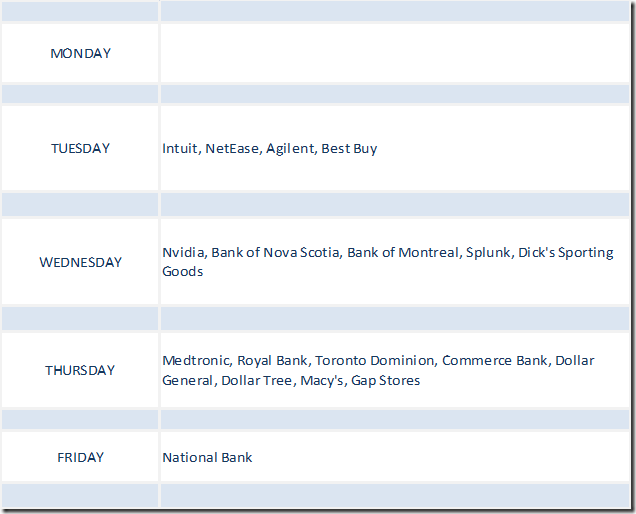
Thirteen S&P 500 companies are scheduled to report quarterly results this week. In Canada, focus is on fiscal second quarter reports to be released by Canada’s banks
Trader’s Corner
Equity Indices and Related ETFs
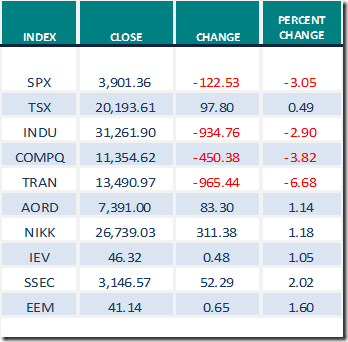
Daily Seasonal/Technical Equity Trends for May 20th 2022
Green: Increase from previous day
Red: Decrease from previous day
Commodities
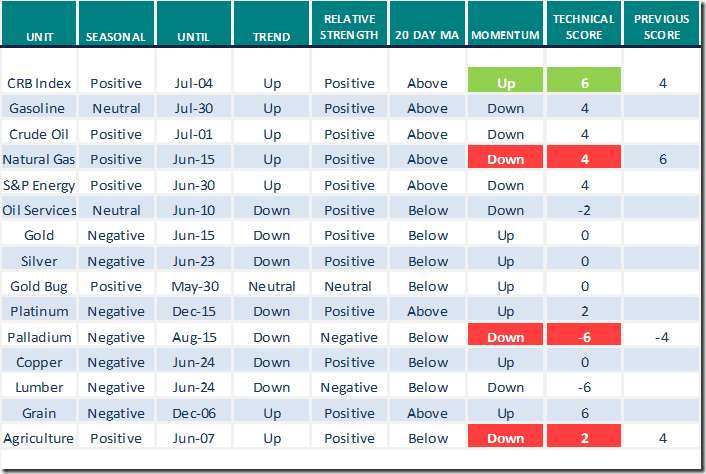
Daily Seasonal/Technical Commodities Trends for May 20th 2022
Green: Increase from previous day
Red: Decrease from previous day
Sectors
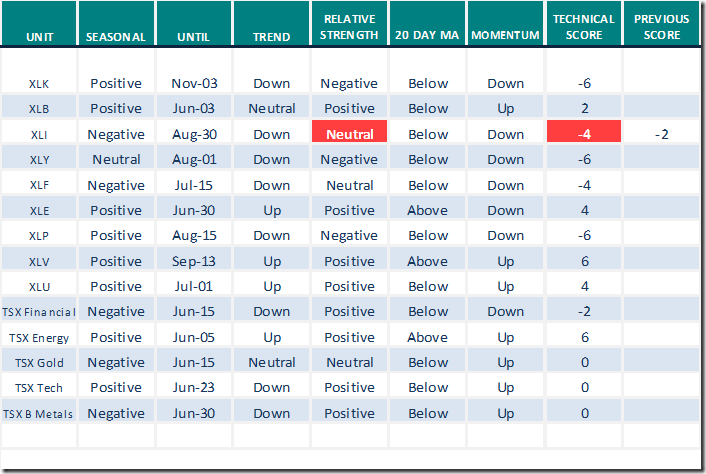
Daily Seasonal/Technical Sector Trends for May 20th 2021
Green: Increase from previous day
Red: Decrease from previous day
All seasonality ratings are based on performance relative to the S&P 500 Index (except TSX)
Links offered by Valued Providers
Mark Leibovit’s Weekly Comment
US Dollar, Gold, Bitcoin – HoweStreet
The case for S&P 2850: An interview of Louis Llanes by David Keller
https://www.youtube.com/watch?v=_uFAXEQ1AWs
TG Walkins says “Yep, it’s a bear market”
https://www.youtube.com/watch?v=aMnQmB2MumY
Michael Campbell’s Money Talks for May 21st
May 21st Episode (mikesmoneytalks.ca)
Mary Ellen McGonagle asks “What bear market? These stocks have great looking charts with very sound reasons”
Tom Bowley says “Brutal summer ahead will favor Health Care”
The Brutal Summer Ahead Will Favor Health Care | ChartWatchers | StockCharts.com
David Keller offers “How to smile in a bear market”
How to Smile During a Bear Market | The Mindful Investor | StockCharts.com
Links from Mark Bunting and www.uncommonsenseinvestor.com
"Risk is Not Volatility. If You’re Not a Seller, Don’t Worry About It." – Uncommon Sense Investor
Five Best Stocks for a Bear Market – Uncommon Sense Investor
Victor Adair’s Trading Desk Notes for May 21st
https://www.howestreet.com/2022/05/trading-desk-notes-for-may-21-2022/
Technical Scoop for May 23rd by David Chapman and www.EnrichedInvesting.com
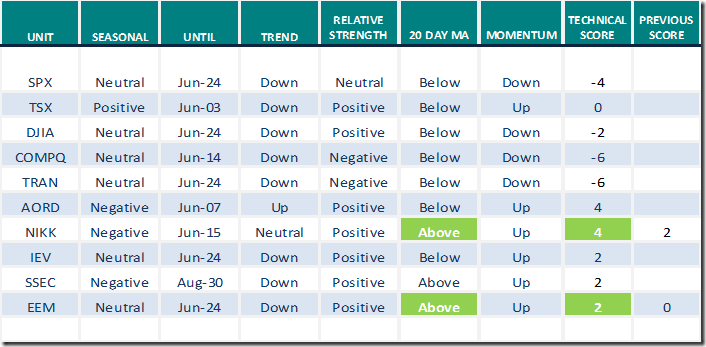
Technical Scores
Calculated as follows:
Intermediate Uptrend based on at least 20 trading days: Score 2
(Higher highs and higher lows)
Intermediate Neutral trend: Score 0
(Not up or down)
Intermediate Downtrend: Score -2
(Lower highs and lower lows)
Outperformance relative to the S&P 500 Index: Score: 2
Neutral Performance relative to the S&P 500 Index: 0
Underperformance relative to the S&P 500 Index: Score –2
Above 20 day moving average: Score 1
At 20 day moving average: Score: 0
Below 20 day moving average: –1
Up trending momentum indicators (Daily Stochastics, RSI and MACD): 1
Mixed momentum indicators: 0
Down trending momentum indicators: –1
Technical scores range from -6 to +6. Technical buy signals based on the above guidelines start when a security advances to at least 0.0, but preferably 2.0 or higher. Technical sell/short signals start when a security descends to 0, but preferably -2.0 or lower.
Long positions require maintaining a technical score of -2.0 or higher. Conversely, a short position requires maintaining a technical score of +2.0 or lower
Changes Last Week
Technical Notes for Friday
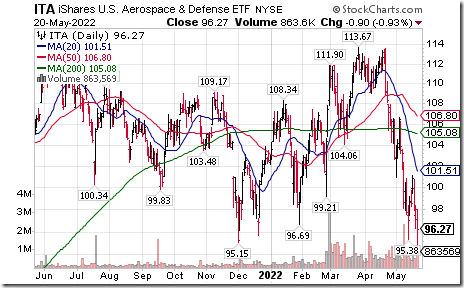
Aerospace & Defense ETF $ITA moved below $95.15 extending an intermediate downtrend.
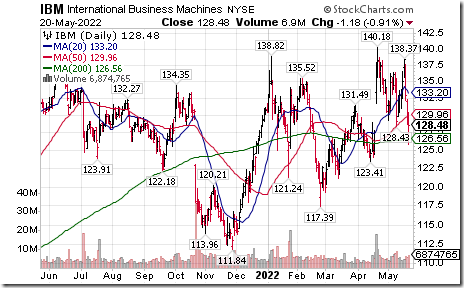
IBM $IBM an S&P 100 stock moved below $128.43 setting an intermediate downtrend.
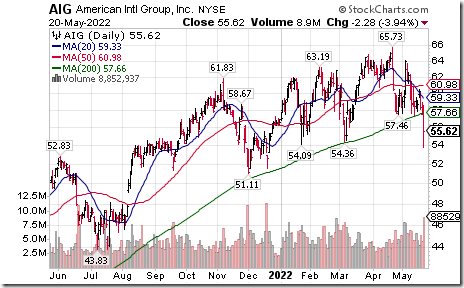
American International Group $AIG an S&P 100 stock moved below $57.46 completing a double top pattern.
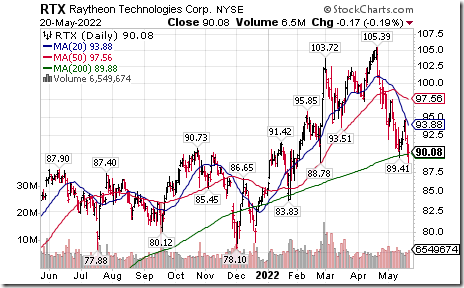
Raytheon Technologies $RTX an S&P 100 stock moved below $89.41 and $88.78 extending an intermediate downtrend.
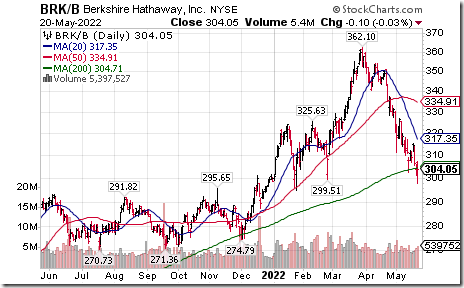
Berkshire Hathaway $BRK.B an S&P 100 stock moved below $299.51 extending an intermediate downtrend.
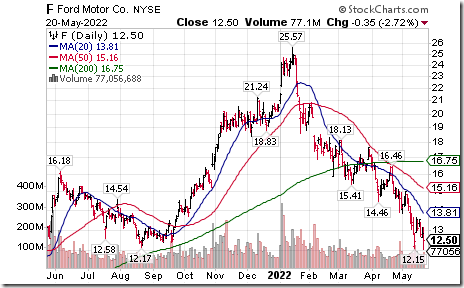
Ford $F an S&P 100 stock moved below $12.17 extending an intermediate downtrend.
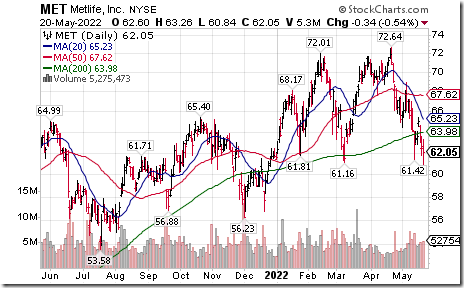
Met Life $MET an S&P 100 stock moved below $61.16 extending an intermediate downtrend.
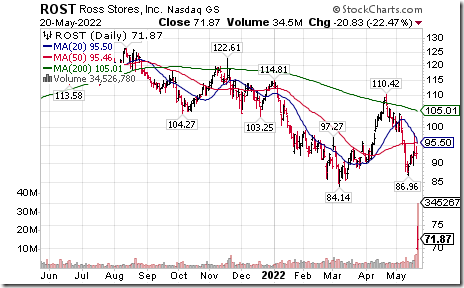
Ross Stores $ROST a NASDAQ 100 stock moved below $$84.14 and $86.96 after reporting lower than consensus first quarter results extending an intermediate downtrend.
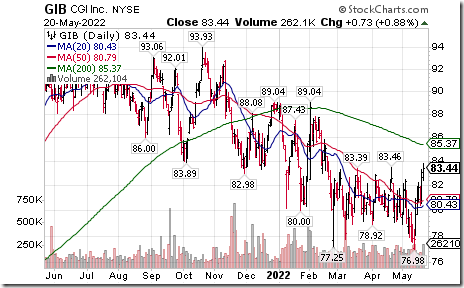
CGI Group $GIB a TSX 60 stock moved above US$83.46 completing a double bottom pattern.
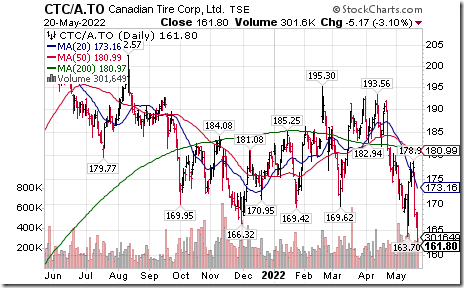
Canadian Tire $CTC.A a TSX 60 stock moved below $163.70 extending an intermediate downtrend.
S&P 500 Momentum Barometers
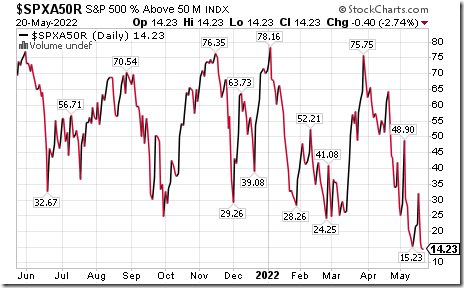
The intermediate term Barometer eased 0.40 on Friday and dropped 7.41 last week to 14.23. It remains Oversold. Trend remains down. Signs of a short term bottom have yet to arrive.
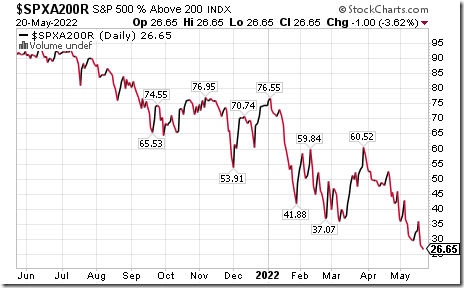
The long term Barometer slipped 1.00 on Friday and dropped 5.81 last week to 26.65. It remains Oversold. Trend remains down. Signs of a short term bottom have yet to arrive.
TSX Momentum Barometers
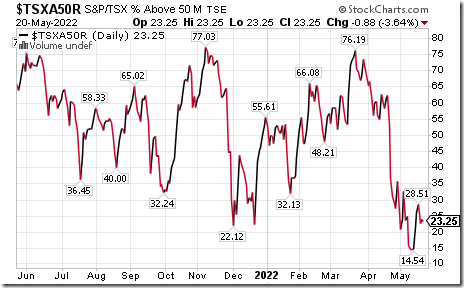
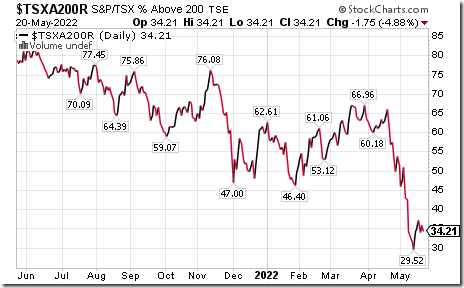
Intermediate term Barometer slipped 0.88 on Friday, but added 1.67 last week to 23.25. It remains Oversold. Early signs of a bottom have appeared.
The long term Barometer dropped 1.75 on Friday and slipped 0.03 last week. It remains Oversold. Early signs of a bottom have appeared.
Disclaimer: Seasonality and technical ratings offered in this report and at
www.equityclock.com are for information only. They should not be considered as advice to purchase or to sell mentioned securities. Data offered in this report is believed to be accurate, but is not guaranteed.
This post was originally publised at Vialoux's Tech Talk.


