by Liz Ann Sonders, Chief Investment Strategist, Charles Schwab & Company Ltd.
Bearish sentiment is becoming a contrarian support; but for now, aggressive Fed action, tightening financial conditions, and the liquidity drain may keep downward pressure on stocks.
As shown in our crowd-favorite drawdowns table below, both the Nasdaq and Russell 2000 (small caps) are in bear market territory (at least -20% on a closing basis), with the S&P 500 so far avoiding the same fate at the index level. Relative to either this year's high (second column) or the 52-week high (sixth column), the S&P 500 is down less than 20%. But the details in the table are more telling, with the S&P 500's average member maximum drawdown now at -24% from the members' year-to-date highs (fourth column) and -28% from the members' 52-week highs (seventh column).

Source: Charles Schwab, Bloomberg, as of 5/13/2022.
Indexes are unmanaged, do not incur management fees, costs and expenses and cannot be invested in directly. Past performance is no guarantee of future results. Some members excluded from year-to-date return columns given additions to indices were after January 2022.
Money supply's round-trip

Source: Charles Schwab, Bloomberg, Federal Reserve Bank of St. Louis, as of 3/31/2022.
M2 is a measure of the U.S. money stock that includes M1 (currency and coins held by the non-bank public, checkable deposits, and travelers' checks) plus savings deposits (including money market deposit accounts), small time deposits under $100,000, and shares in retail money market mutual funds.
Not much has been spared
In addition to the liquidity drain underway, there has also been the popping of what might be described as the stay-at-home (SAH) bubble. Piper Sandler Cornerstone tracks an SAH basket of stocks (Peloton, Meta/Facebook, Shopify, Under Amour, Wayfair, Tupperware, Amazon, Sleep Number, Tempur+Sealy, Restoration Hardware, Netflix, Carvana, and Carmax), which is down more than 54% from its peak about six months ago.
Rampant speculation-driven segments of the market have gotten hit particularly hard. The chart below shows drawdowns for several key spec areas, with recent peak-to-trough declines all worse than -40%. The rout in the crypto space has garnered much media attention, with a less-publicized, but probably important driver of equity market contagion being crypto-related margin calls.
Spec areas' epic drawdowns

Source: Charles Schwab, Bloomberg, as of 5/13/2022.
Goldman Sachs (GS) non-profitable technology basket consists of non-profitable U.S.-listed companies in innovative industries. Technology is defined quite broadly to include new economy companies across GICS industry groupings. Goldman Sachs (GS) retail favorites basket consists of U.S. listed equities that are popularly traded on retail brokerage platforms. Goldman Sachs (GS) most-shorted basket contains the 50 highest short interest names in the Russell 3000; names have a market cap greater than $1 billion. ISPAC Index is a passive rules-based index that tracks the performance of the newly listed Special Purpose Acquisitions Corporations (“SPACs”) ex- warrant and initial public offerings derived from SPACs since August 1, 2017. The Meme Index is constructed by Bloomberg and contains 37 stocks that are considered actively traded and/or discussed among day-traders, retail investors, and chatrooms. Individual stocks shown for informational purposes only. Indexes are unmanaged, do not incur management fees, costs and expenses and cannot be invested in directly. Past performance does not guarantee future results.
In terms of history, there have been a dozen recessions since WWII, with a median peak-to-trough S&P 500 decline of 24%, and an average decline of 30%.
Silver lining in form of sentiment?
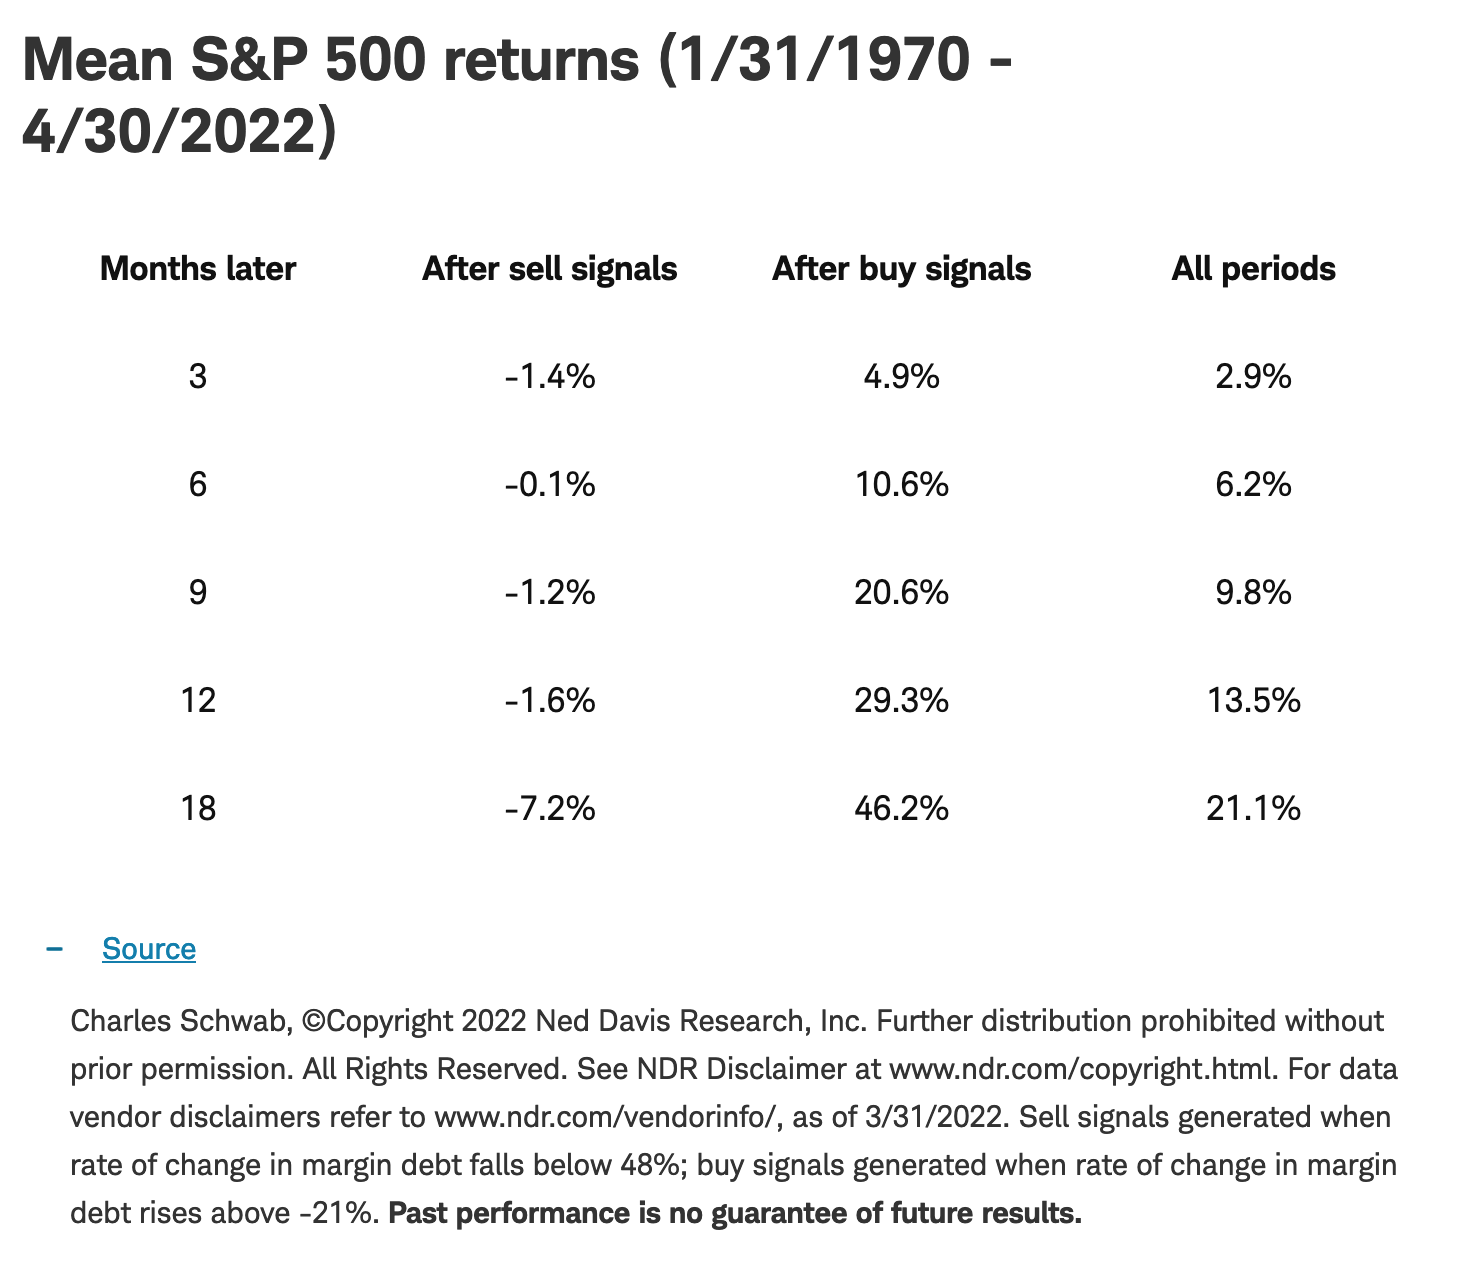
Mentioned above was equity market contagion associated with margin calls. Shown below is a margin debt chart with data from our friends at Ned Davis Research (NDR). Buy signals per this data are triggered when the rate-of-change rises above -21%; sell signals are triggered when the rate-of-change falls below +48% (orange dotted lines).
As shown, this indicator remains on a sell signal, with more of a retreat in margin debt rate-of-change needed to get to a zone that might bring on a buy signal. As shown in the accompanying table, although the S&P 500 performance following prior sell signals was fairly weak three-to-18 months later, the declines were not extreme. Conversely, the gains following buy signals were quite strong.
Margin debt off boil

Source: Charles Schwab, ©Copyright 2022 Ned Davis Research, Inc.
Further distribution prohibited without prior permission. All Rights Reserved. See NDR Disclaimer at www.ndr.com/copyright.html. For data vendor disclaimers refer to www.ndr.com/vendorinfo/, as of 3/31/2022. Sell signals generated when rate of change in margin debt falls below 48%; buy signals generated when rate of change in margin debt rises above -21%. Past performance is no guarantee of future results.
Mean S&P 500 returns (1/31/1970 - 4/30/2022)
Another behavioral sentiment indicator not yet hitting the kind of extremes that have worked well as contrarian indicators is the equity-only put/call ratio. As shown in the chart below, the ratio plunged to historic lows in the aftermath of the COVID-19 bear market in 2020, but the rebound higher has not (yet) brought to an extreme. A sharper shift away from call buying to put buying may still be needed for a sustainable market bottom to form.
Put/call not yet at extreme

Source: Charles Schwab, Bloomberg, as of 5/13/2022.
Fund flows reverse
 Past performance is no guarantee of future results.
Smart Money more bullish

Source: Charles Schwab, SentimenTrader, as of 5/13/2022.
SentimenTrader's Smart Money Confidence and Dumb Money Confidence Indexes are used to see what the “good” market timers are doing with their money compared to what the “bad” market timers are doing and are presented on a scale of 0% to 100%. When the Smart Money Confidence Index is at 100%, it means that those most correct on market direction are 100% confident of a rising market. When it is at 0%, it means good market timers are 0% confident in a rally. The Dumb Money Confidence Index works in the opposite manner.
Crowd feeling/acting bearish

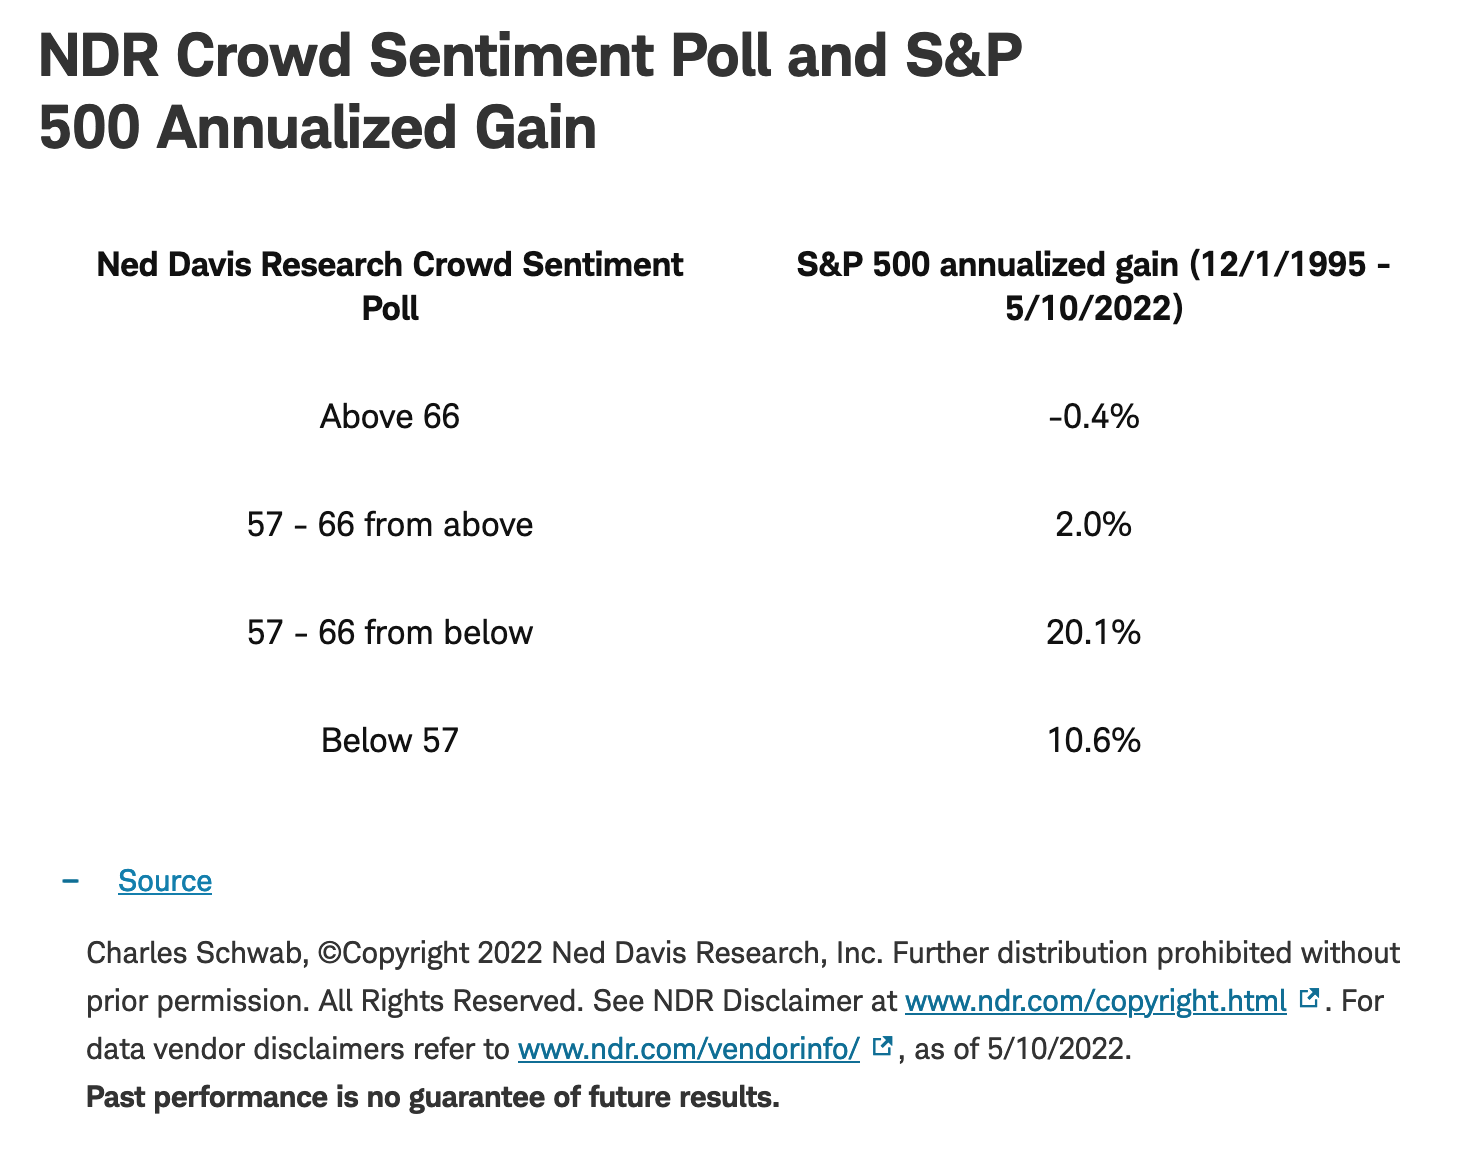
Source: Charles Schwab, ©Copyright 2022 Ned Davis Research, Inc.
Further distribution prohibited without prior permission. All Rights Reserved. See NDR Disclaimer at www.ndr.com/copyright.html. For data vendor disclaimers refer to www.ndr.com/vendorinfo/, as of 5/10/2022. Past performance is no guarantee of future results.

Volatility spikes likely to persist
"Fear index" not at extreme

Source: Charles Schwab, Bloomberg, as of 5/13/2022.
In sum
There is no perfect signal of when bear markets end. What we do know is that in bear markets, from a technical perspective, support becomes less relevant and resistance becomes more relevant. Assessing technicians' consensus, as an example, resistance sits somewhere between 4330 and 4400 on the S&P 500, a range (for now) that represents a key hurdle. Although Friday brought a "volume thrust" (with higher volume associated with stronger stocks), historically persistent declines tend to end (or pause) with a string/series of positive breadth days. For now, rallies are more likely countertrend, while bouts of weakness are the trend.
Copyright © Charles Schwab & Company Ltd.


