by Jean-Sébastien Nadeau, MBA, CFA®, AGF Management Ltd.
There’s a good reason why some investors feel uneasy about the shape of the U.S. Treasury yield curve these days. When some parts of it invert – as was briefly the case earlier this spring – the curve has been a reliable signal that recession may soon be on its way.
But for all the historical evidence that proves this relationship out, it’s important that investors not lose sight of the many central bank policies that are determining the direction of bond yields in the here and now. In fact, after more than a decade of extraordinary measures by the U.S. Federal Reserve, the yield curve may not be the same harbinger of economic decline that it was in the past.
Yield Curve Explained; Steep, Flat and Inverted

For Illustrative purposes only
The History of Yield Curve Inversions and Recessions
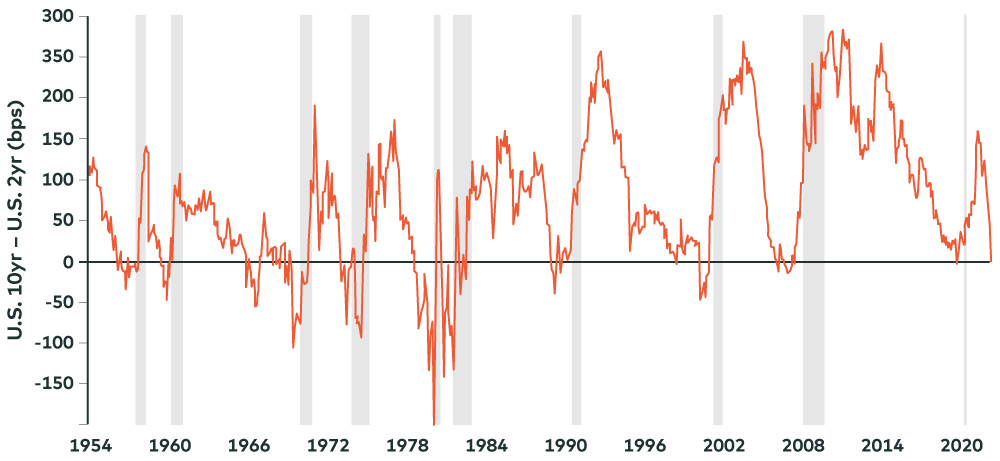
To be clear, the relationship between yield curve inversions and recessions has always been more nuanced than some investors may believe. For instance, while every U.S. recession since World War II was preceded by some part of the U.S. yield curve inverting, only four of the past six United Kingdom recessions happened on the heels of an inverted U.K. yield curve, Bloomberg data shows.
Moreover, not all inverted parts of the yield curve are created equally when it comes to their so-called power to predict recessions within a certain time frame. The segment of the yield curve bookended by two- and 10-year yields is largely considered one of the best barometers of economic decline, yet when this segment inverts, the probability of recession occurring within the next 12 months is just 40%, according to research from TD Securities, while the chance of one happening 12 to 24 months after inversion is 48%.
U.S. Two- and 10-year Treasury Yield Inversions Prior to Recession

Source: Deutshe Bank, As of March 2022. – Vertical bars represent past recessions.
Causation Versus Correlation
Even in the instance that an inverted two- and 10-year yield spread is followed by a recession, it’s debatable whether this is a cause-and-effect relationship or simply a correlated one. Proponents of the first theory believe an inverted yield curve causes recession because it negatively impacts bank lending, which curtails economic growth in turn. Of course, this makes intuitive sense. After all, banks largely make money borrowing short term at low rates and lending longer term at higher rates and may be less incentivized to lend when the yield curve inverts.
Still, not everyone agrees. Bank lending only represents a small portion of the overall credit market and isn’t large enough to topple the economy – even if it slowed significantly in the wake of an inversion. In fact, to that end, Goldman Sachs research shows 70% of all credit provided to non-financial corporations comes from the issuance of bonds – rather than through the banking system – and isn’t influenced by an inversion in the yield curve one way or the other.
Based on that reasoning alone, an inverted yield curve may not be the cause of recessions as much as it is correlated to them. Moreover, central bank policy plays a critical role in drawing the connection that exists between yield curve inversions and recessions. For example, consider what happens when monetary policy is tightened by a central bank through the rise of its overnight lending rate. Not only does it lead to higher short-term rates, but it also pulls long-term yields lower as markets start to anticipate slower economic growth.
In other words, it is central bank tightening that more likely causes recessions, while yield curve inversions are just the consequence of that relationship.
Why This Time Might Be Different
Either way, there’s no set reason to believe the relationship between yield curve inversions and recessions will continue. Today, there are multiple factors at play which suggest parts of the yield curve that recently inverted did so more easily than they have in the past and may not be a precursor to recession this time around.
First, the curve is now likely distorted by the Fed’s direct purchase of U.S. Treasuries over the past decade and represents a very different policy backdrop from the time of inversions prior to the Global Financial Crisis when the Fed’s first round of quantitative easing (QE) was unleashed. Including the most recent QE program conducted to counter the negative impact of the Covid-19 pandemic, the U.S. central bank’s balance sheet has now ballooned to almost US$6 trillion, or 28% of outstanding coupon-paying Treasuries, which has likely depressed term premiums and kept the yield curve flatter – and more susceptible to inverting – than it would be otherwise. On March 15th, the day of the Fed’s first rate hike this cycle, for example, the two-and 10-year spread was just 24 basis points (bps) compared to an average of more than 150 bps at the time of first-rate hikes in the previous three cycles, according to Bloomberg data.
A second reason to believe this time could be different is the expected trajectory of Fed rate hikes over the next few years. In more conventional tightening cycles, the Fed would raise its overnight lending rate as high as – but not beyond – its pre-determined long-term neutral rate for keeping the economy operating at full employment while maintaining inflation at a constant rate. However, given a current U.S. inflation rate of close to 8%, the Fed intends to increase its benchmark interest rate above the neutral rate – at least for a period – in hopes of getting inflation back under control. More specifically, the U.S. central bank’s “dot plot” of interest rate projections shows the overnight rate be higher than the neutral rate through 2023 and 2024, meaning the short end of the U.S. yield curve could be more elevated than usual.
The U.S. Federal Reserve’s “Dot Plot”

Source: Bloomberg LP. As of March 17, 2022.
The long end of the curve, meanwhile, is being shaped by various technical factors such as demand from defined benefit pension funds and overseas investors such as Japanese life insurance companies that have pressured long-term yield lowers more recently. Furthermore, a flight to quality on the back of the tragic events in Ukraine might also be contributing to lower long yields.
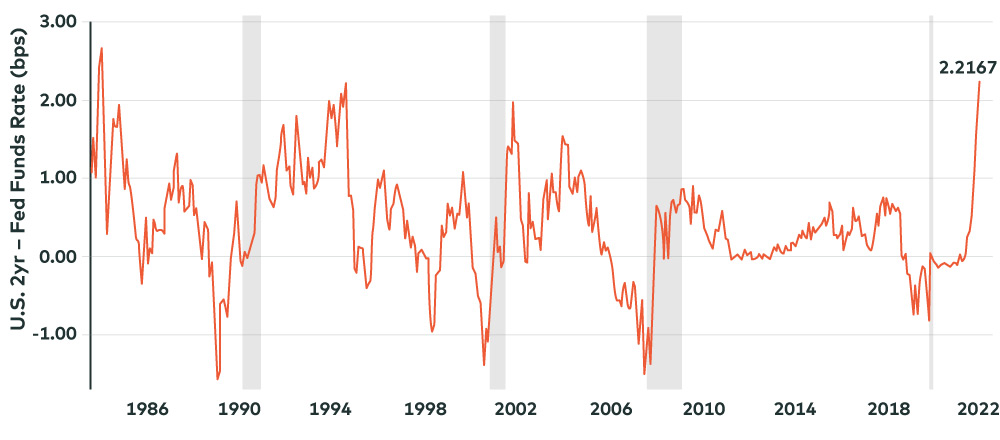
All of that said, perhaps the biggest reason to believe recent inversions like the two-and 10-year may not be signalling another recession is the fact that other parts of the curve were – and are – nowhere near inverting. In particular, the spread between the overnight Fed funds rate and two-year Treasury yield remains especially steep and recently reached historical highs. It’s also, for many, the most accurate barometer of recession – even more so than the two-and 10-year – and based on Bloomberg data has almost always inverted prior to past periods of negative U.S. economic growth. Indeed, it’s interesting to note that U.S. Federal Reserve Chairman Jerome Powell dismissed the inversion of certain parts of the yield curve earlier this year by referring to the steepness of the curve at the very short end of it.
Fed Funds Rate and Two-year Yield Inversions Prior to Recession

Source: Bloomberg LP. As of April 29, 2022. Vertical bars represent past recessions.
Ultimately, fears of a U.S. recession sometime later this year may be overblown despite the recent inversion(s) of the yield curve. While tighter monetary policy hints at slower growth in the months ahead, other economic indicators such as Purchasing Manager Indexes remains relatively healthy and the U.S. consumer continues to be in good shape based on debt-to-disposable income and debt servicing ratios that are near generational lows.
That’s not to say investors can rest easy. While a recession may not be immediately in the cards, the unfolding of a slower growth environment will almost surely result in continued market volatility and choppier portfolio returns going forward.
To learn more about our fundamental capabilities, please click here.
To learn more about our fundamental capabilities, please click here.
To learn more about our fundamental capabilities, please click here.
The views expressed in this blog are those of the authors and do not necessarily represent the opinions of AGF, its subsidiaries or any of its affiliated companies, funds, or investment strategies.
The commentaries contained herein are provided as a general source of information based on information available as of April 29, 2022 and are not intended to be comprehensive investment advice applicable to the circumstances of the individual. Every effort has been made to ensure accuracy in these commentaries at the time of publication, however, accuracy cannot be guaranteed. Market conditions may change and AGF Investments accepts no responsibility for individual investment decisions arising from the use or reliance on the information contained here.
“Bloomberg®” is a service mark of Bloomberg Finance L.P. and its affiliates, including Bloomberg Index Services Limited (“BISL”) (collectively, “Bloomberg”) and has been licensed for use for certain purposes by AGF Management Limited and its subsidiaries. Bloomberg is not affiliated with AGF Management Limited or its subsidiaries, and Bloomberg does not approve, endorse, review or recommend any products of AGF Management Limited or its subsidiaries. Bloomberg does not guarantee the timeliness, accurateness, or completeness, of any data or information relating to any products of AGF Management Limited or its subsidiaries.
AGF Investments is a group of wholly owned subsidiaries of AGF Management Limited, a Canadian reporting issuer. The subsidiaries included in AGF Investments are AGF Investments Inc. (AGFI), AGF Investments America Inc. (AGFA), AGF Investments LLC (AGFUS) and AGF International Advisors Company Limited (AGFIA). AGFA and AGFUS are registered advisors in the U.S. AGFI is registered as a portfolio manager across Canadian securities commissions. AGFIA is regulated by the Central Bank of Ireland and registered with the Australian Securities & Investments Commission. The subsidiaries that form AGF Investments manage a variety of mandates comprised of equity, fixed income and balanced assets.
® The “AGF” logo is a registered trademark of AGF Management Limited and used under licence.
RO:20220506-2186241
About AGF Management Limited
Founded in 1957, AGF Management Limited (AGF) is an independent and globally diverse asset management firm. AGF brings a disciplined approach to delivering excellence in investment management through its fundamental, quantitative, alternative and high-net-worth businesses focused on providing an exceptional client experience. AGF’s suite of investment solutions extends globally to a wide range of clients, from financial advisors and individual investors to institutional investors including pension plans, corporate plans, sovereign wealth funds and endowments and foundations.
For further information, please visit AGF.com.
© 2022 AGF Management Limited. All rights reserved.
This post was first published at the AGF Perspectives Blog.


