
by Darim Abdullah, Invesco Canada
During the six U.S. Federal Reserve tightening cycles since 1983, U.S. large-cap growth stocks outperformed during four of them. Darim Abdullah, Vice President – ETF Strategist, explores the Nasdaq 100 Index over the past decade and the most recent tightening cycle.
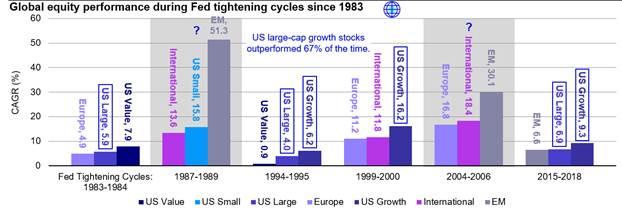
Against the backdrop of tightening U.S. Federal Reserve (Fed) policy, multi-decade high inflation figures, and an uncertain global geopolitical environment, investors are looking for opportunities that can provide growth potential during these times. History has shown us that during the six Fed tightening cycles we’ve experienced since 1983, U.S. large-cap growth stocks outperformed during four of them — that’s 67% of the time (Figure 1). We expect this asset class to resurface once again on the back of tighter fiscal and monetary policy coupled with slower economic activity.
Figure 1: U.S. large-cap growth stocks have outperformed in past Fed tightening cycles
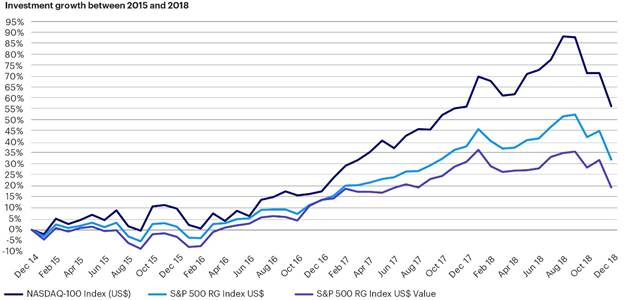
How did the Nasdaq 100 Index fare during the previous rate hike cycle?
Despite investors’ fears around the prospects of growth-oriented companies given today’s rising rate environment, previous experiences have shown that rising rates don’t necessarily result in a poor performance.
Although all market cycles are different, we saw the growth-oriented Nasdaq 100 Index outperform other large-cap indexes during the last Fed rate hike cycle that lasted from 2015 to 2018. During those years, we saw a total of nine 0.25% hikes to the federal funds rate — and the Nasdaq 100 Index outperformed the S&P 500 Index by 12.24% and the S&P 500 Value Index by 19.38%, generating cumulative total return of 40.61% (Figure 2).
Figure 2: The Nasdaq 100 Index outperformed other large-cap indexes during the last Fed rate hike cycle
Strong fundamentals do matter
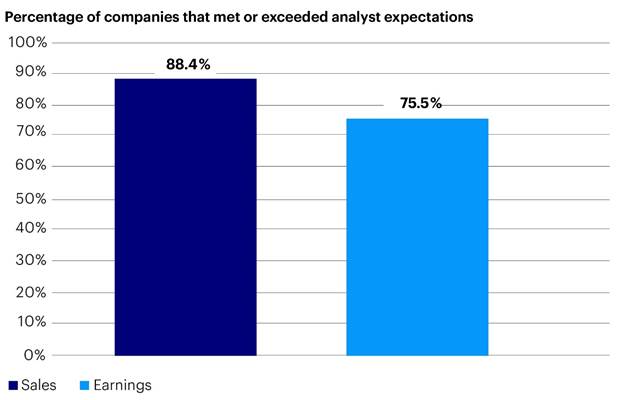
Although the Nasdaq 100 Index has faced negative performance thus far in 2022, it’s important to keep in mind the strong growth that many of the underlying companies have experienced over the past decade. The growth seen in earnings and sales, combined with the ongoing emphasis on innovation, have been the catalysts for the robust performance seen from the Nasdaq 100 Index throughout the years. For the past 10 years, 88% and 76% of Nasdaq’s underlying companies met or exceeded analysts’ expectations on sales and earnings respectively (Figure 3).
Figure 3: Over the past decade, most Nasdaq 100 Index companies have met or exceeded expectations for sales and earnings
Conclusion
Uncertainty around future monetary policy changes coming from the Fed, along with the expectation of future growth slowing, has introduced higher volatility into the Nasdaq 100 Index and equities overall. While recent performance may be a concern, longer-term performance has been supported by strong growth in sales and earnings. And importantly, while past performance cannot predict future performance, the Nasdaq 100 Index outperformed the S&P 500 Index and the S&P 500 Value Index during the last Fed rate hike cycle. This history of growth may provide reassurance for investors during uncertain times.
Investors can access the Nasdaq 100 Index through the Invesco Nasdaq 100 Index ETF and the Invesco NASDAQ 100 Index ETF Fund.
With contributions from Talley Léger and Ryan McCormick
1 Figure 1 index definitions: Emerging Market (EM): The MSCI Emerging Market Index measures the equity market performance of emerging markets. International: The MSCI All-Country World Index (ACWI) measures the equity market performance of developed and emerging markets. Europe: The MSCI Europe Index measures the equity market performance of Europe. U.S. Growth: The Russell 1000 Growth Index measures the performance of the large-cap growth segment of the U.S. equity universe. U.S. Large: The S&P 500 Index measures the performance of 500 of the largest companies in the U.S. U.S. Small: The Russell 2000 Index measures the performance of the small-cap segment of the U.S. equity universe. U.S. Value: The Russell 1000 Value Index measures the performance of the large-cap value segment of the U.S. equity universe.
This post was first published at the official blog of Invesco Canada.