


by Talley Léger, Invesco Canada
Equity strategist Talley Léger discusses one of his preferred gauges for assessing where we are in the U.S. corporate profit cycle — and what it’s telling investors today.
As my regular readers know, I’ve been bullish on U.S. earnings for over a year (and bullish on U.S. stocks for even longer), and I believe that has been the right view. But where are we in the U.S. corporate profit cycle today? Has the fundamental outlook changed?
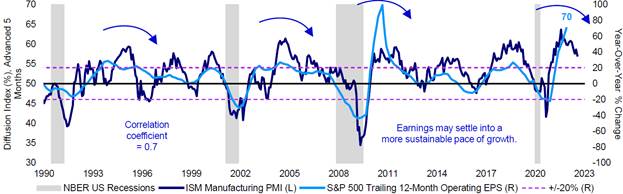
The Institute for Supply Management (ISM) Manufacturing Purchasing Managers Index (PMI) is one of my preferred gauges for assessing where we are in the U.S. corporate profit cycle. The ISM PMI is a direct measure of expectations captured by business surveys of production and the general economic climate in the U.S. More importantly, as shown in Figure 1, this sentiment indicator has helped to foresee earnings trends roughly half a year in advance.
After correctly signaling a V-shaped earnings recovery, U.S. manufacturing activity now suggests that peak earnings growth is likely behind us. Looking ahead, softer output suggests we may see slower but still robust earnings growth in 2022 (Figure 1).
Figure 1: U.S. manufacturing activity suggests peak earnings growth is likely behind us
U.S. manufacturing activity (pushed forward half a year) and earnings growth (up/downside thresholds) since 1990
Where are we in the U.S. market cycle?
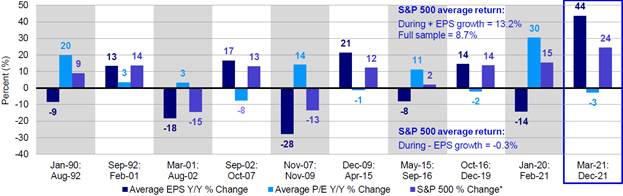
Historically, investors have been amply rewarded by simply sticking to stocks in periods when earnings growth was positive, as it is now. While I believe stocks remain the place to be amidst a moderating economy, peak earnings growth should compel investors to lower their expectations for absolute returns. In other words, I expect U.S. stocks to continue doing well in 2022, just probably not as well as they did in 2021 and 2020 (Figure 2).
Figure 2: U.S. stocks did best during periods of positive earnings growth
U.S. stock market returns during periods of positive (white) and negative (gray) earnings growth since 1990
Click here for more visual guidance on equity portfolio positioning in slowdown, U.S. Federal Reserve tightening, and inflation regimes.
This post was first published at the official blog of Invesco Canada.