by Don Vialoux, EquityClock.com
The Bottom Line
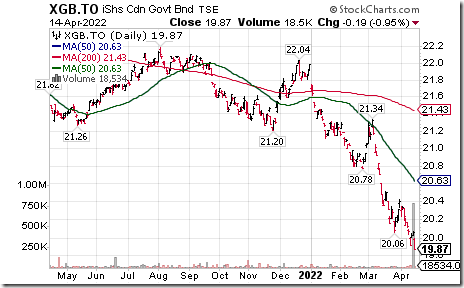
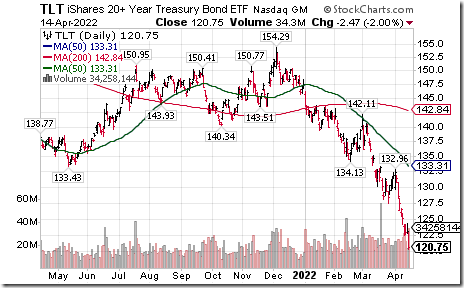
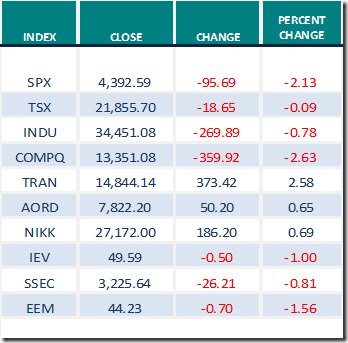
Rising interest rates on both sides of the border are impacting equity indices as well as bond prices.
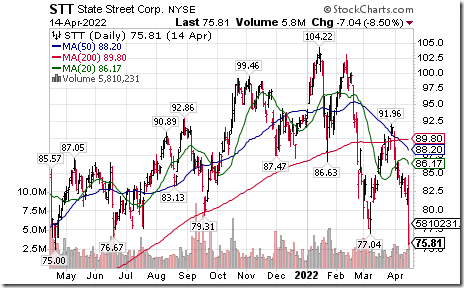
Responses to first quarter earnings reports released to date mostly have been negative unless the company reported blow out results or offered exceptionally positive guidance (e.g. Delta Airlines). S&P 500 companies, that moved lower following release of quarterly results, included JP Morgan, BlackRock, Fastenal, Bed Bath & Beyond, UnitedHealth Group, PNC Financial and State Street. Look for more of the same this week.
Observations
Consensus earnings estimate for S&P 500 companies on a year-over-year basis in the first quarter of 2022 increased last week. According to www.FactSet.com first quarter earnings on a year-over-year basis are expected to increase 5.1% (versus 4.5% last week) and revenues are expected to increase 10.8% (versus 10.7% last week
Consensus earnings estimates for S&P 500 companies beyond the first quarter on a year-over-year basis increased again. According to www.FactSet.com second quarter earnings are expected to increase 6.5% (versus 6.2% last week) and revenues are expected to increase 9.7% (versus 9.8% last week). Earnings in the third quarter are expected to increase 11.1% (versus 10.3% last week) and revenues are expected to increase 8.6% (versus an increase of 8.8% last week) Earnings in the fourth quarter are expected to increase 10.6% (versus 10.3% last week) and revenues are expected to increase 7.1% (versus 7.4% last week). Earnings on a year-over-year basis for all of 2022 are expected to increase 10.2% (versus 9.8% last week) and revenues are expected to increase 9.3% (versus 9.5% last week).
Economic News This Week
March Housing Starts to be released at 8:30 AM EDT on Tuesday are expected to slip to 1.750 million units from 1.769 million units in February.
March Canadian Consumer Price Index to be released at 8:30 AM EDT on Wednesday is expected to increase 0.9% versus a gain of 1.0% in February. On a year-over-year basis, March CPI is expected to increase 5.5% from 5.7% in February. Excluding food and energy, March CPI on a year-over-year basis is expected to increase 4.5% versus a gain of 4.8% in February.
March Existing Home Sales to be released at 10:00 AM EDT on Wednesday are expected to slip to 5.80 million units from 6.02 million units in February.
Beige Book is released at 2:00 PM EDT on Wednesday.
April Philly Fed Index to be released at 8:30 AM EDT on Thursday is expected to slip to 20.9 from 27.4 in March.
Federal Reserve Chair Powell is scheduled to speak at 1:00 PM EDT on Thursday.
February Canadian Retail Sales to be released at 8:30 AM EDT on Friday are expected to increase versus a gain of 3.2% in January. Excluding auto sales February Canadian Retail Sales are expected to increase 2.4% versus a gain of 2.5% in January.
Selected Earnings News This Week
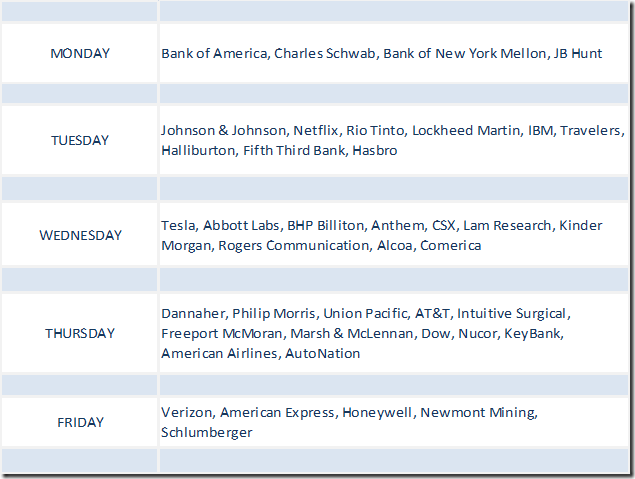
Seven percent of S&P 500 companies have reported to date. Another 13.4% of S&P 500 companies (i.e.67 companies) are scheduled to report this week (including seven Dow Jones Industrial Average companies).
Trader’s Corner
Equity Indices and Related ETFs
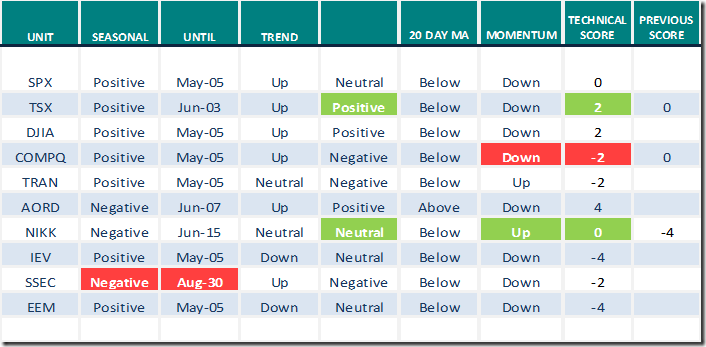
Daily Seasonal/Technical Equity Trends for April 14th 2022
Green: Increase from previous day
Red: Decrease from previous day
Commodities
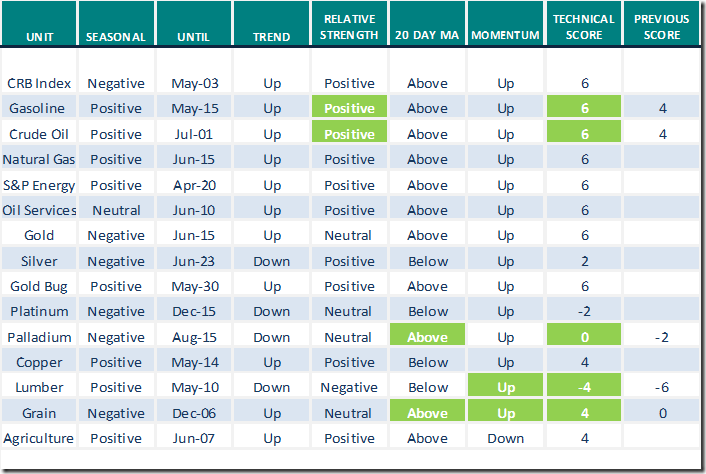
Daily Seasonal/Technical Commodities Trends for April 14th 2022
Green: Increase from previous day
Red: Decrease from previous day
Sectors
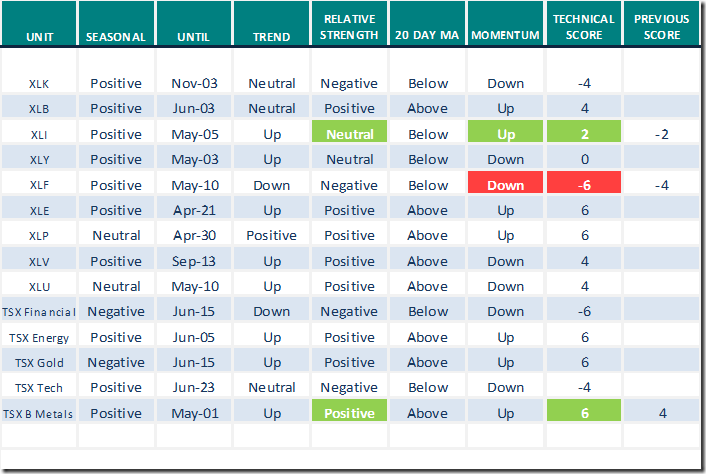
Daily Seasonal/Technical Sector Trends for April 14th 2021
Green: Increase from previous day
Red: Decrease from previous day
All seasonality ratings are based on performance relative to the S&P 500 Index (except TSX)
Links offered by valued providers
Greg Schnell discusses “Some new views I appreciate”.
Some New Views I Appreciate! | The Canadian Technician | StockCharts.com
Greg Schnell notes “Tectonic shifts are occurring”
Tectonic Shifts are Occurring | ChartWatchers | StockCharts.com
Comments by Mark Leibovit
Inflation, Interest Rates, Elon Musk – HoweStreet
Money Talks with Michael Campbell
April 16th Show Now Available (mikesmoneytalks.ca)
Arthur Hill from www.StockCharts.com says “A defensive picture has appeared no matter how you slice it”
A Defensive Picture No Matter How you Slice It | ChartWatchers | StockCharts.com
Larry Williams asks “Is it time to get bearish”?
Is it Time to Get Bearish? | Larry Williams Special Presentation (04.15.22) – YouTube
Mary Ellen McGonagle from www.StockCharts.com asks “Are we headed lower”?
Are We Headed Lower? | Mary Ellen McGonagle | The MEM Edge (04.15.22) – YouTube
Trading Desk Notes for April 16, 2022 by Victor Adair
Trading Desk Notes for April 16, 2022 – The Trading Desk Notes by Victor Adair
Links from Mark Bunting and www.uncommonsenseinvestor.com
Three Rip Van Winkle Stocks – Uncommon Sense Investor
Five Reasons the Worst May Be Over for Stocks – Uncommon Sense Investor
7 REITs Flaunting Fast-Growing Dividends | Kiplinger
https://landing.hedgeye.com/summit-2022/
Tom Bowley says “Great Day, but a major problem looms”.
https://www.youtube.com/watch?v=4pdrjB3d8As
Technical Scoop for April 18th from David Chapman and www.EnrichedInvesting.com
Technical Scores
Calculated as follows:
Intermediate Uptrend based on at least 20 trading days: Score 2
(Higher highs and higher lows)
Intermediate Neutral trend: Score 0
(Not up or down)
Intermediate Downtrend: Score -2
(Lower highs and lower lows)
Outperformance relative to the S&P 500 Index: Score: 2
Neutral Performance relative to the S&P 500 Index: 0
Underperformance relative to the S&P 500 Index: Score –2
Above 20 day moving average: Score 1
At 20 day moving average: Score: 0
Below 20 day moving average: –1
Up trending momentum indicators (Daily Stochastics, RSI and MACD): 1
Mixed momentum indicators: 0
Down trending momentum indicators: –1
Technical scores range from -6 to +6. Technical buy signals based on the above guidelines start when a security advances to at least 0.0, but preferably 2.0 or higher. Technical sell/short signals start when a security descends to 0, but preferably -2.0 or lower.
Long positions require maintaining a technical score of -2.0 or higher. Conversely, a short position requires maintaining a technical score of +2.0 or lower
Changes Last Week
Technical Notes released on Thursday at
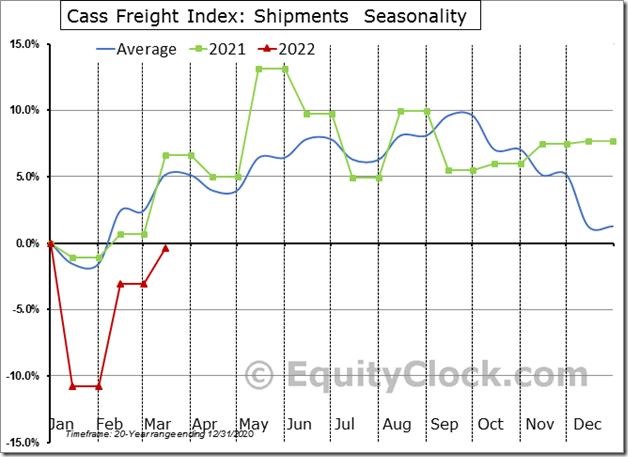
Shipping volumes remained sluggish through the month of March, presenting a warning for the health of the broader economy. equityclock.com/2022/04/13/… $MACRO $STUDY #Economy #Shipping $IYT $DJT
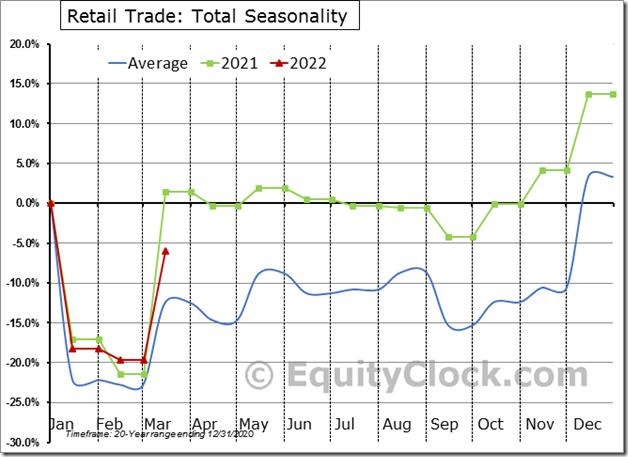
US Retail Trade jumped by 17.0% (NSA) in March, well ahead of the 14.1% rise that is average for this third month of the year. $STUDY $MACRO #Economy #Consumer #Retail $XRT $RTH
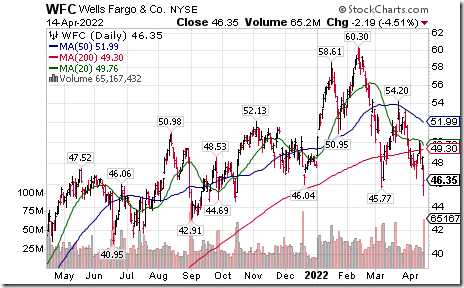
Wells Fargo $WFC an S&P 100 stock moved below $45.77 extending an intermediate downtrend. The company reported lower than consensus first quarter revenues this morning.
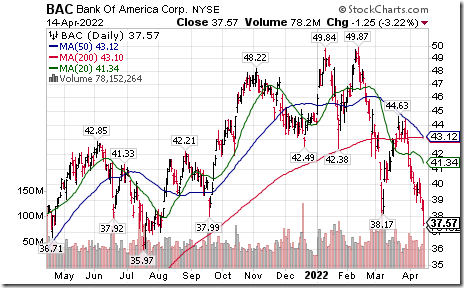
Bank of America $BAC an S&P 100 stock moved below $38.17 extending an intermediate downtrend
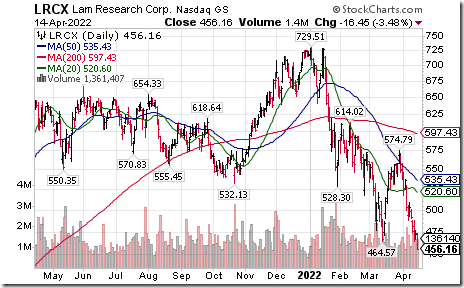
Lam Research $LRCX a NASDAQ 100 stock moved below $464.57 extending an intermediate downtrend.
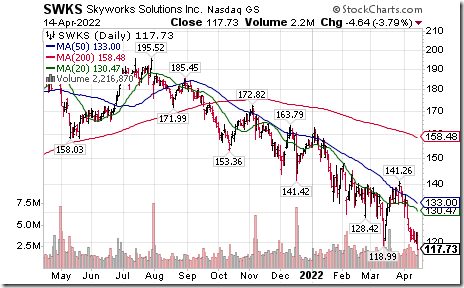
Skyworks Solutions $SWKS a NASDAQ 100 stock moved below $118.99 extending an intermediate downtrend.
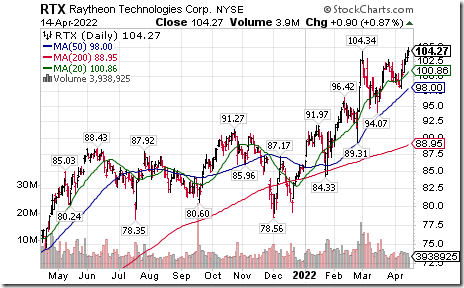
Raytheon Technologies $RTX a Dow Jones Industrial Average stock moved above $104.34 to an all-time high extending an intermediate uptrend.
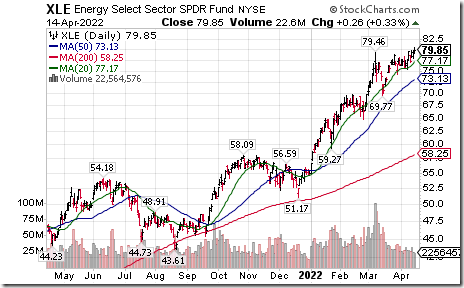
Energy SPDRs $XLE moved above $79.46 to an all-time high extending an intermediate uptrend. Seasonal influences are favourable to June 11th. If a subscriber to EquityClock, see seasonality chart at https://charts.equityclock.com/energy-select-sector-spdr-fund-nysexle-seasonal-chart
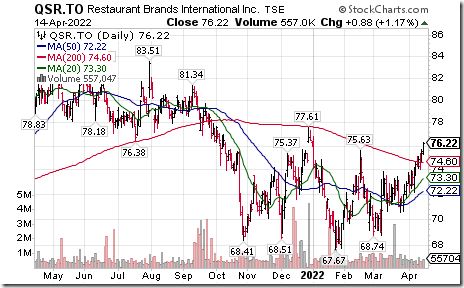
Restaurant Brands International $QSR.CA a TSX 60 stock moved above Cdn$75.63 completing a bottoming pattern. Seasonal influences are favourable to May 18th. If a subscriber to EquityClock, see seasonality chart at https://charts.equityclock.com/restaurant-brands-international-inc-tseqsr-to-seasonal-chart
S&P 500 Momentum Barometers
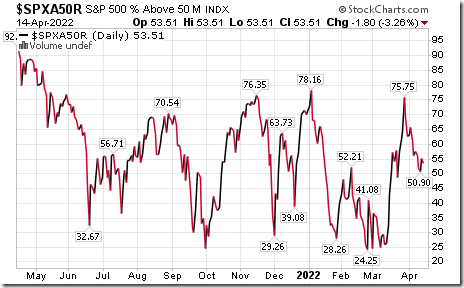
The intermediate term Barometer slipped 1.80 on Thursday and 2.80 last week to 53.51. It remained Neutral. Trend is down.
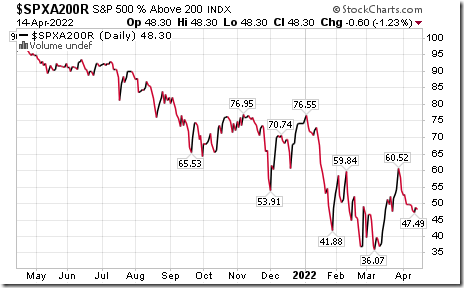
The long term Barometer slipped 0.60 on Thursday and 1.20 last week. It remained Neutral. Trend is down.
TSX Momentum Barometers
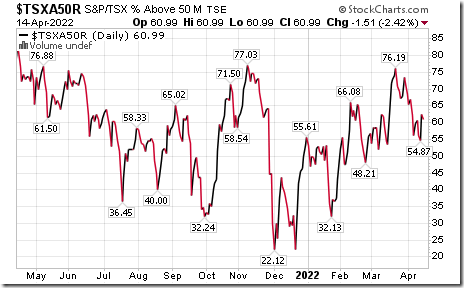
The intermediate term Barometer eased 1.51 on Friday, but added 0.37 last week. It remained Overbought.
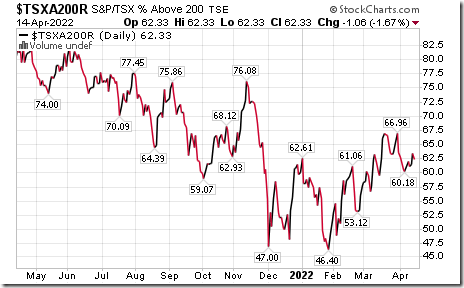
The long term Barometer slipped 1.06 on Friday, but added 0.38 to 62.33 last week. It remained Overbought.
Disclaimer: Seasonality and technical ratings offered in this report and at
www.equityclock.com are for information only. They should not be considered as advice to purchase or to sell mentioned securities. Data offered in this report is believed to be accurate, but is not guaranteed.
This post was originally publised at Vialoux's Tech Talk.


