


by Abhishek Ashok, M.A., MFE, CFA®, AGF Management Ltd.
Every month, AGFiQ highlights the investment factors that are helping shape equity markets. Today’s focus is the relationship of certain factor performance with Purchasing Manager Indexes (PMIs).
The biggest question facing investors these days seems to be whether the global economy is set to plunge into recession, yet not everyone seems willing to wait for the answer. Instead, equity markets are reeling from the growing list of economic headwinds now at play and several facets of the selloff suggest the chance of a significant slowdown in the business cycle is a fait accompli that could lead to economic growth turning negative this year.
To that end, the latest set of research from AGFiQ – the quantitative platform for AGF – looks at how some factors are behaving in relation to Purchasing Manager Indexes (PMIs) to provide a clearer understanding of what’s being priced in by investors and where opportunities in the market may arise in the future.
As a reminder, PMIs are an important gauge of manufacturing activity that are regularly used by investors as a proxy for the broader economy’s overall strength or weakness. A score of 50 or more, for example, is often viewed as representing a business cycle expansion, while a score of 50 or less represents a contraction that often coincides with recession, but not always.
That said, PMIs today seem just about as healthy as they can be. Yes, they’ve weakened over the past year from their peak near 65 in March of 2021, but they remain squarely in “expansion” territory and nowhere near the level that signals a contraction. That could change quickly if the war in Ukraine escalates and/or the U.S. Federal Reserve raises rates too aggressively, but it could be close to a year from now before PMIs fall to 50 or below, based on historical peaks and troughs in the metric.
More importantly, our analysis shows that factor volatility related to momentum stocks was usually no more than average when PMIs were at similar levels in the past to what they are now. In fact, that was exactly the case for much of 2021. In more recent months, however, momentum volatility has spiked and may be headed to levels more historically reached when PMIs were signalling a contraction or verging on one. In other words, even though the equity market normally moves in anticipation of where the economy is headed, this time it may be further afoot than usual.
Purchasing Manager Indexes (PMIs) and Factor Volatility
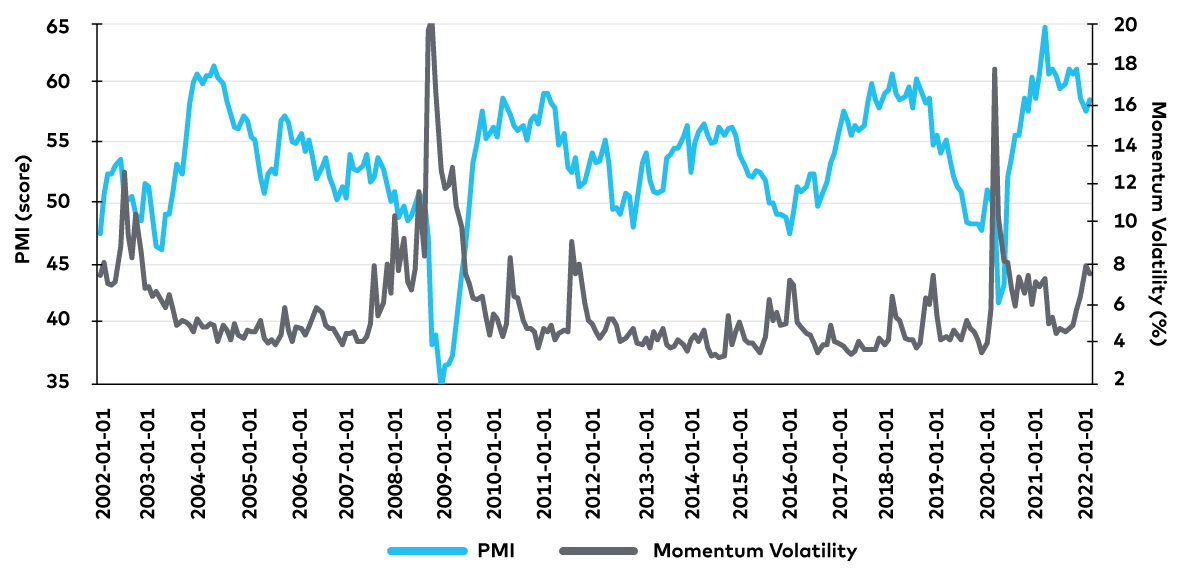
Source: AGFiQ using data from FactSet as of February 28, 2022. Momentum volatility is a measure of intra-day volatility in momentum stocks over rolling three-month periods. Purchasing Manager Indexes are represented by U.S. ISM Manufacturing PMI data.
Another interesting aspect of our latest analysis is the performance spread of low and high volatility stocks in the current environment. Not surprisingly, the former has outperformed the latter over the past three months. After all, despite current PMI scores, that’s generally what happens when markets sell off, no matter the reason for it.
But what is a surprise is just how much low-volatility stocks have outperformed high-volatility stocks over this stretch. Rarely has the performance spread between the two been this large outside of a business cycle trough and the spread is greater now than it was during the pandemic-induced recession of 2020.
Moreover, it’s not because low-volatility stocks have performed extraordinarily well that the spread is so great, but because high-volatility stocks have performed extraordinarily poorly. In fact, they’ve underperformed the broader market by as much as 15% over the past three months, which, again, is not often the case in non-recessionary business cycle environments.
Of course, extremes of this magnitude – as we’ve noted in past blogs in this series – often represent inflection points that result in factor performance reverting to the mean (or average) over time. In this case, for example, high-volatility stocks, as a group, may offer more upside going forward than they surely have over the past few months.
Low Volatility Versus High Volatility Performance
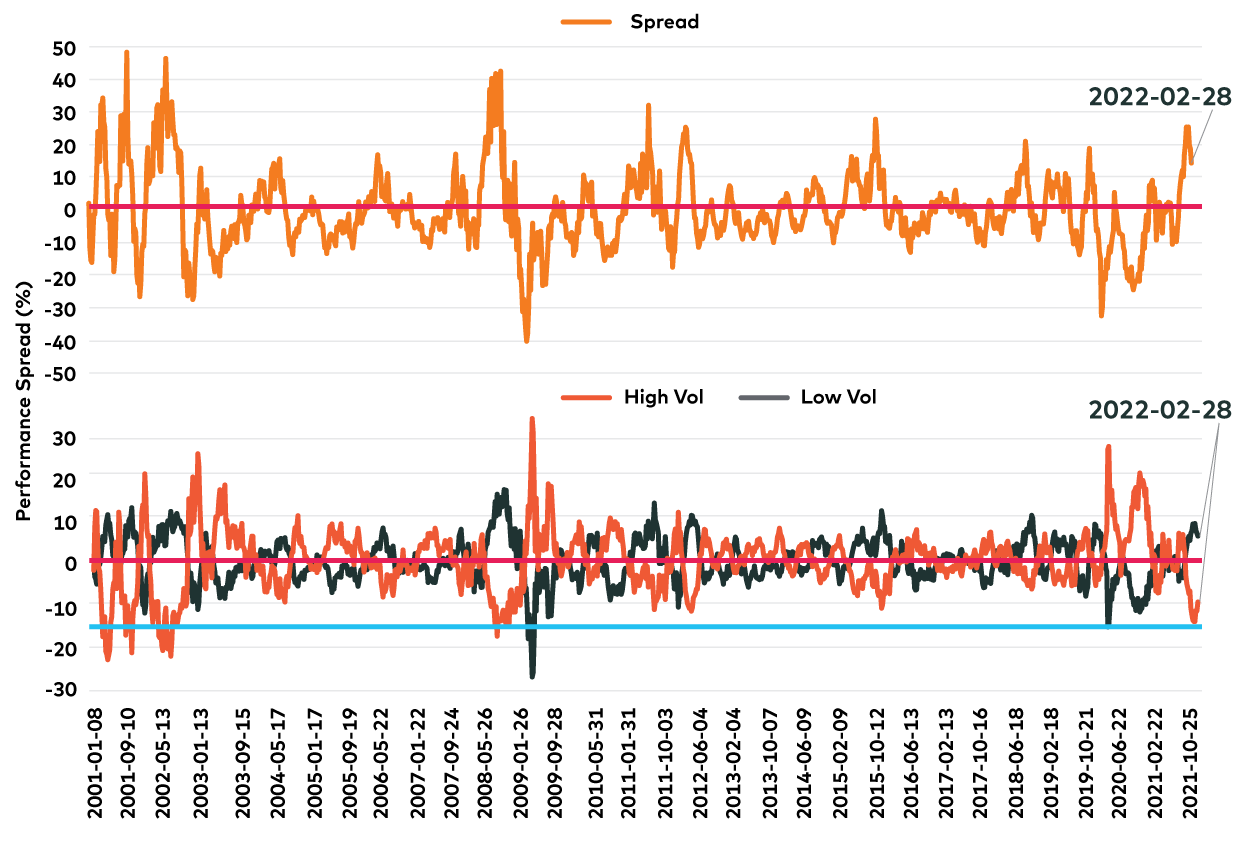
Source: AGFiQ using data from FactSet as of February 28, 2022. Top chart represents the performance spread between the lowest and highest volatility stocks (quintiles) within the top 550 securities in the U.S. by market capitalization. Bottom chart represents the performance spread of the lowest and highest volatility stocks (quintiles) within the top 550 securities in the U.S. by market capitalization relative to the broader market.
Still, investors need to be selective. In addition to the potential opportunity in high-volatility stocks, our research shows that owning high-quality stocks may be an even more attractive tactic in the short term.
Once again, this is because quality stocks have underperformed the broader market in uncharacteristic fashion over the course of the selloff this year. Historically, it’s only about 7% of the time that quality stocks have underperformed during these market downturns and rarely have they done so to the same magnitude as they have of late. These periods of underperformance have generally been attractive entry points over the past 20 years, with this segment posting strong subsequent performance relative to the market.
High-Quality Stocks: Relative Returns to the Broader Market
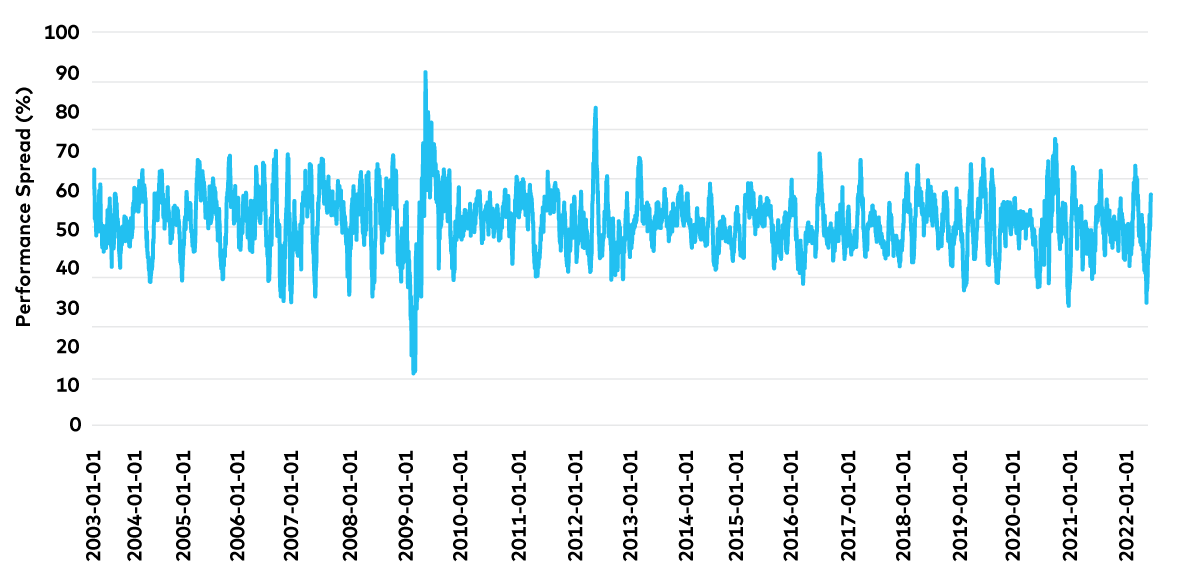
Source: AGFiQ using data from FactSet as of February 28, 2022. Spread represents the spread between the stocks with the highest Return on Invested Capital (Quintile) within the top 550 securities in the U.S. by market capitalization relative to the broader market.
Ultimately, there’s little doubt based on our research that equity investors are anticipating a significant business cycle slowdown, but given where PMIs stand today, what’s less certain is whether one is imminent.
Either way, opportunities that exist going forward may come down to how much or how little of the eventual outcome for the economy is already priced into the market.
Click to learn more about our Quantitative capabilities.
The views expressed in this blog are those of the authors and do not necessarily represent the opinions of AGF, its subsidiaries or any of its affiliated companies, funds, or investment strategies.
The commentaries contained herein are provided as a general source of information based on information available as of March 15, 2022 and are not intended to be comprehensive investment advice applicable to the circumstances of the individual. Every effort has been made to ensure accuracy in these commentaries at the time of publication, however, accuracy cannot be guaranteed. Market conditions may change and AGF Investments accepts no responsibility for individual investment decisions arising from the use or reliance on the information contained here.
References to specific securities are presented to illustrate the application of our investment philosophy only and do not represent all of the securities purchased, sold or recommended for the portfolio. It should not be assumed that investments in the securities identified were or will be profitable and should not be considered recommendations by AGF Investments.
This document is intended for advisors to support the assessment of investment suitability for investors. Investors are expected to consult their advisor to determine suitability for their investment objectives and portfolio.
AGFiQ is a quantitative investment platform powered by an intellectually diverse, multi-disciplined team that combines the complementary strengths of investment professionals from AGF Investments Inc. (AGFI), a Canadian registered portfolio manager, and AGF Investments LLC (AGFUS), a U.S. registered adviser.
AGF Investments is a group of wholly owned subsidiaries of AGF Management Limited, a Canadian reporting issuer. The subsidiaries included in AGF Investments are AGF Investments Inc. (AGFI), AGF Investments America Inc. (AGFA), AGF Investments LLC (AGFUS) and AGF International Advisors Company Limited (AGFIA). AGFA and AGFUS are registered advisors in the U.S. AGFI is registered as a portfolio manager across Canadian securities commissions. AGFIA is regulated by the Central Bank of Ireland and registered with the Australian Securities & Investments Commission. The subsidiaries that form AGF Investments manage a variety of mandates comprised of equity, fixed income and balanced assets.
® The “AGF” and ™ “AGFiQ” logos are registered trademarks of AGF Management Limited and used under licence.
RO:20220322-2083052
About AGF Management Limited
Founded in 1957, AGF Management Limited (AGF) is an independent and globally diverse asset management firm. AGF brings a disciplined approach to delivering excellence in investment management through its fundamental, quantitative, alternative and high-net-worth businesses focused on providing an exceptional client experience. AGF’s suite of investment solutions extends globally to a wide range of clients, from financial advisors and individual investors to institutional investors including pension plans, corporate plans, sovereign wealth funds and endowments and foundations.
For further information, please visit AGF.com.
© 2022 AGF Management Limited. All rights reserved.
This post was first published at the AGF Perspectives Blog.