by Don Vialoux, EquityClock.com
Reponses to FOMC News released at 2:00 PM EDT Yesterday
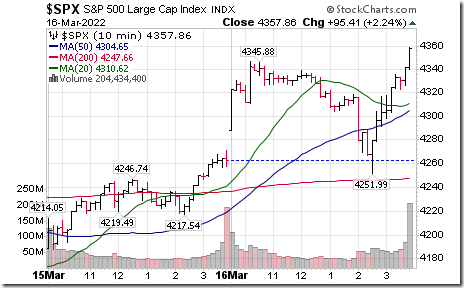
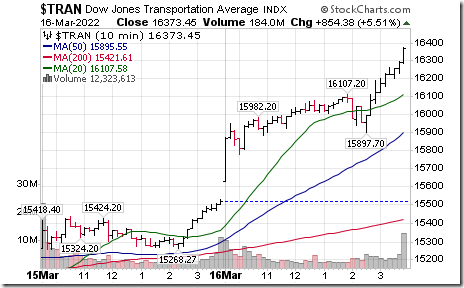
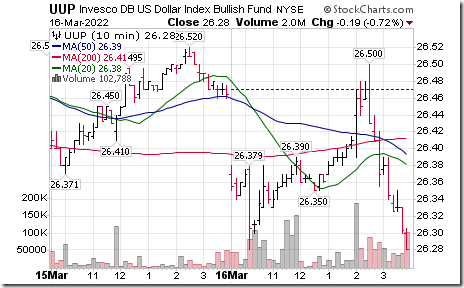
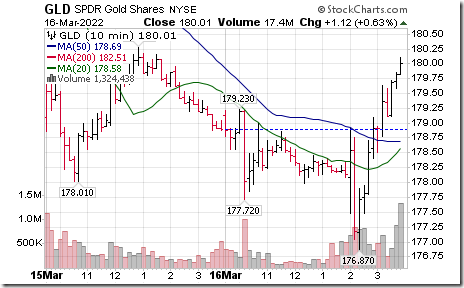
In order to reduce inflation expectations in the U.S., the Federal Reserve raised the Fed Fund Rate by 0.25% to 0.25%-0.50%, predicted a series of six more increases in the Fed Fund Rate in 2022 and announced plans to reduce the size of the Federal Reserve’s balance sheet. Responses included:
S&P 500 Index initially moved lower after 2:00 PM EDT, but recovered strongly to close at the high for the day.
Dow Jones Transportation Average soared by the close
Initially, the U.S. Dollar ETN moved higher after 2:00 PM, but closed sharply weaker.
Gold, silver and precious metal equities/ETFs initially moved lower after 2:00 PM, but closed strongly higher with U.S. Dollar weakness.
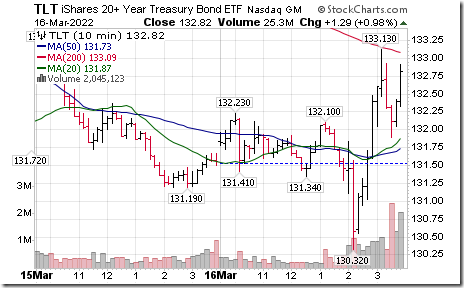
Long term Treasuries initially moved lower, but closed stronger
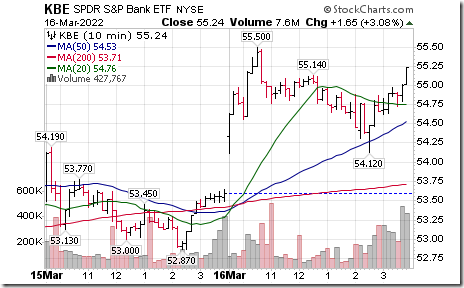
U.S. Big Cap Bank ETF $KBE moved higher in anticipation of widening interest rate spreads.
Technical Notes released yesterday at
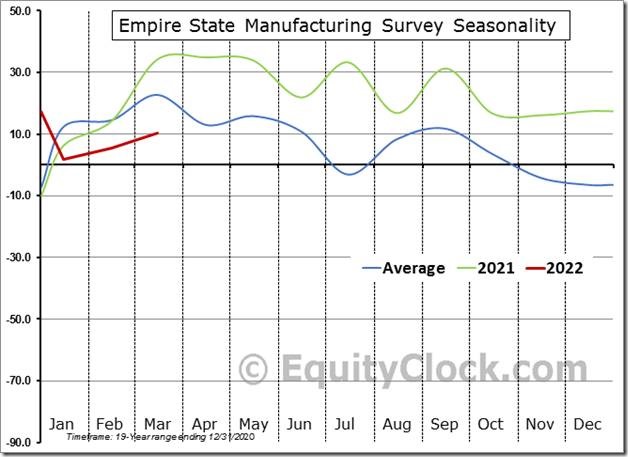
Headlines pointed to a shocking plunge in manufacturer sentiment in the New York region for March, but, while not great, the non-seasonally adjusted data provides an alternate view. equityclock.com/2022/03/15/… $MACRO $STUDY #Economy $ECONX #Manufacturing
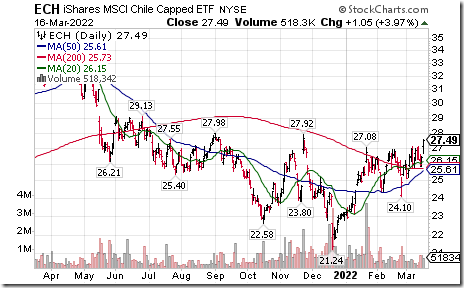
Chile iShares $ECH moved above $27.08 completing a reverse Head & Shoulders pattern. Responding to higher base metal prices. Seasonal influences are favourable to mid-April. If a subscriber to EquityClock, see seasonality chart at https://charts.equityclock.com/ishares-msci-chile-capped-etf-nyseech-seasonal-chart
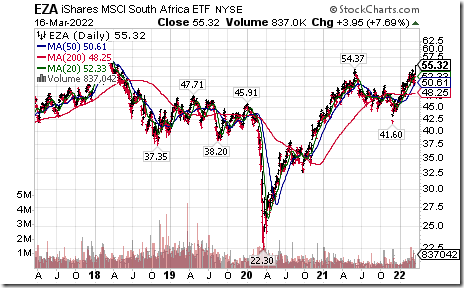
South Africa iShares $EZA moved above $54.37 to a five year high extending a long term uptrend.
Trader’s Corner
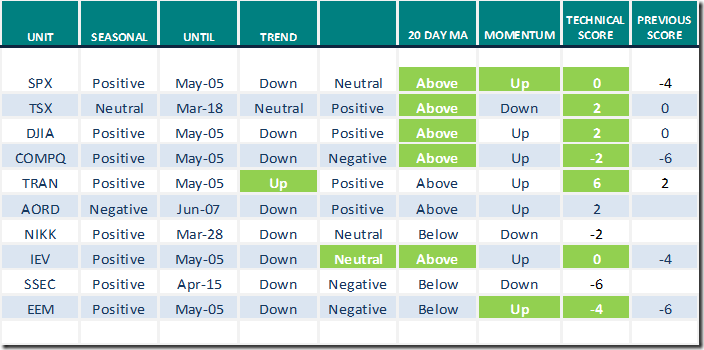
Equity Indices and Related ETFs
Daily Seasonal/Technical Equity Trends for March 16th 2022
Green: Increase from previous day
Red: Decrease from previous day
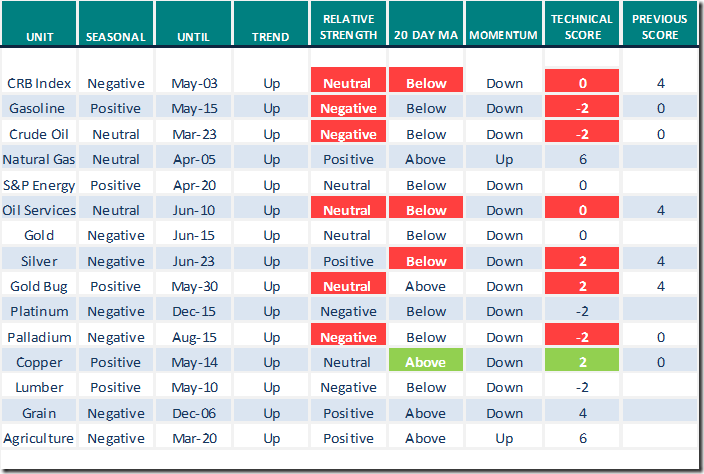
Commodities
Daily Seasonal/Technical Commodities Trends for March 16th 2022
Green: Increase from previous day
Red: Decrease from previous day
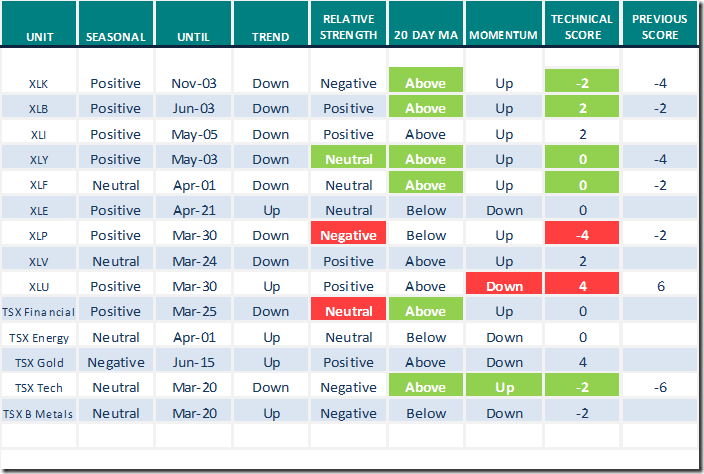
Sectors
Daily Seasonal/Technical Sector Trends for March 16th 2021
Green: Increase from previous day
Red: Decrease from previous day
All seasonality ratings are based on performance relative to the S&P 500 Index (except TSX)
Market Buzz by Greg Schnell
Greg says, “Commodities swing wildly”. Following is a link:
Commodities Swing Wildly | Greg Schnell, CMT | Market Buzz (03.16.22) – YouTube
Note Greg’s favourable comment on natural gas.
Seasonality Chart of the Day
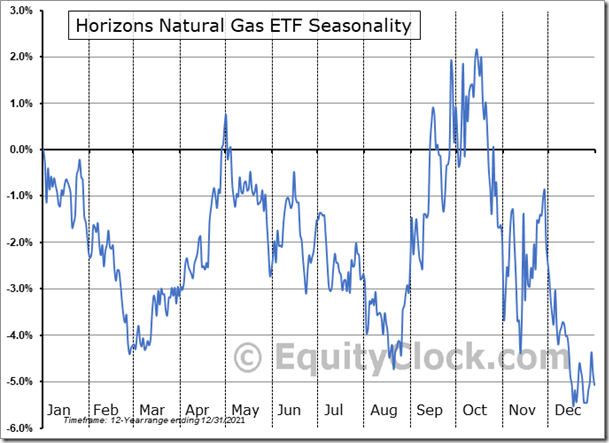
Natural gas futures/ETNs have a history of moving higher from March 1st to at least the end of April and frequently to May 24th
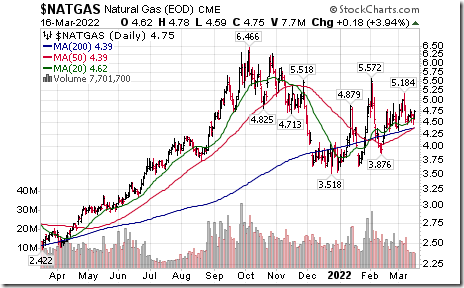
Technicals for natural gas are improving. Intermediate trend is up. Strength relative to the S&P 500 and TSX Composite is positive. Units trade above their 20, 50 and 200 day moving averages. Short term momentum indicators (Stochastics, RSI, MACD) are trending higher.
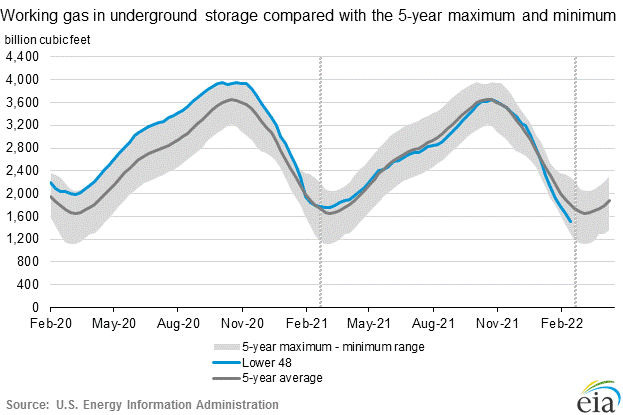
Natural gas inventories in the U.S. are at a five year low. Weather forecast for the U.S. mainland into May is for lower-than-average temperatures triggered partially by spread of a plume of ash and gases emitted from a volcano that recently erupted in the South Pacific. Watch closely to the weekly natural gas storage report to be released later this morning for additional news on inventories.
S&P 500 Momentum Barometers
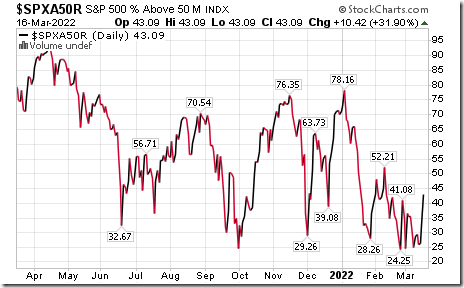
The intermediate term Barometer jumped 10.42 to 43.09 yesterday. It changed from Oversold to Neutral on a recovery above 40.00.
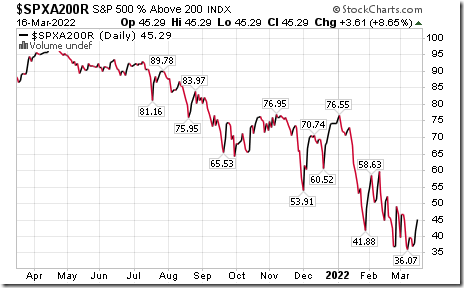
The long term Barometer gained 3.61 to 45.29 yesterday. It remains Neutral.
TSX Momentum Barometers
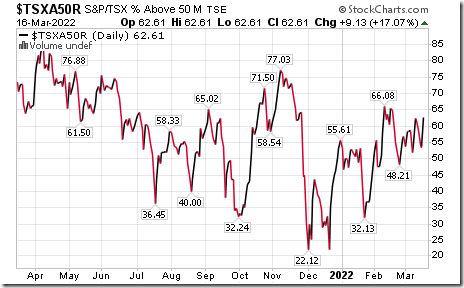
The intermediate term Barometer jumped 9.13 to 62.61 yesterday. It changed from Neutral to Overbought on a move above 60.00.
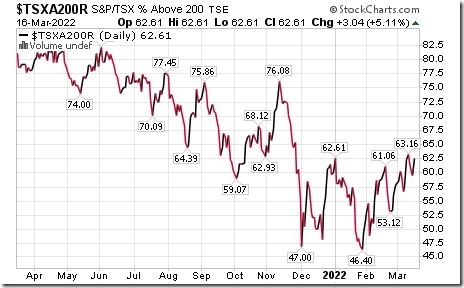
The long term Barometer added 3.04 to 62.61 yesterday yesterday. It changed from Neutral to Overbought on a return above 60.00.
Disclaimer: Seasonality and technical ratings offered in this report and at
www.equityclock.com are for information only. They should not be considered as advice to purchase or to sell mentioned securities. Data offered in this report is believed to be accurate, but is not guaranteed.
This post was originally publised at Vialoux's Tech Talk.


