by John Lynch, Chief Investment Officer, Comerica Wealth Management
Executive Summary
The Federal Reserve’s meeting this week is expected to represent its formal pivot to tightening financial conditions in the U.S.
· William McChesney Martin, Fed Chair in the 1950s, famously and colorfully suggested that the central bank’s job is “to take away the punch bowl just as the party gets going.”
· The Fed has clearly telegraphed its intent to raise the fed funds rate 25 bps at this week’s meeting and communicated that balance sheet reduction (aka Quantitative Tightening or QT) should begin by mid-year.
Fed Funds Expectations
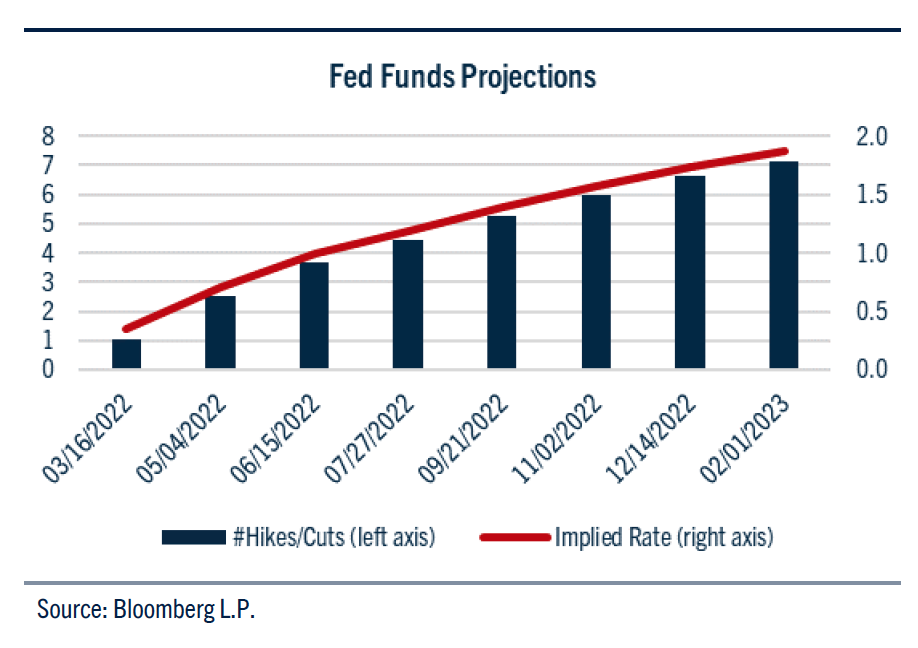
· The fed funds futures market projects cumulative rate hikes of 165 bps, which equates to somewhere between six and seven 25 bp hikes.
· It is said that the cure for inflation is inflation; high inflation might be mitigated by slower growth, leading the Fed towards a shorter, shallower hiking cycle.
Fed Balance Sheet
· There have been no clear plans from the Fed about shrinking its balance sheet – either in terms of a starting date or amount.
· We have used an assumption of $30 billion per month beginning in May that rises to $75 billion by September and continues at that level through 2025, when the Fed’s balance sheet would still total around $6.4 Trillion.
Special thanks to Chris Nicholl, Senior Fixed Income Portfolio Manager, for his contribution to this edition of Weekly Market Update.
Removing The Punchbowl
The Federal Reserve’s meeting this week is expected to represent its formal pivot to tightening financial conditions in the U.S. The hope and expectation last year that inflation would be short-lived, and that repair of supply chains would bring inflation back under control, have been proven wrong. The latest releases show the U.S at decades-high levels of year- over-year inflation: 9.7% producer prices and 7.9% at the consumer level. Chair Powell acknowledged as much in his Congressional testimony last week and was clear in his assessment that the war in Ukraine will add to inflation woes: “Commodity prices have moved up — energy prices, in particular. That’s going to work its way through the U.S. economy. We’re going to see upward pressure on inflation, at least for a while.”
Fed Chair in the 1950’s, William McChesney Martin famously and colorfully suggested that the Fed’s job is “to take away the punch bowl just as the party gets going.” Given the inflation readings over the last several months and the fact that the Fed, as of this month, has still been growing its balance sheet, many investors feel like the Fed waited until the punchbowl was empty before removing it – and may have even refilled it beforehand. Despite those assessments, all of that changes this month. The Fed has clearly telegraphed its intent to raise the fed funds rate 25 bps at this week’s meeting and communicated that balance sheet reduction (aka Quantitative Tightening or QT) should begin by mid-year. The remaining uncertainty, then, revolves around the number/timing of rate hikes, and the pace of QT – and we will take a look at both.
Fed Funds Expectations
Changes to the fed funds rate remain the Fed’s most powerful policy tool – and investors are expecting the Fed to wield it frequently this year. The fed funds futures market projects cumulative rate hikes of 165 bps. This equates to somewhere between six and seven 25-bp hikes, although the Fed may decide to hike 50 bps at some meeting(s) during the year if conditions warrant. Chair Powell indicated the first hike next week would be only 25 bps. See Chart: Fed Funds Projections.
The number and duration of hikes will, of course, depend upon what unfolds in the economy in the coming quarters. It is said that the cure for inflation is inflation. In other words, a market-based economy tends to find alternative goods and products and/or experience a decrease in demand due to rising prices – a natural corrective mechanism to bring inflation back to more normal ranges. The degree of this slackening in demand will heavily influence the Fed’s posture towards rate hikes. If today’s robust employment and strong consumer balance sheets continue to fuel strong growth in the coming quarters, the Fed is likely to pursue a more prolonged hiking cycle. In this case, the current fed funds projections of 1.75% by year-end and 2.2-2.50% by year-end 2023 would be reasonable. However, there are signs that growth has already begun to slow: for example, much of the robust 7% Q4 2022 GDP growth is attributable to inventory growth rather than final sales. Compounding this is concerns about recession in Europe, which is more exposed to the war in Ukraine than the US is directly. If European growth slows, US export growth will suffer – exacerbating the slow-growth dynamic. In that case, high inflation might be mitigated by slower growth, leading the Fed towards a shorter, shallower hiking cycle.
Fed Balance Sheet
There have been no clear plans from the Fed about shrinking its balance sheet – either in terms of a starting date or amount. The last time the Fed shrank its balance sheet beginning in 2018, it began at a monthly pace of $10 billion and peaked at $50 billion. Most Fed watchers expect a quicker pace this time around.
The Fed will not sell bonds directly into the market. Instead, the amount of balance sheet reduction should be viewed as a cap – subject to whether there are enough maturities in any given month to allow that amount of roll off. Some months will see more bonds maturing than the cap, in which case the Fed will reinvest the excess back in the bond market – the standing assumption is that the Fed will choose to support the 10-year part of the yield curve. In other months, maturities will be insufficient to allow the full cap reduction; in those months, the balance sheet will shrink by less than the cap. To illustrate this dynamic, we have used an assumption of $30 billion per month beginning in May that rises to $75 billion by September and continues at that level. See Chart: Federal Reserve Maturity Schedule by Month
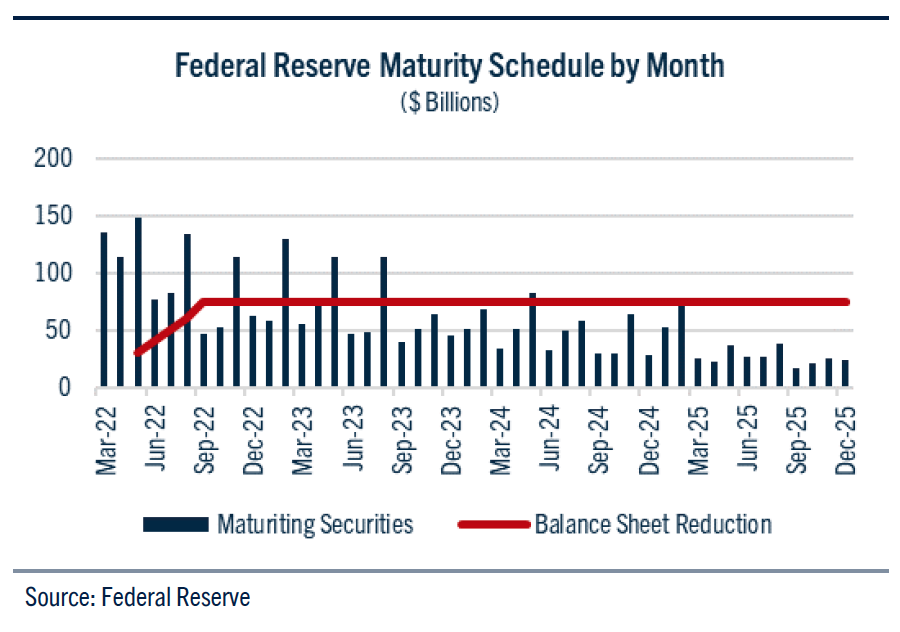
This results in a slower pace of balance sheet runoff than simply multiplying the monthly cap amount by the number of months, since some months will see a reduction of something less than the cap amount. Under these conditions, the Fed’s balance sheet remains elevated even by the end of 2025 – when it would still total around $6.4 trillion. See Chart: Federal Reserve Balance Sheet.

There are, of course, alternative methods of shrinking the balance sheet. The Fed could choose, for example, to reinvest monthly excess maturities for only a few months (rather than supporting the 10-year part of the Treasury curve) so that it would have more bonds maturing in those months where maturities are less than the cap. The Fed could also increase the monthly cap although, as seen in Chart 2, that may not help since many months have fewer maturities than the cap amount. More likely is that we will be living with an elevated Fed balance sheet for longer than just three years. Be Well and Stay Safe!