by Don Vialoux, EquityClock.com
The Bottom Line
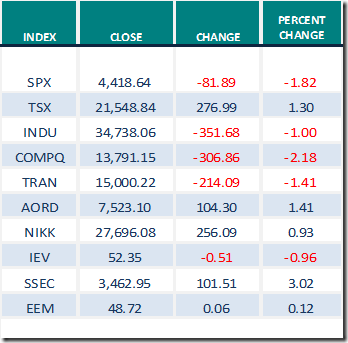
U.S. and European equity markets moved significantly lower last week in anticipation of two events:
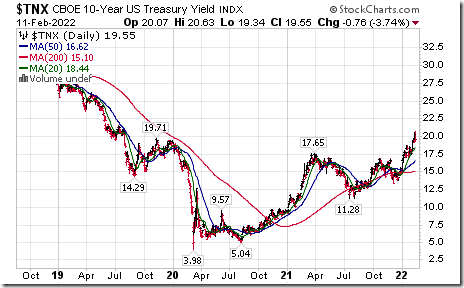
- Anticipation of tightening U.S. monetary policy that triggered strength in U.S. Treasury Bond yields (Yield on 10 year Treasuries advanced to a three year high)
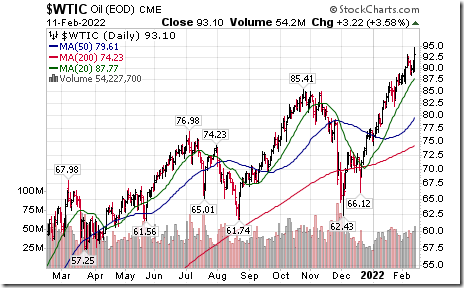
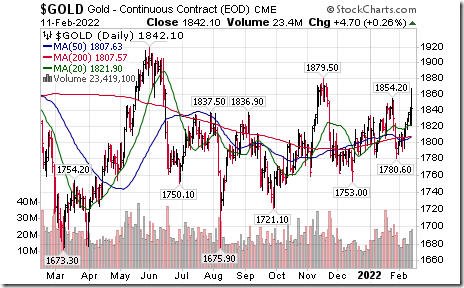
- Anticipated of an imminent invasion of Ukraine by Russia that raised international political uncertainty triggering strength in crude oil and gold prices.
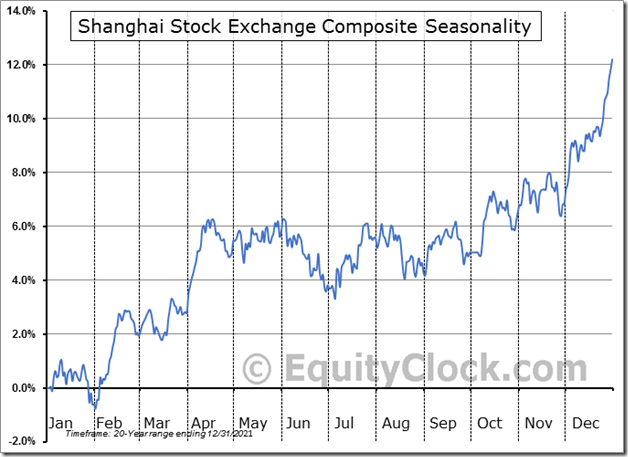
Other equity markets, notably Emerging Markets, Far East markets and the TSX Composite Index recorded gains. Most impressive was the 3% gain by the Shanghai Composite Index. ‘Tis the season for Chinese equity prices to move higher from Chinese New Year until mid-April!
Observations
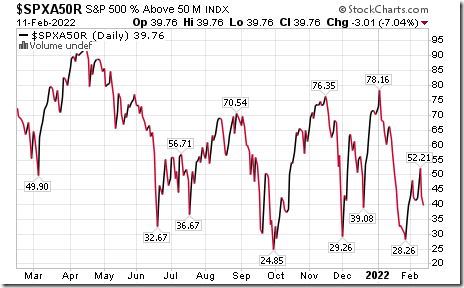
Intermediate term technical indicator for U.S. equity markets (Percent of S&P 500 stocks trading above their 50 day moving average) changed from Neutral to Oversold last week. Trend is down. See Momentum Barometer chart at the end of this report.
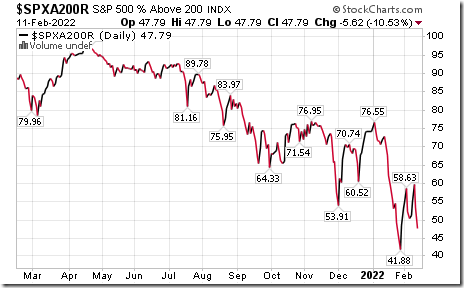
Long term technical indicator for U.S. equity markets (Percent of S&P 500 stocks trading above their 200 day moving average) remained Neutral last week. Trend is down. See Momentum Barometer chart at the end of this report.
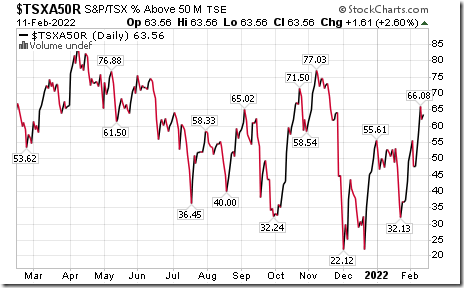
Intermediate term technical indicator for Canadian equity markets changed from Neutral to Overbought last week. Trend is up. See Momentum Barometer chart at the end of this report.
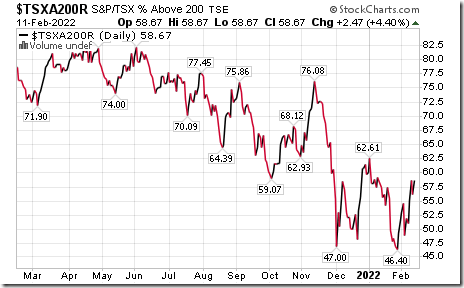
Long term technical indicator for Canadian equity markets (Percent of TSX stocks trading above their 200 day moving average) remained Neutral last week. Trend is up. See Momentum Barometer chart at the end of this report.
Consensus earnings and revenue estimates on a year-over-year basis for S&P 500 companies for the fourth quarter of 2021 continued to increase. According to www.FactSet.com projected earnings on a year-over-year basis in the fourth quarter have increased to 29.2% versus a gain of 24.3% reported last week. Revenues are projected to increase 15.0% versus a gain of 13.9 last week.
Consensus earnings estimates for S&P 500 companies on a year-over-year basis in the first half of 2022 and all of 2022 were little changed. According to www.FactSet.com first quarter earnings on a year-over-year basis are expected to increase 5.6% and revenues are expected to increase 10.2%. Second quarter earnings are expected to increase 4.4% (up from 4.3% last week). Earnings on a year-over-year basis for all of 2022 are expected to increase 8.6% and revenues are expected to increase 8.0%.
Economic News This Week
Canadian January Housing Starts to be released at 8:15 AM EST on Tuesday is expected to increase to 270,000 units from 236,100 in December.
January Producer Price Index to be released at 8:30 AM EST on Tuesday is expected to increase 0.4% versus a gain of 0.2% in December. On a year-over-year basis January PPI is expected to increase 9.8% versus a gain of 9.7% in December. Excluding food and energy January PPI is expected to increase 0.4% versus a gain of 0.5% in December. On a year-over-year basis, January PPI is expected to increase 8.0% versus a gain of 8.3% in December.
February Empire State Manufacturing Survey to be released at 8:30 AM EST on Tuesday is expected to increase to 25.00 versus a decline of 0.70 in January.
January Retail Sales to be released at 8:30 AM EST on Wednesday is expected to increase 1.7% versus a drop of 1.9% in December. Excluding auto sales, January Retail Sales are expected to increase 0.4% versus a decline of 2.3% in December.
Canadian January Consumer Price Index to be released at 8:30 AM EST on Wednesday is expected to decline 0.1% versus a decline of 0.1% in December.
January Capacity Utilization to be released at 9:15 AM EST on Wednesday is expected to improve to 76.7% from 76.5% in December. January Industrial Production is expected to increase 0.4% versus a decline of 0.1% in December.
December Business Inventories to be released at 10:00 AM EST on Wednesday are expected to increase 1.8% versus a gain of1.3% in November.
January Housing Starts to be released at 8:30 AM EST on Thursday are expected to slip to 1,700,000 units from 1,702,000 units in December
February Philly Fed Index to be released at 8:30 AM EST on Thursday is expected to slip to 20.0 from 23.2 in January.
Canadian December Retail Sales to be released at 8:30 AM EST on Friday are expected to increase 1.2% versus a gain of 1.1% in November. Excluding auto sales, December Retail Sales are expected to increase 1.3% versus a gain of 1.1% in November.
January Existing Home Sales to be released at 10:00 AM EST on Friday are expected to slip to 6.10 million units from 6.18 million units in December.
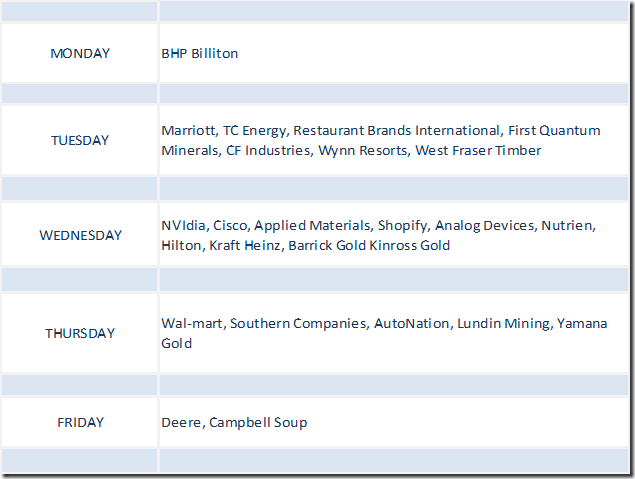
Selected Earnings News This Week
Trader’s Corner
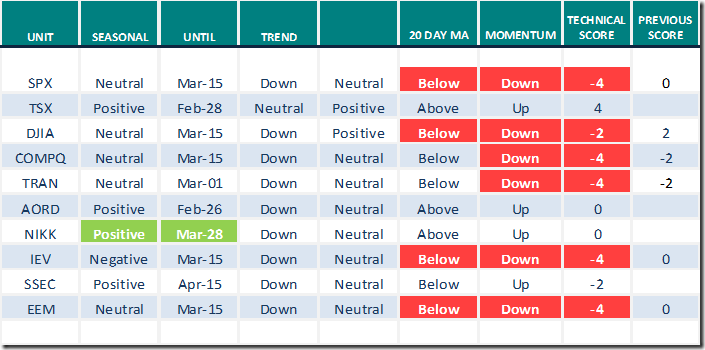
Equity Indices and Related ETFs
Daily Seasonal/Technical Equity Trends for Feb.11th 2022
Green: Increase from previous day
Red: Decrease from previous day
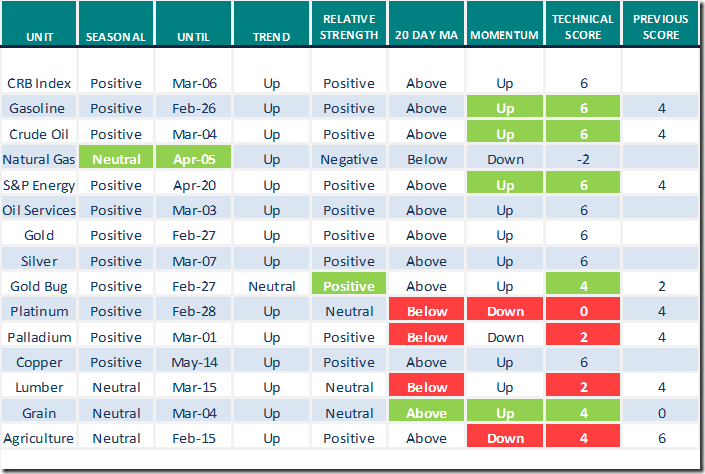
Commodities
Daily Seasonal/Technical Commodities Trends for Feb.11th 2022
Green: Increase from previous day
Red: Decrease from previous day
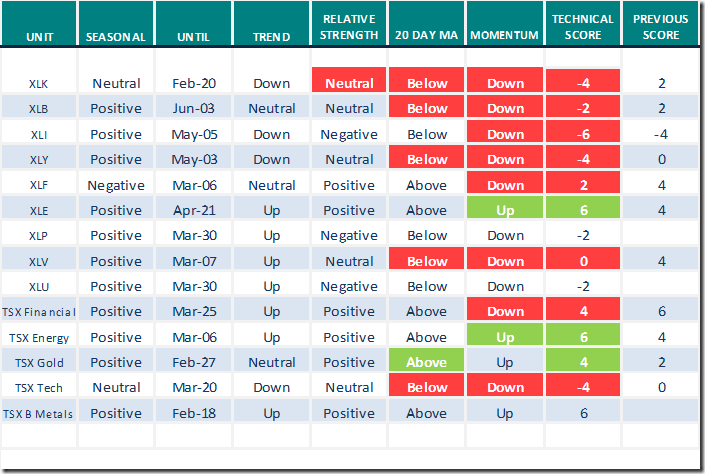
Sectors
Daily Seasonal/Technical Sector Trends for Feb.11th 2021
Green: Increase from previous day
Red: Decrease from previous day
All seasonality ratings are based on performance relative to the S&P 500 Index (except TSX)
Links from valued providers
Mark Leibovit discusses “Inflation, interest rates, gold and real estate”
Inflation, Interest Rates, Gold, Real Estate – HoweStreet
Arthur Hill from www.StockCharts.com notes that “Metals and Mining SPDR (XME) go for relative and absolute breakouts”
Metals & Mining SPDR Goes for Relative and Absolute Breakouts | Art’s Charts | StockCharts.com
Links from Mark Bunting and www.uncommonsenseinvestor.com
Magic Returns to Disney with 40% Upside – Uncommon Sense Investor
Three Sectors to Favour in This New Market Reality – Uncommon Sense Investor
Michael Campbell’s Money Talks for February 12th
February 12th Episode (mikesmoneytalks.ca)
In 2005 Steve Jobs gave the speech that will never be forgotten.
https://www.youtube.com/watch?v=5Yhf0wBFtvY
David Keller from www.stockcharts.com notes that the “S&P 500 breaks the 200 day moving average”
https://www.youtube.com/watch?v=11SPVRJtmIs
Technical Scoop from David Chapman and www.EnrichedInvesting.com
To be added
Technical Scores
Calculated as follows:
Intermediate Uptrend based on at least 20 trading days: Score 2
(Higher highs and higher lows)
Intermediate Neutral trend: Score 0
(Not up or down)
Intermediate Downtrend: Score -2
(Lower highs and lower lows)
Outperformance relative to the S&P 500 Index: Score: 2
Neutral Performance relative to the S&P 500 Index: 0
Underperformance relative to the S&P 500 Index: Score –2
Above 20 day moving average: Score 1
At 20 day moving average: Score: 0
Below 20 day moving average: –1
Up trending momentum indicators (Daily Stochastics, RSI and MACD): 1
Mixed momentum indicators: 0
Down trending momentum indicators: –1
Technical scores range from -6 to +6. Technical buy signals based on the above guidelines start when a security advances to at least 0.0, but preferably 2.0 or higher. Technical sell/short signals start when a security descends to 0, but preferably -2.0 or lower.
Long positions require maintaining a technical score of -2.0 or higher. Conversely, a short position requires maintaining a technical score of +2.0 or lower
Changes Last Week
Technical Notes released on Friday at
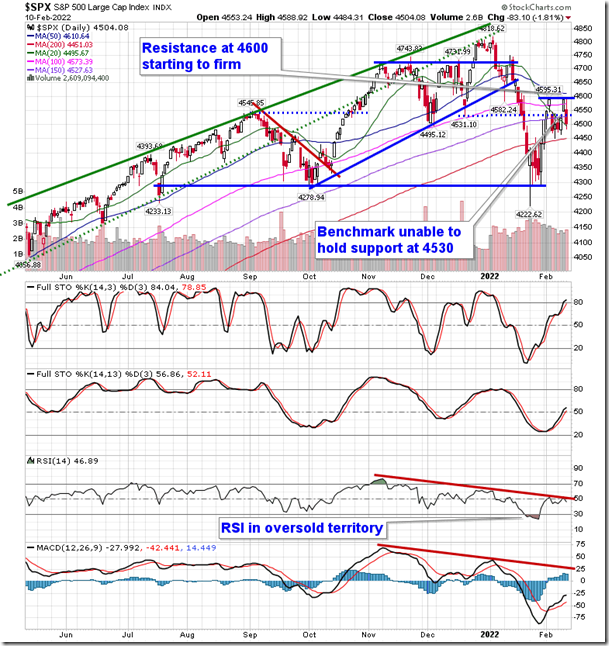
A market that is more willing to respect levels of resistance and ignore levels of support warrants caution. equityclock.com/2022/02/10/… $SPX $SPY $ES_F $STUDY
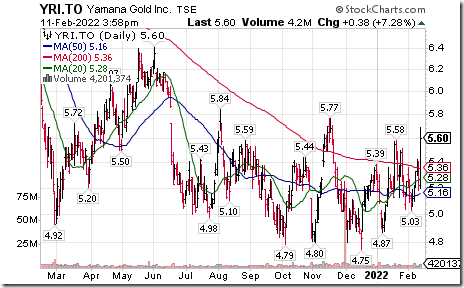
Gold equities and related ETFs are responding to increasing concerns about a Russian invasion of Ukraine. Yamana $YRI.CA a TSX 60 stock moved above Cdn$5.58 extending an intermediate uptrend.
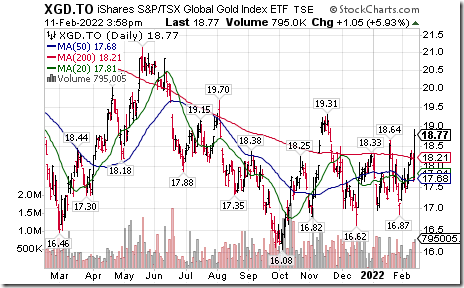
Cdn. Gold Equity iShares $XGD.CA moved above $18.64 resuming an intermediate uptrend.
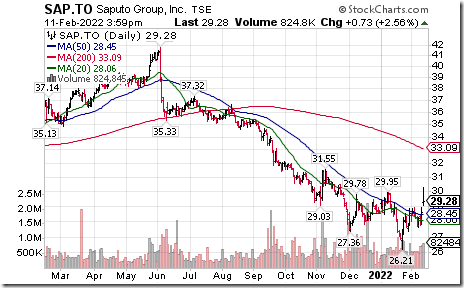
Saputo $SAP.CA a TSX 60 stock moved above intermediate resistance at $29.95. Seasonal influences are favourable into April. If a subscriber to EquityClock, see seasonality chart at
https://charts.equityclock.com/saputo-inc-tsesap-seasonal-chart
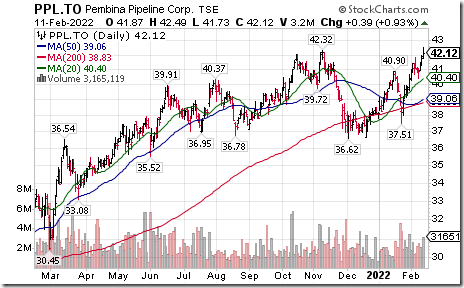
Pembina Pipeline $PPL.CA a TSX 60 stock moved above $42.32 extending an intermediate uptrend.
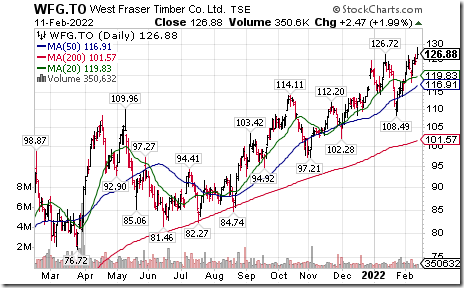
Good technical action in forest product stocks and related ETFs: $WOOD $CUT West Fraser Timber $WFG.CA moved above Cdn$126.72 to an all-time high extending an intermediate uptrend.
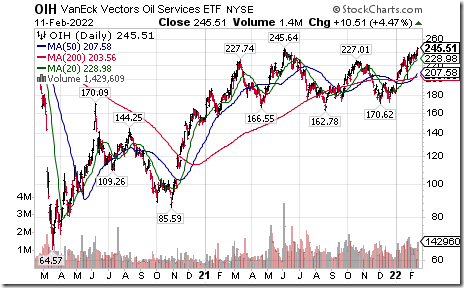
Oil Services ETF $OIH moved above $245.64 extending an intermediate uptrend.
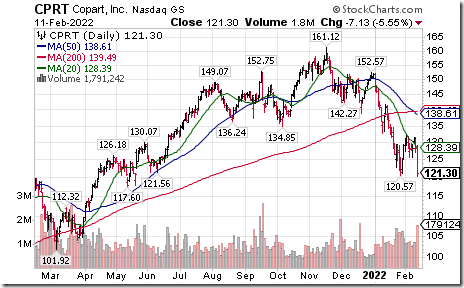
Copart $CPRT a NASDAQ 100 stock moved below $120.57 extending an intermediate downtrend.
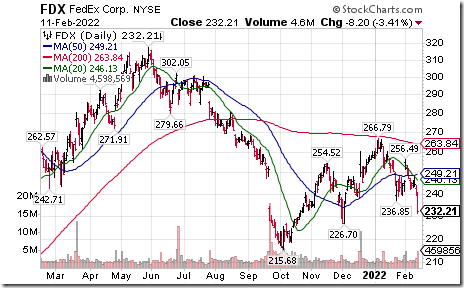
FedEx $FDX an S&P 100 stock moved below $236.85 setting an intermediate downtrend.
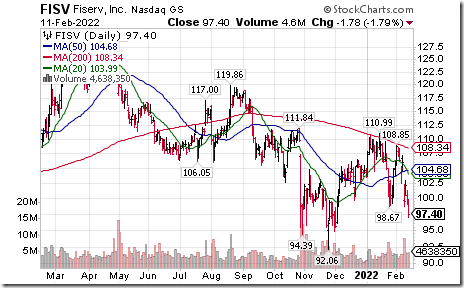
Fiserv $FISV a NASDAQ 100 stock moved below $98.67 setting an intermediate downtrend.
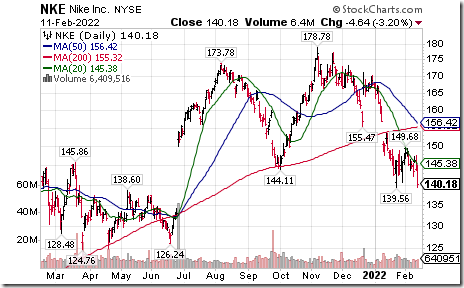
Nike $NKE a Dow Jones Industrial Average stock moved below $139.56 extending an intermediate downtrend.
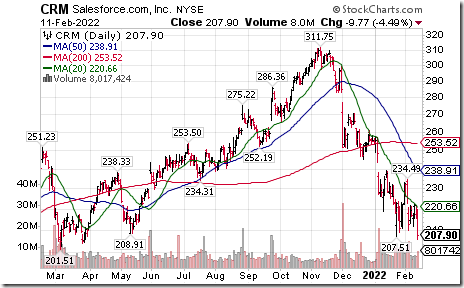
Salesforce $CRM a Dow Jones Industrial Average stock moved below $207.51 extending an intermediate downtrend.
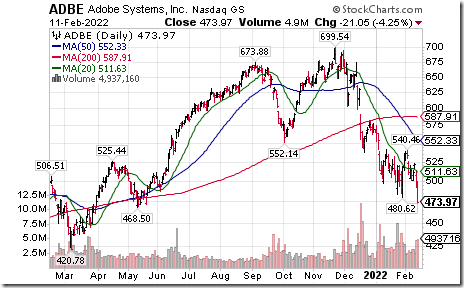
Adobe $ADBE a NASDAQ 100 stock moved below $480.62 extending an intermediate downtrend.
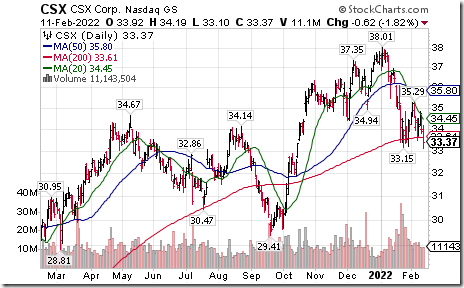
CSX $CSX a NASDAQ 100 stock moved below $33.15 extending an intermediate downtrend.
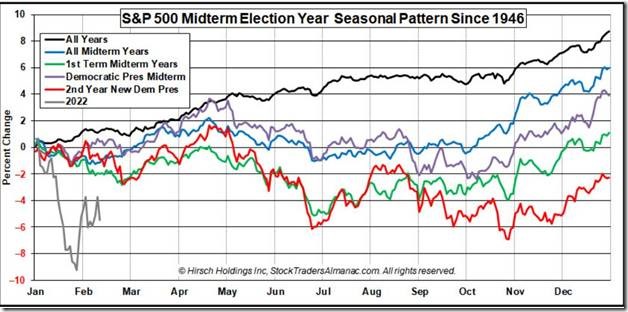
S&P 500 Seasonality in the second year of a new Democrat Party President
Chart available at www.StockTradersAlmanac.com supports our outlook comments offered on February 7th edition of www.tiimingthemarket.ca assuming the S&P 500 follows its historic pattern. Note the red line. The outlook prediction includes a shallow recovery between now and mid-April followed by a significant decline to the end of June and eventually a recovery in the fourth quarter.
S&P 500 Momentum Barometers
The intermediate term Barometer dropped 3.01 on Friday and 1.61 last week to 39.76. It changed from Neutral to Oversold on a move below 40.00. Trend is down.
The long term Barometer dropped 5.62 on Friday and 2.61 last week to 47.79. It remains Neutral. Trend is down.
TSX Momentum Barometers
The intermediate term Barometer added 1.61 on Friday and 15.98 last week to 63.56. It changed from Neutral to Overbought on a move above 60.00. Trend is up.
The long term Barometer added 2.47 on Friday and 6.69 last week to 58.67. It remains Neutral. Trend is up.
Disclaimer: Seasonality and technical ratings offered in this report and at
www.equityclock.com are for information only. They should not be considered as advice to purchase or to sell mentioned securities. Data offered in this report is believed to be accurate, but is not guaranteed
This post was originally publised at Vialoux's Tech Talk.


