by Don Vialoux, EquityClock.com
The Bottom Line
U.S. equity markets continue to follow closely (directional, but not magnitude) the four year U.S. Presidential cycle after election of a new President: He normally runs into a “political wall” against his agenda. Weakness in the month of January in the second year followed by a shallow recovery to mid-April followed by a significant downside move to the end of June followed by a recovery to the end of the year to new all-time highs. Historically, U.S. equity indices reach a bottom at the end of June in the second year of the four year Presidential cycle after a new President is elected.
Events this year that are expected to help history repeat:
- Stronger than expected fourth quarter revenues and earnings reported by S&P 500 companies followed by proverbially encouraging comments by CEOs at annual meeting held during the next few weeks: Chief Executive Officers will focus their forecast on revenue and earnings recoveries in anticipation of a decline in COVID 19 infections. CEOs also will discuss potential revenue and earnings growth from government spending programs funded by the recently passed $1.1 trillion Infrastructure Bill.
- Early signs that the Federal Reserve will end its tapered debt buyback program on schedule by the end of March. Decisions by the Federal Reserve are data driven: Focus is on inflation rates (the higher than expected Average Hourly Earnings increase at a 7.2% annual rate announced on Friday did not help), extended supply constraint issues complicated by COVID 19 infection rates (remaining high, but showing early signs of a peak) and additional inflationary fiscal spending plans such as the Build Back Better plan currently valued at $1.7 billion (requires final Congressional approval by the Senate that at best is expected to be delayed following a stroke last week by a Democrat Senator who holds the crucial 50th vote needed for a majority in the Senate). Trend based on available data is that the Federal Reserve will maintain current monetary policy at its next meeting on March 16th pending updated news, but also will signal start of steps to slow monetary expansion at its next meeting on May 4th to include raising the Fed Fund Rate from its current 0.00%-0.25% rate.
- Anticipation of a change in control by Congress from Democrats to Republicans during the November mid-term elections. Democrats currently have control of the House of Representatives with a 12 seat majority. Historically, the ruling party loses at least 20 seats during a mid-term election after a new President has been elected implying anticipation of a shift in control from Democrats to Republicans in November. This year, funding through higher taxation to pay for Biden’s fiscal agenda becomes problematic. Ditto for the Senate! Voting in the Senate currently is tied with 50 Democrats and 50 Republicans with control held by the Democrats with a tie breaker vote held by the Vice President. Anticipation of a new political agenda with a return to Republic control in the Senate and/or the House of Representatives will be sufficient to stage a significant recovery by U.S. equity markets in the second half of 2022.
Investment opportunities are available elsewhere. Volatility in U.S. equity markets is expected to remain higher than usual until at least mid-2022 because of expected political and economic events. Investments in equity markets outside of the U.S. are a good alternative including Far East and Latin American equity markets and related ETFs.
Observations
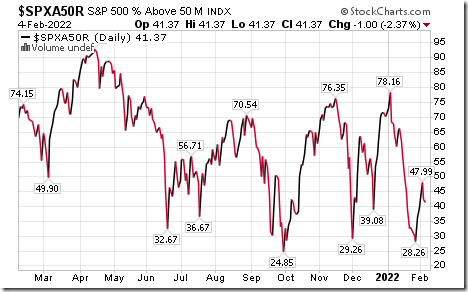
Intermediate term technical indicator for U.S. equity markets (Percent of S&P 500 stocks trading above their 50 day moving average) changed from Oversold to Neutral last week. See Momentum Barometer chart at the end of this report.
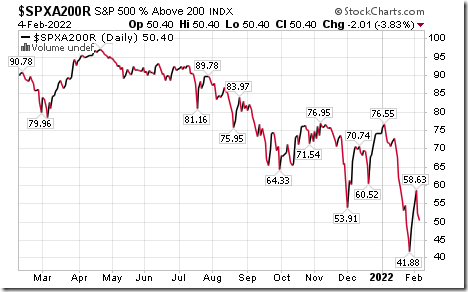
Long term technical indicator for U.S. equity markets (Percent of S&P 500 stocks trading above their 200 day moving average) remained Neutral last week. See Momentum Barometer chart at the end of this report.
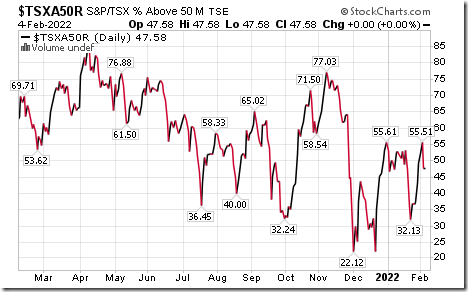
Intermediate term technical indicator for Canadian equity markets remained Neutral last week. See Momentum Barometer chart at the end of this report.
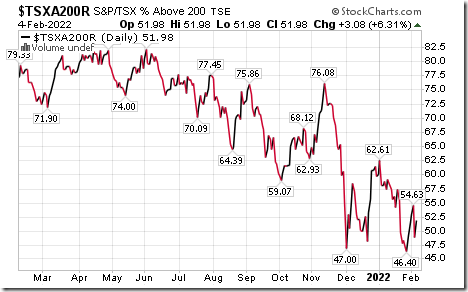
Long term technical indicator for Canadian equity markets (Percent of TSX stocks trading above their 200 day moving average) remained Neutral last week. See Momentum Barometer chart at the end of this report.
Consensus earnings and revenue estimates on a year-over-year basis for S&P 500 companies for the fourth quarter of 2021 continued to increase. According to www.FactSet.com projected earnings on a year-over-year basis in the fourth quarter have increased to 29.2% versus a gain of 24.3% reported last week. Revenues are projected to increase 15.0% versus a gain of 13.9 last week.
Consensus earnings estimates for S&P 500 companies on a year-over-year basis in the first half of 2022 and all of 2022 were little changed. According to www.FactSet.com first quarter earnings on a year-over-year basis are expected to increase 5.6% and revenues are expected to increase 10.2%. Second quarter earnings are expected to increase 4.4% (up from 4.3% last week). Earnings on a year-over-year basis for all of 2022 are expected to increase 8.6% and revenues are expected to increase 8.0%.
Economic News This Week
January U.S. Trade Deficit to be released at 8:30 AM EST on Tuesday is expected to increase to $82.90 billion from $80.20 in December.
January Canadian Merchandise Trade Balance to be released at 8:30 AM EST on Tuesday is expected to slip to $2.03 billion from $3.13 billion in December.
U.S. January Consumer Price Index to be released at 8:30 AM EST on Thursday is expected to increase 0.4% versus a gain of 0.5% in December. On a year-over-year basis, January CPI is expected to increase 7.2% versus a gain of 7.0% in December. Excluding food and energy, January Consumer Price Index is expected to increase 0.5% versus a gain of 0.6% in December.
February Michigan Sentiment to be released at 10:00 AM EST on Friday is expected to increase to 67.6 from 67.2 in January.
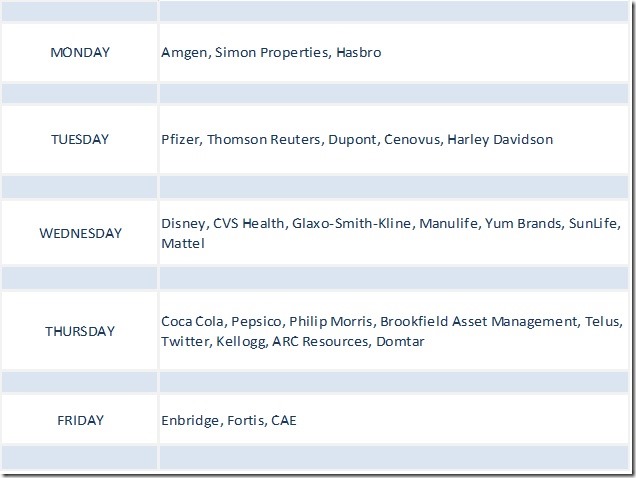
Selected Earnings News This Week
Frequency of quarterly revenue and earnings reports by S&P 500 companies past their peak last week: 56% of reporting companies have released results to date with 76% reporting higher than consensus quarterly earnings and 77% reporting higher than consensus revenues.
Frequency of Canadian quarterly reports ramps up this week.
Trader’s Corner
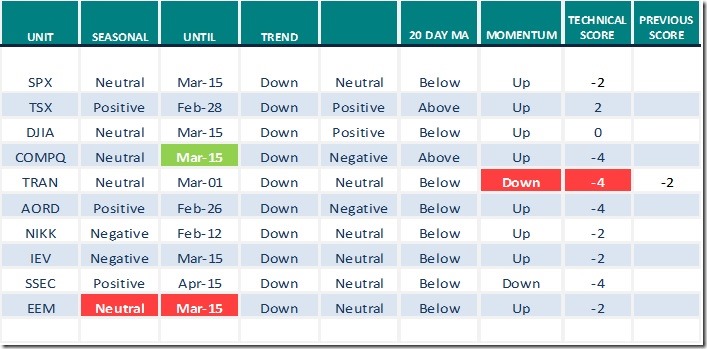
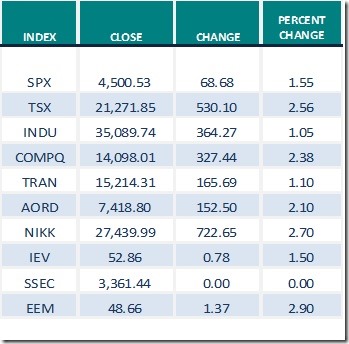
Equity Indices and Related ETFs
Daily Seasonal/Technical Equity Trends for Feb.4th 2022
Green: Increase from previous day
Red: Decrease from previous day
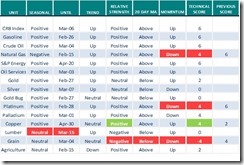
Commodities
Daily Seasonal/Technical Commodities Trends for Feb.4th 2022
Green: Increase from previous day
Red: Decrease from previous day
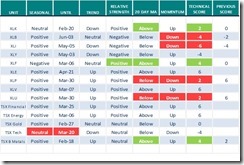
Sectors
Daily Seasonal/Technical Sector Trends for Feb.4th 2021
Green: Increase from previous day
Red: Decrease from previous day
All seasonality ratings are based on performance relative to the S&P 500 Index (except TSX)
Technical Scores
Calculated as follows:
Intermediate Uptrend based on at least 20 trading days: Score 2
(Higher highs and higher lows)
Intermediate Neutral trend: Score 0
(Not up or down)
Intermediate Downtrend: Score -2
(Lower highs and lower lows)
Outperformance relative to the S&P 500 Index: Score: 2
Neutral Performance relative to the S&P 500 Index: 0
Underperformance relative to the S&P 500 Index: Score –2
Above 20 day moving average: Score 1
At 20 day moving average: Score: 0
Below 20 day moving average: –1
Up trending momentum indicators (Daily Stochastics, RSI and MACD): 1
Mixed momentum indicators: 0
Down trending momentum indicators: –1
Technical scores range from -6 to +6. Technical buy signals based on the above guidelines start when a security advances to at least 0.0, but preferably 2.0 or higher. Technical sell/short signals start when a security descends to 0, but preferably -2.0 or lower.
Long positions require maintaining a technical score of -2.0 or higher. Conversely, a short position requires maintaining a technical score of +2.0 or lower
Changes Last Week
Technical Notes released on Friday at
US Dollar Index continues to consolidate above support at 95, but it is the market’s reaction to the payroll report on Friday that will be telling of whether the longer-term rising trend will hold. equityclock.com/2022/02/03/… $USDX $UUP #USDOLLAR
US Non-Farm Payrolls decline by 2.1% (NSA), on average, in the first month of the year. If seasonal norms hold true, this would imply the actual elimination of 3.154 payrolls in January. $STUDY $MACRO #NFP
Employment in Canada dropped by 484,900, or 2.5% (NSA), in January, much weaker than the 1.5% decline that has been average of the first month of the year over the past two decades. $STUDY $MACRO #CDNecon #CAD $EWC
Once again, the seasonal adjustment factor is providing a skewed look at the state of the economy. January nonfarm payrolls actually fell by 2.824 million (NSA), or 1.9%, but this is stronger than the 2.1% decline that is average for the first month of the year. $STUDY $MACRO #Economy #Employment #NFP
Encouraging signs that Chinese equities will open strongly higher after the Chinese New Year holiday!. Hong Kong iShares advanced 3.24% on Friday. Seasonal influences for the Shanghai Composite Index turn strongly positive just after the Chinese New Year for a seasonal trade lasting until mid-April. If a subscriber to EqutiyClock, see seasonality chart on the Shanghai Composite at https://charts.equityclock.com/sse-composite-index-seasonal-chart
U.S. Oil & Gas Exploration SPDRs $XOP moved above $112.95 on higher crude oil prices extending an intermediate uptrend.
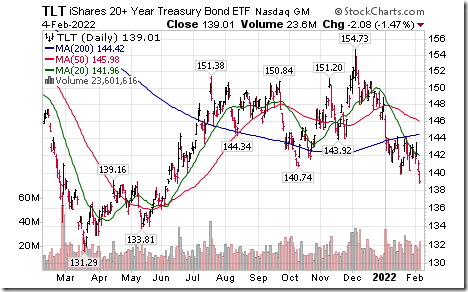
Long term U.S. Treasury Bond iShares $TLT moved below $140.74 and $139.83 extending an intermediate downtrend.
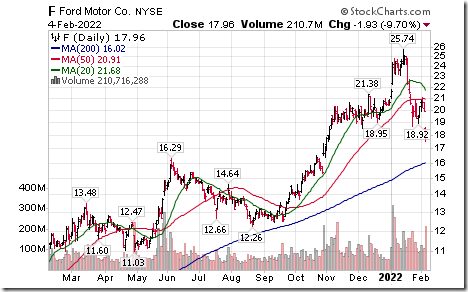
Ford $F an S&P 100 stock moved below $18.95 and $18.92 completing a Head & Shoulders pattern. The company reported less than consensus fourth quarter results.
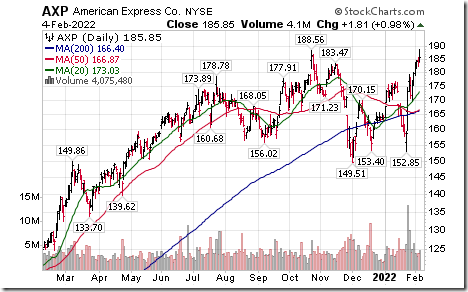
American Express $AXP a Dow Jones Industrial Average stock moved above $188.56 to an all-time high extending an intermediate uptrend. Seasonal influences are favourable to at least early May. If a subscriber to EquityClock, see seasonality chart at https://charts.equityclock.com/american-express-company-nyseaxp-seasonal-chart
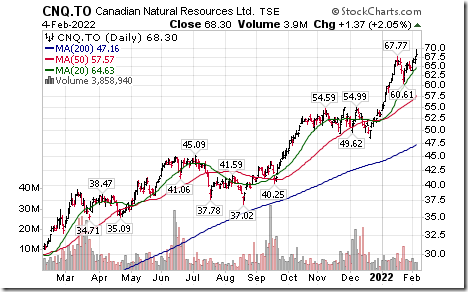
Canadian Natural Resources $CNQ.CA a TSX 60 stock responded to higher Canadian crude oil prices moved above $CNQ.CA Cdn$67.77 extending an intermediate uptrend. Seasonal influences are favourable until at least early March and frequently to the end of June. If an EquityClock subscriber, see seasonality chart at https://charts.equityclock.com/canadian-natural-resources-limited-tsecnq-seasonal-chart
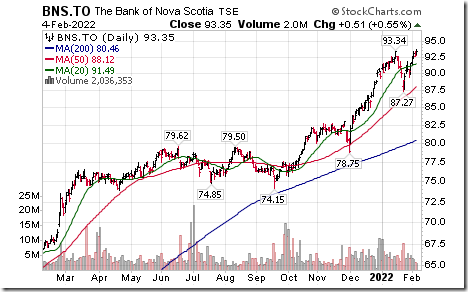
Bank of Nova Scotia $BNS.CA a TSX 60 stock moved above Cdn$93.34 to an all-time high extending an intermediate uptrend. Seasonal influences are favourable to the end of March. If a subscriber to EquityClock, see seasonality chart at https://charts.equityclock.com/the-bank-of-nova-scotia-tsebns-seasonal-chart
Open Text $OTEX a TSX 60 stock moved below US$44.46 after reporting lower than consensus quarterly earnings extending an intermediate downtrend.
Links offered by valued providers
Mark Leibovit weekly comment on www.HoweStreet.com
Groundhog Day Effect, High Tech Stocks, Gold. Mark Leibovit – Feb. 3, 2022 – YouTube
Comments from Mark Bunting and www.uncommonsenseinvestor.com
Webinar and Newsletter Sign Up – Uncommon Sense Investor
America’s Best Mid-Sized Companies – Uncommon Sense Investor
What is Investing’s Golden Rule Telling Us? – Uncommon Sense Investor
Why Amazon’s Investments Will Soon Start to Really Drive the Stock – Uncommon Sense Investor
Recession will be the big worry in 6 months: David Rosenberg | Financial Post
Eric Nuttall: Oil’s most bullish catalyst in modern history is coming | Financial Post
Michael Campbell’s Money Talks Podcast for February 5th
https://mikesmoneytalks.ca/february-5th-episode/?mc_cid=273408b5ef&mc_eid=592546b4b5
Technical Scoop from David Chapman and www.EnrichedInvesting.com
Next Cdn. Association for Technical Analysis (CATA) Meeting
Next virtual presentation is at 8:00 PM EST on Tuesday. Speaker is Matt Caruso. Registration is required. See: CATA Meeting Feb 8 with Matt Caruso – Events – Canadian Association for Technical Analysis (clubexpress.com)
S&P Momentum Barometers
The intermediate term Barometer slipped 1.00 on Friday, but gained 4.90 last week to 41.37. It changed from Oversold to Neutral on a recovery above 40.00.
The long term Barometer slipped 2.01 on Friday, but gained 1.90 last week to 50.40. It remains Neutral.
TSX Momentum Barometers
The intermediate term Barometer was unchanged on Friday, but added 4.53 last week to 47.58. It remains Neutral.
The long term Barometer added 3.08 on Friday and 2.65 last week to 51.98. It remains Neutral.
Disclaimer: Seasonality and technical ratings offered in this report and at
www.equityclock.com are for information only. They should not be considered as advice to purchase or to sell mentioned securities. Data offered in this report is believed to be accurate, but is not guaranteed
This post was originally publised at Vialoux's Tech Talk.


