by Don Vialoux, EquityClock.com
OOOPs
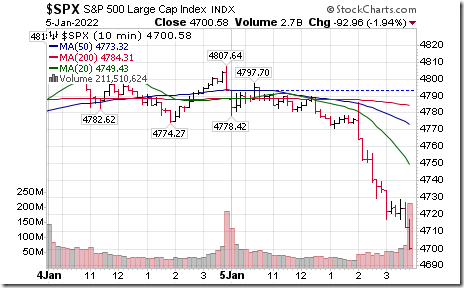
Minutes for the last FOMC meeting released at 2:00 PM EST yesterday had a surprising and significant negative impact on U.S. equity prices. The minutes implied that tapering of monetary stimulus could end sooner and faster than previously expected by Wall Street.
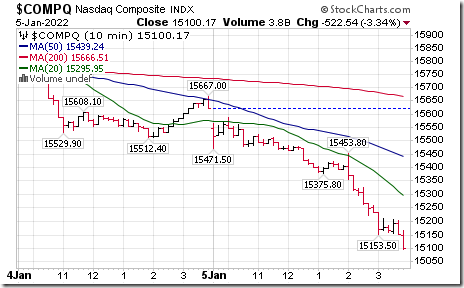
The NASDAQ Composite Index was particularly hard hit.
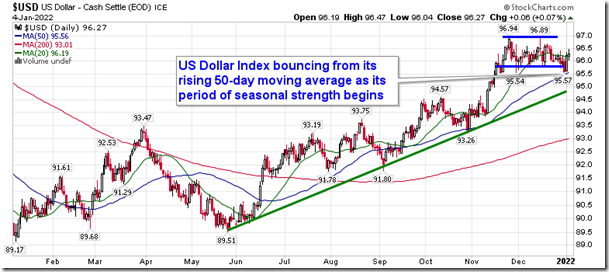
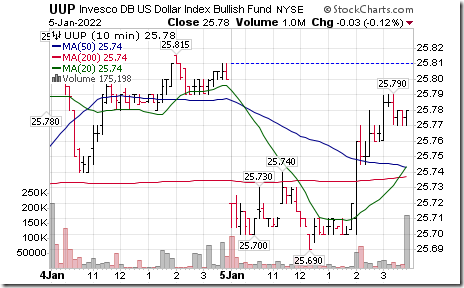
The U.S. Dollar Index and its related ETN moved higher.
The yield on long term U.S. Treasuries moved higher.
Technical Notes released yesterday at
The tailwind to the equity market during the Santa Claus rally period has shifted, which could mean a tougher period for stocks through the remainder of this month. equityclock.com/2022/01/04/… $STUDY $UUP $USD.X $USDX
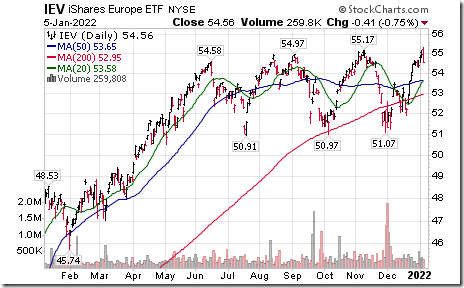
Europe iShares $IEV moved above $55.17 to an all-time high extending an intermediate uptrend.
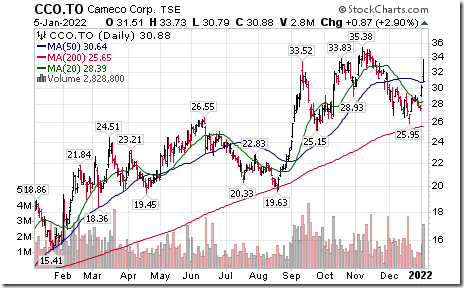
Cameco $CCO.CA a TSX 60 stock is up 8.8% and related uranium ETF $URA is up 4.8% after the Kazakhstan government resigned in the middle of massive political protests. The country produces 42% of the world’s uranium oxide. Seasonal influences are favourable to the end of February. If a subscriber to EquityClock. see seasonality chart at https://charts.equityclock.com/cameco-corporation-tsecco-seasonal-chart
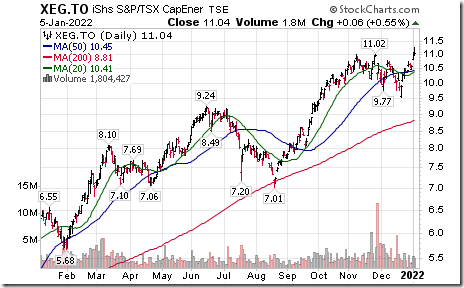
Energy equities on both sides of the border are responding to higher WTI and Western Canadian crude oil prices. Cdn. energy iShares $XEG.CA moved above $11.02 extending an intermediate uptrend. Suncor $SU.CA moved above $33.88 extending an intemediate uptrend. Seasonal influences for the sector are favourable to late April. If a subscriber to EquityClock, see seasonality chart at https://charts.equityclock.com/ishares-sptsx-capped-energy-index-etf-tsexeg-seasonal-chart
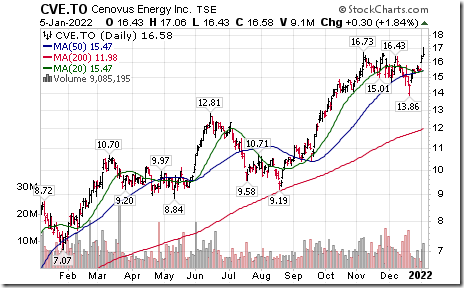
Another Canadian energy equity breakout! Cenovus $CVE.CA a TSX 60 stock moved above $16.73 extending an intermediate uptrend.
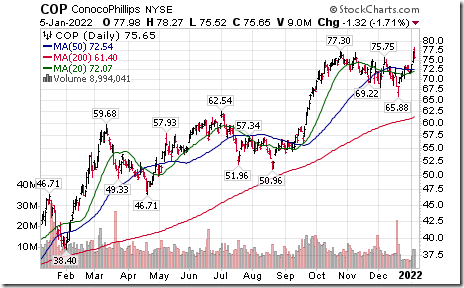
U.S. energy stocks also strong ConocoPhillip $COP an S&P 100 stock moved above $77.30 extending an intermediate uptrend.
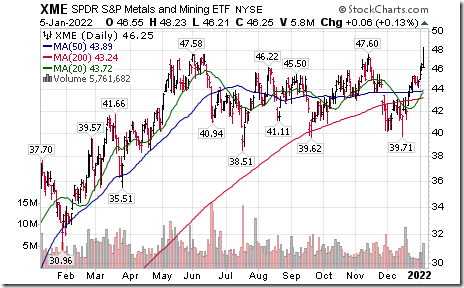
Metals and Mining SPDRs $XME moved above $47.60 to an all-time high extending an intermediate uptrend. Seasonal influences are favourable to the end of April. If a subscriber to EquityClock, see seasonal chart at https://charts.equityclock.com/spdr-sp-metals-and-mining-etf-nysexme-seasonal-chart
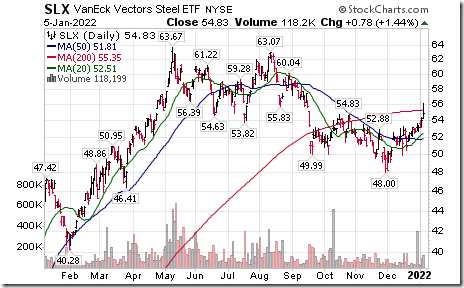
Steel ETF $SLX moved above intermediate resistance at $54.83. Seasonal influences are favourable to the end of April. If a subscriber to EquityClock, see seasonality chart at https://charts.equityclock.com/vaneck-vectors-steel-etf-nyseslx-seasonal-chart
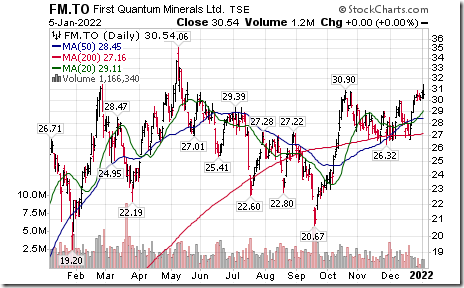
Another base metals stock breakout! First Quantum $FM.CA a TSX 60 stock moved above $30.90 resuming an intermediate uptrend. Seasonality is favourable to May. If a subscriber to EquityClock, see seasonality chart at https://charts.equityclock.com/first-quantum-minerals-limited-tsefm-seasonal-chart
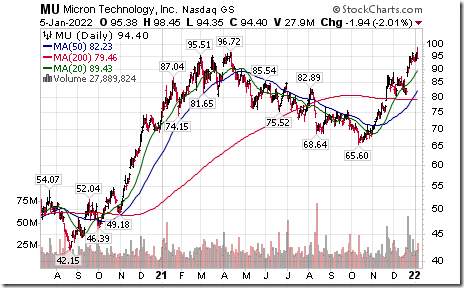
Micron $MU a NASDAQ 100 stock moved above $96.72 to an all-time high extending an intermediate uptrend. Seasonal influences are favourable to April. If a subscriber to EquityClock, see seasonality chart at https://charts.equityclock.com/micron-technology-inc-nasdaqmu-seasonal-chart
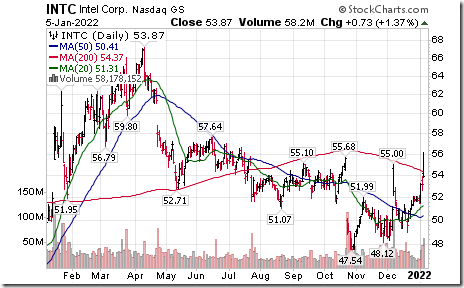
Another semi-conductor stock, Intel $INTC an S&P 100 stock moved above $55.00 extending an intermediate uptrend.
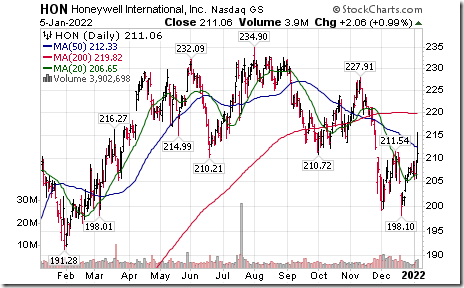
Honeywell $HON a Dow Jones Industrial Average stock moved above $211.54 completing a short term double bottom pattern. Seasonal influences are favourable to May. If a subscriber to EquityClock, see seasonality chart at https://charts.equityclock.com/honeywell-international-inc-nysehon-seasonal-chart
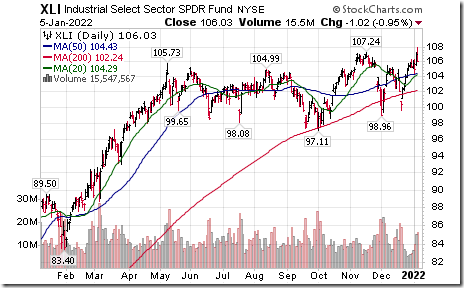
Industrial SPDRs $XLI moved above $107.24 to an all-time high extending an intermediate uptrend.
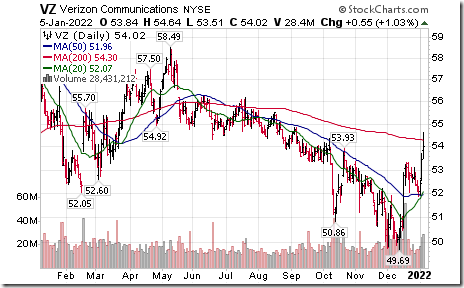
Verizon $VZ a Dow Jones Industrial Average stock moved above intermediate resistance at $53.93.
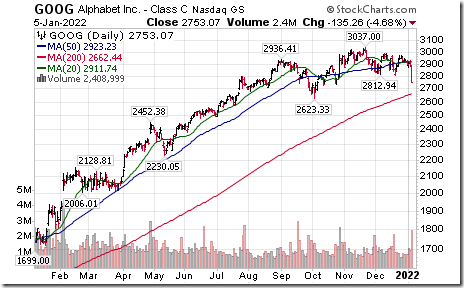
Alphabet $GOOG and $GOOGL are leading U.S. equity markets on the downside this afternoon. GOOG moved below $2812.94 and GOOGL moved below $2786.42 competing double top patterns.
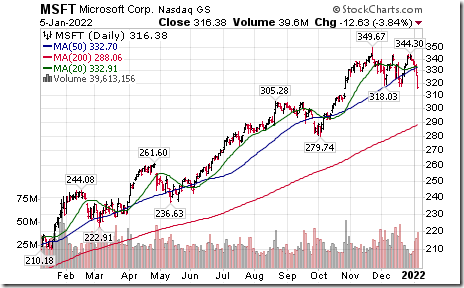
Microsoft $MSFT a Dow Jones Industrial Average stock also led the technology sector on the downside, completing a double top pattern on a move below $318.03
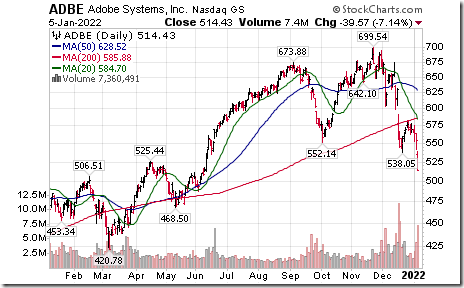
Adobe $ADBE a NASDAQ 100 stock moved below $538.05 extending an intermediate downtrend.
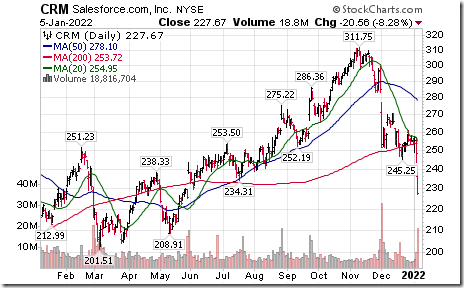
Salesforce $CRM a Dow Jones Industrial Average stock moved below $245.25 and $234.31 extending an intermediate downtrend.
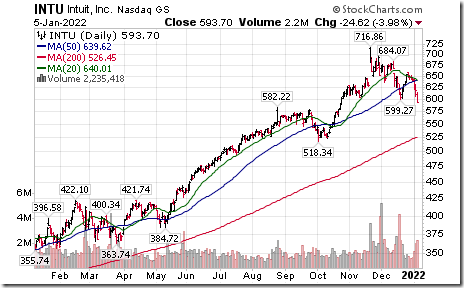
Intuit $INTU a NASDAQ 100 stock moved below $599.27 extending an intermediate downtrend.
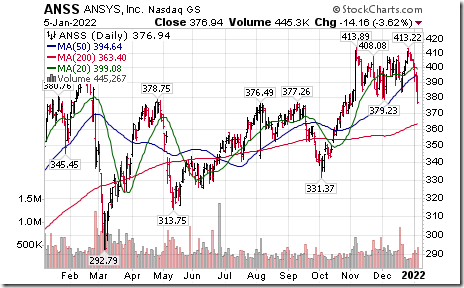
Another technology stock break down! ANSYS $ANSS a NASDAQ 100 stock moved below $379.23 completing a double top pattern.
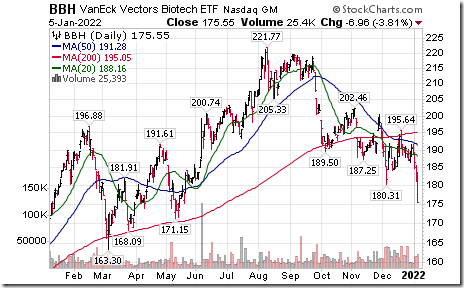
Biotech ETF $BBH moved below $180.31 extending an intermediate downtrend.
Editor’s Note: The most actively traded biotech ETF: $IBB moved below $$143.21 completing a similar technical pattern.
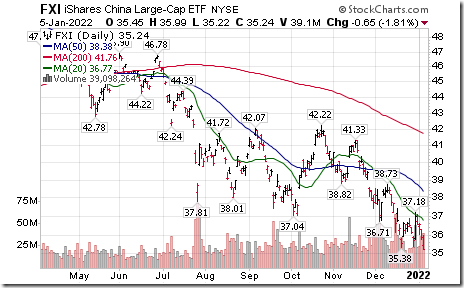
Chinese related ETFs and stocks are under technical pressure again. China Large Cap iShares $FXI moved below $35.38 extending an intermediate downtrend.
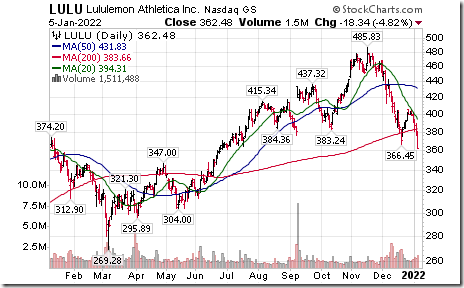
Lululemon $LULU a Chinese influenced stock moved below $366.45 extending an intermediate downtrend;
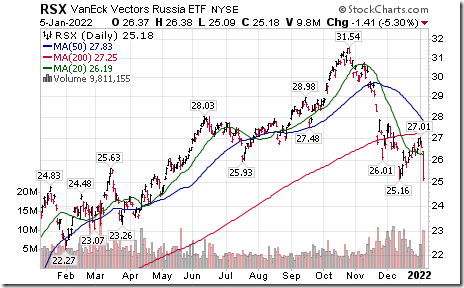
Russia ETF $RSX moved below $25.16 extending an intermediate downtrend.
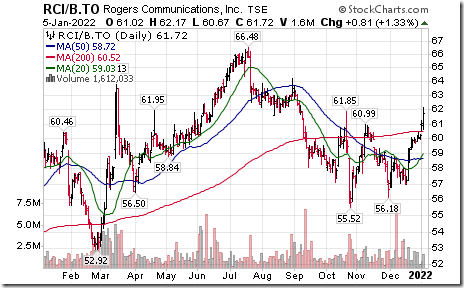
Rogers Communications $RCI.B.CA a TSX 60 stock moved above $60.49 completing a double bottom pattern.
Trader’s Corner
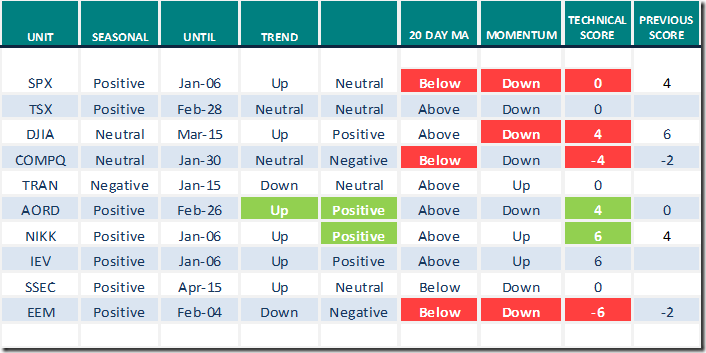
Equity Indices and Related ETFs
Daily Seasonal/Technical Equity Trends for Jan.5th 2022
Green: Increase from previous day
Red: Decrease from previous day
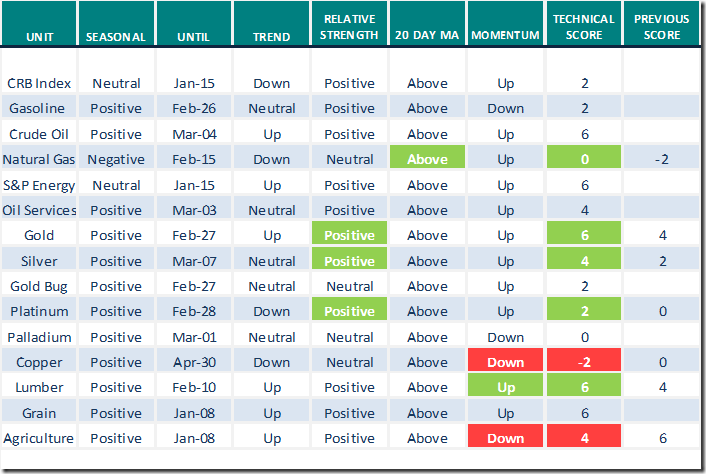
Commodities
Daily Seasonal/Technical Commodities Trends for Jan.5th 2022
Green: Increase from previous day
Red: Decrease from previous day
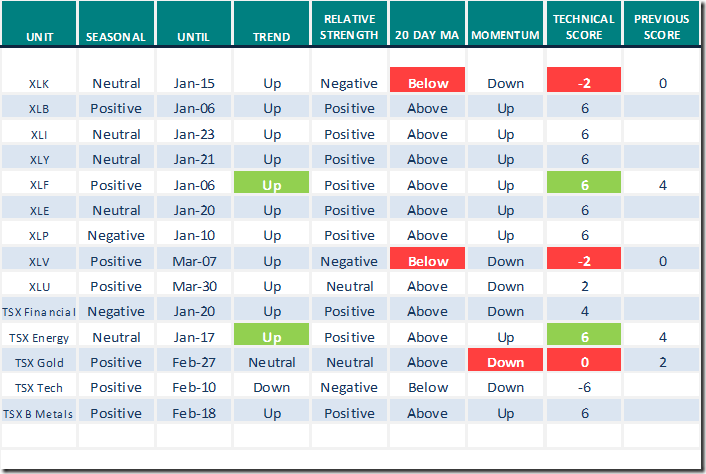
Sectors
Daily Seasonal/Technical Sector Trends for Jan.5th 2021
Green: Increase from previous day
Red: Decrease from previous day
All seasonality ratings are based on performance relative to the S&P 500 Index (except TSX)
Links offered by valued providers
Market Buzz
Greg Schnell offers “New names rotating into 2022. Following is a link:
https://www.youtube.com/watch?v=kxTByMmmGW0
Thank you to Mark Bunting and www.uncommonsenseinvestor.com for links to the following:
Best Stock Ideas From Our All-Star Roster – Uncommon Sense Investor
Seven Canadian Stocks Among RBC’s Top 30 Global Ideas For 2022 – Uncommon Sense Investor
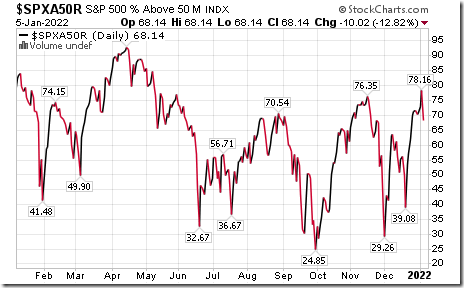
S&P 500 Momentum Barometers
The intermediate term Barometer plunged 10.02 to 68.14 yesterday. It remains Overbought and showing early signs of rolling over.
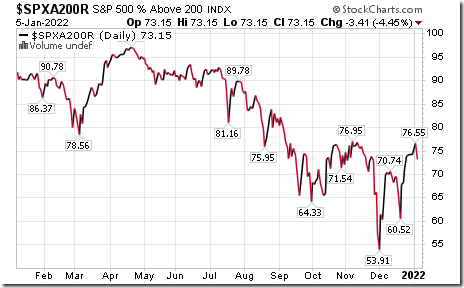
The long term Barometer dropped 3.41 to 73.15 yesterday. It remains Overbought and showing early signs of rolling over.
TSX Momentum Barometers
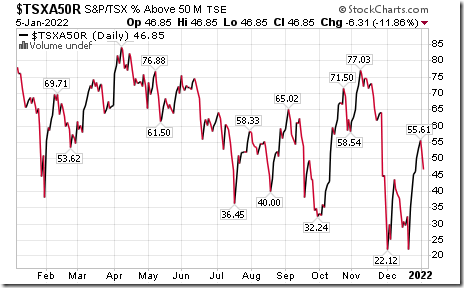
The intermediate term Barometer dropped 6.31 to 46.85 yesterday. It remains Neutral and showing early signs of rolling over.
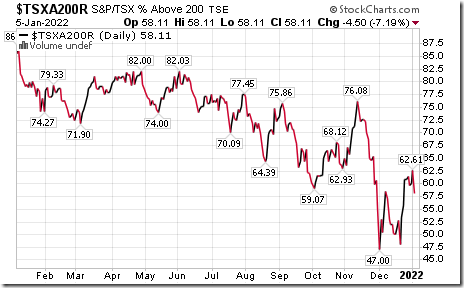
The long term Barometer dropped 4.50 to 58.11 yesterday. It changed from Overbought to Neutral on a drop below 60.00 and shows early signs of rolling over.
Disclaimer: Seasonality and technical ratings offered in this report and at
www.equityclock.com are for information only. They should not be considered as advice to purchase or to sell mentioned securities. Data offered in this report is believed to be accurate, but is not guaranteed
This post was originally publised at Vialoux's Tech Talk.


![clip_image003[1] clip_image003[1]](https://advisoranalyst.com/wp-content/uploads/2022/01/clip_image0031_thumb-1.png)
