by Don Vialoux, EquityClock.com
Technical Notes released yesterday at
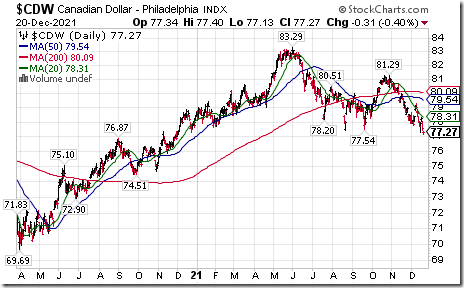
Canadian Dollar $CDW moved below US77/54 and US77.43 cents extending an intermediate downtrend.
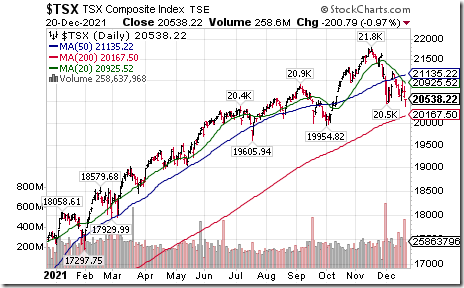
TSX Composite Index $TSX.CA moved below 20,464.60 setting a short term downtrend
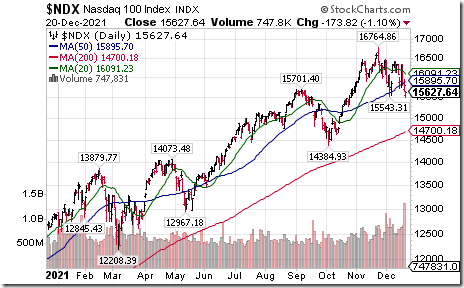
NASDAQ 100 Index $NDX moved below $10,543.31 setting a short term downtrend.
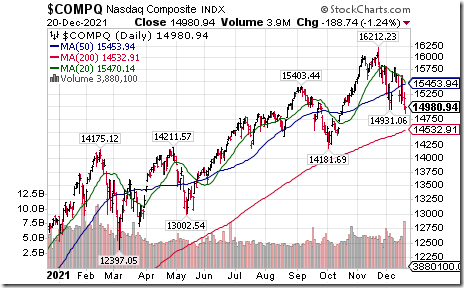
NASDAQ Composite Index $COMPQ moved below 14,931.06 setting a short term downtrend.
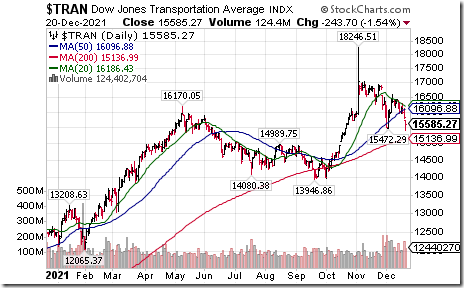
Dow Jones Transportation Average $TRAN moved below 15,472.29 setting an intermediate downtrend.
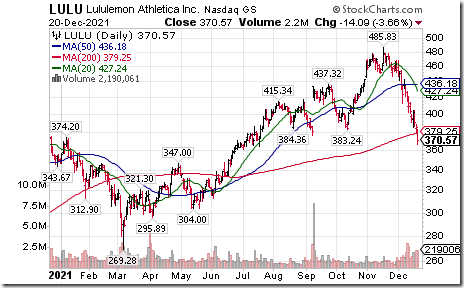
A wide variety of S&P 100 and NASDAQ 100 stocks moved below intermediate support this morning including $CPRT $GM $JD $LULU $KMI $GS $VRSK $SPG and $ROST
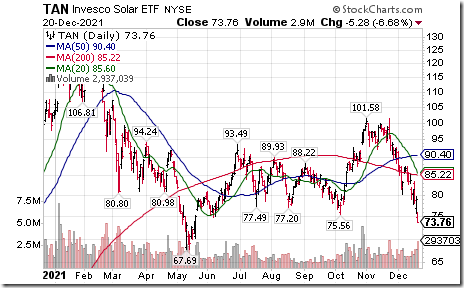
Actively traded ETFs that broke intermediate support this morning included $XOP $XLF $XLE $FCG $MDY $TAN $EIS $ECH
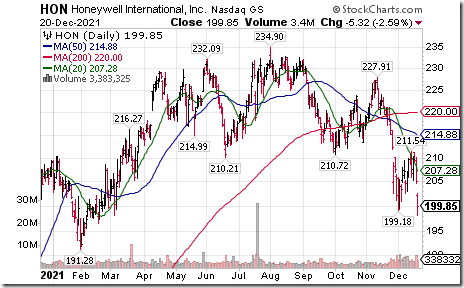
Honeywell $HON a Dow Jones Industrial Average stock moved below $199.18 extending an intermediate downtrend
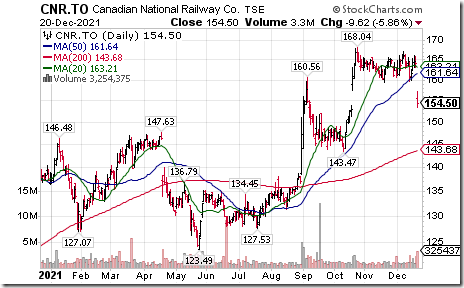
TSX 60 stocks that broke intermediate support this morning included $BMO.CA $CNQ.CA $SNC.CA $CNR.CA
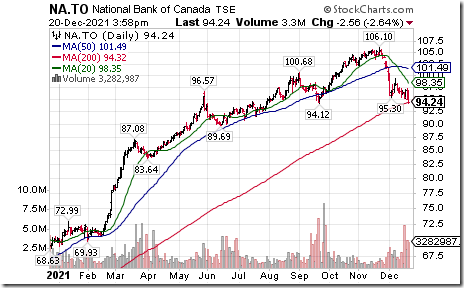
National Bank $NA.CA a TSX 60 stock moved below $95.30 and $94.12 completing a Head & Shoulders pattern.
Trader’s Corner
Equity Indices and Related ETFs
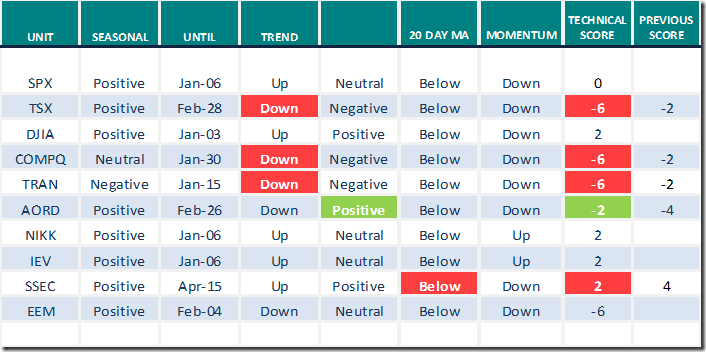
Daily Seasonal/Technical Equity Trends for Dec.20th 2021
Green: Increase from previous day
Red: Decrease from previous day
Commodities
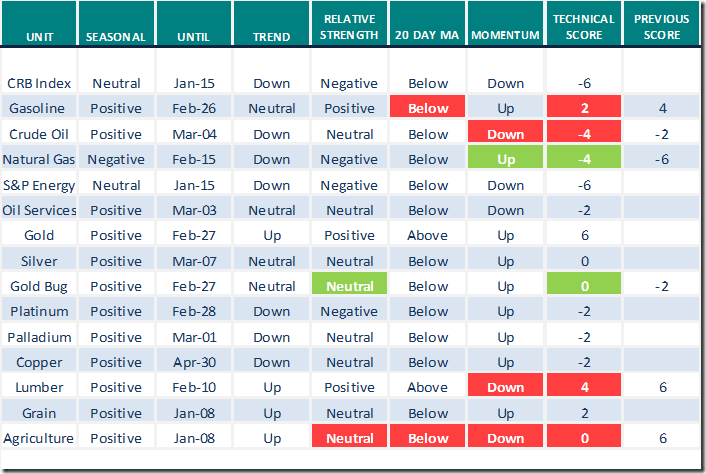
Daily Seasonal/Technical Commodities Trends for Dec.20th 2021
Green: Increase from previous day
Red: Decrease from previous day
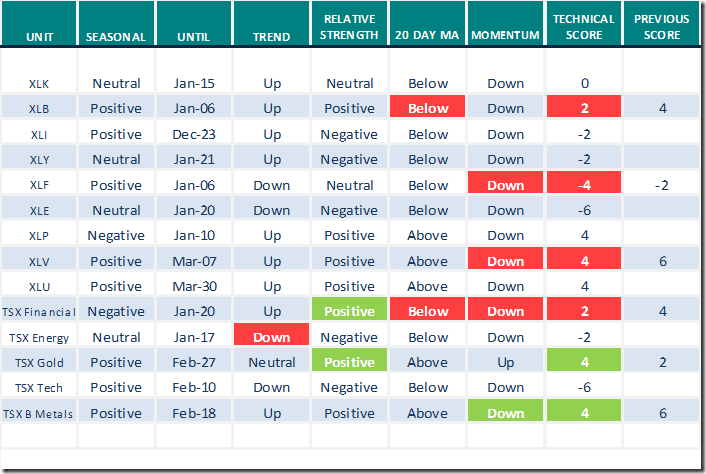
Sectors
Daily Seasonal/Technical Sector Trends for Dec.20th 2021
Green: Increase from previous day
Red: Decrease from previous day
All seasonality ratings are based on performance relative to the S&P 500 Index (except TSX).
Next Meeting of Canadian Association for Technical Analysis
Next virtual meeting is held at 8:00 PM EST on Thursday December 23rd. Speaker is Dwight Galusha. Members register at CATA Meeting with Dwight Galusha – Events – Canadian Association for Technical Analysis (clubexpress.com)
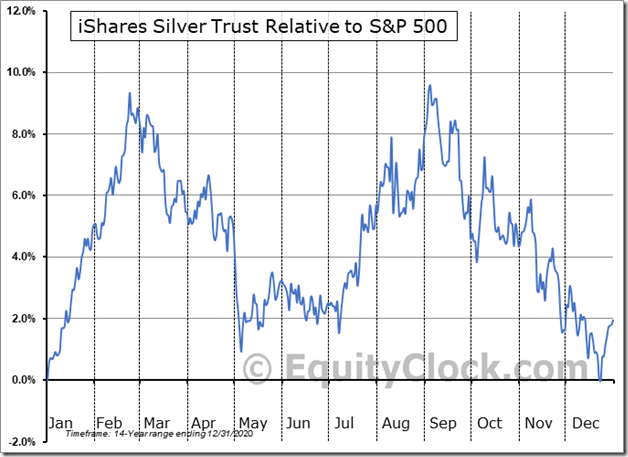
Seasonality Chart of the Day from www.EquityClock.com
Silver futures and their related ETN: SLV have a period of seasonal strength on a real and relative basis (relative to the S&P 500) from now to at least the end of February.
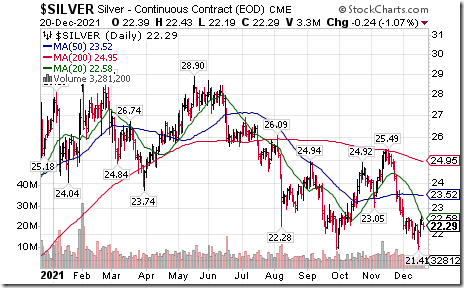
Technicals have started to improve on schedule. Nice recent bounce from $21.41! Strength relative to the S&P 500 changed from Negative to Neutral yesterday. Short term momentum indicators (Daily Stochastics, RSI and MACD) recently turned higher from oversold levels.
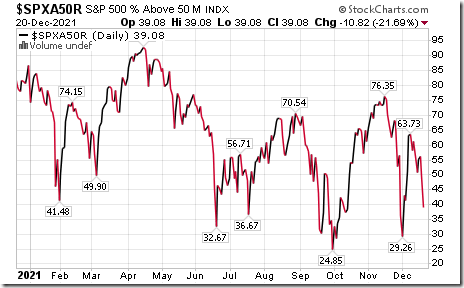
S&P 500 Momentum Barometers
The intermediate term Barometer dropped 10.83 to 39.08 yesterday. It changed from Neutral to Oversold on a move below 40.00 but has yet to show signs of bottoming.
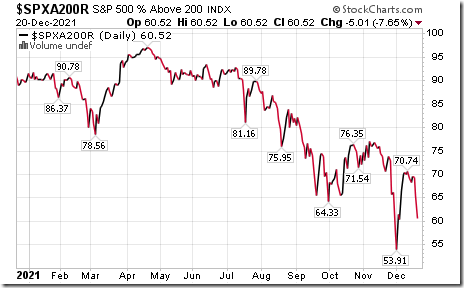
The long term Barometer dropped 5.01 to 60.52 yesterday. It remains Overbought and trending down.
TSX Momentum Barometers
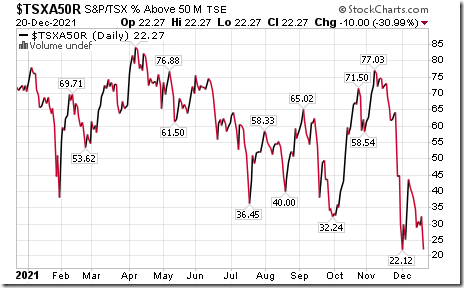
The intermediate term Barometer dropped 10.00 to 22.27 yesterday. It remains Oversold, but has yet to show signs of bottoming.
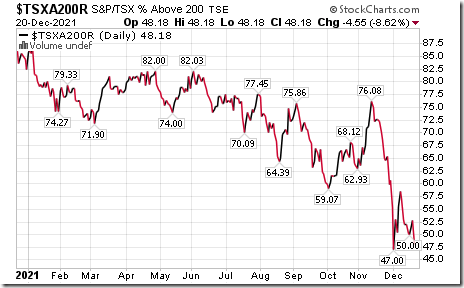
The long term Barometer fell 4.55 to 48.18 yesterday. It remains Neutral and trending down.
Disclaimer: Seasonality and technical ratings offered in this report and at
www.equityclock.com are for information only. They should not be considered as advice to purchase or to sell mentioned securities. Data offered in this report is believed to be accurate, but is not guaranteed
This post was originally publised at Vialoux's Tech Talk.


