by Don Vialoux, EquityClock.com
The Bottom Line
Will Santa Claus come to Bay and Wall Street this year? Probably, but with a caveat!
The S&P 500 Index has advanced 74% of the time from December 15th to January 6th during the past 31 years. Average gain per period was 1.64%. The TSX Composite Index has advanced 87% of the time from December 15th to January 6th during the past 31 years. Average gain per period was 2.15%.
Favourable events this year include:
· Higher consumer sales than the same period last year. Growth in fourth quarter nominal retail sales in the U.S. are estimated at 12%.
· Higher year-end bonuses partially to be invested into the equity market. Bonuses to Canadian bank employees are expected to be 18% higher than last year.
· The end of Tax loss selling pressures. Three equity sectors, that recently came under tax loss selling pressures (China, cannabis and gold), have started to recover from recent lows (most notably gold, precious metals equities and related ETFs)
· Release of bullish year-end media reports by investment dealers projecting a favourable outlook next year. Several reports were released last week (including Jim Cramer’s bullish outlook) and more are expected this week.
· Likely passage of Biden’s $1.75 billion “Build Back Better” program in January to stimulate the U.S. economy.
· Anticipation of strong fourth quarter year-over-year earnings and revenue reports by major U.S. and Canadian companies to be released starting at the beginning in the second week of January. Consensus for S&P 500 companies calls for 21.3% increase in earnings and a 12.8% increase in revenues.
Unfavourable event this year is emergence of the Omicron variant of COVID 19 prompting the partial shutdown of commerce during the Christmas season.
Observations
Responses to the FOMC meeting released at 2:00 PM on Wednesday were as follows: 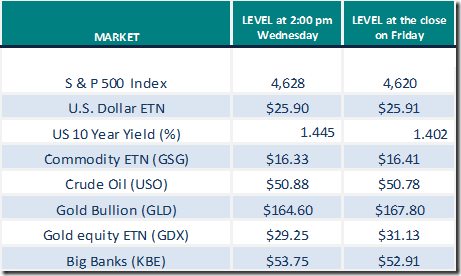
Intermediate term technical indicator for U.S. equity markets (Percent of S&P 500 stocks trading above their 50 day moving average) moved lower last week. It changed back from Overbought to Neutral. Trend is down. See Momentum Barometer chart at the end of this report.
Long term technical indicator for U.S. equity markets (Percent of S&P 500 stocks trading above their 200 day moving average) moved lower last week. It remained Overbought. Trend is down. See Momentum Barometer chart at the end of this report.
Intermediate term technical indicator for Canadian equity markets remained Oversold last week and shows early signs of bottoming See Momentum Barometer chart at the end of this report.
Long term technical indicator for Canadian equity markets (Percent of TSX stocks trading above their 200 day moving average) was virtually unchanged last week. It remained Neutral. See Momentum Barometer chart at the end of this report.
Consensus estimates for earnings and revenues in 2021 by S&P 500 companies moved slightly higher again from last week. According to www.FactSet.com earnings in the fourth quarter are projected to increase 21.3% (versus 21.1% last week) and revenues are projected to increase 12.8% (versus 12.7% last week). Earnings for all of 2021 are projected to increase 45.1% and revenues are projected to increase 15.8%.
Consensus estimates for earnings and revenues in 2022 by S&P 500 companies also increased slightly. Consensus earnings on a year-over-year basis for the first quarter are projected to increase 6.2% (versus previous 6.0%) and revenues are expected to increase 9.5% (versus previous 9.4%) Earnings in the second quarter are expected to increase 4.1% (versus previous 3.9%) and revenues are expected to increase 7.5% (versus previous 7.2%). Consensus earnings in 2022 by S&P 500 companies are projected to increase 9.2% (versus previous 9.0%) and revenues are projected to increase 7.5% (versus previous7.3%.
Economic News This Week
November Leading Economic Indicators to be released at 10:00 AM EST on Monday are expected to increase 0.8% versus a gain of 0.9% in October.
October Canadian Retail Sales to be released at 8:30 AM EST on Tuesday are expected to drop 1.2% versus a decline of 0.6% in September.
Next estimate of U.S. third quarter annualized real GDP to be released at 8:30 AM EST on Wednesday is unchanged at 2.1%.
November Existing Home Sales to be released at 10:00 AM EST on Wednesday are expected to increase to 6.50 million units from 6.34 million units in October.
November Durable Goods Orders to be released at 8:30 AM EST on Thursday are expected to increase 1.5% versus a decline of 0.4% in October. Excluding transportation orders, November Durable Goods Orders are expected to increase 0.6% versus a gain of 0.5% in October.
November Personal Income to be released at 8:30 AM EST on Thursday is expected to increase 0.4% versus a gain of 0.5% in October. November Personal Spending is expected to increase 0.6% versus a gain of 1.3% in October.
October Canadian GDP to be released at 8:30 AM EST on Thursday is expected to increase 0.8% versus a gain of 0.1% in September.
December Michigan Consumer Sentiment to be released at 10:00 AM EST on Thursday is expected to remain unchanged from November at 70.4.
November New Home Sales to be released at 10:00 AM EST on Thursday are expected to increase to 767,000 units from 745,000 units in October.
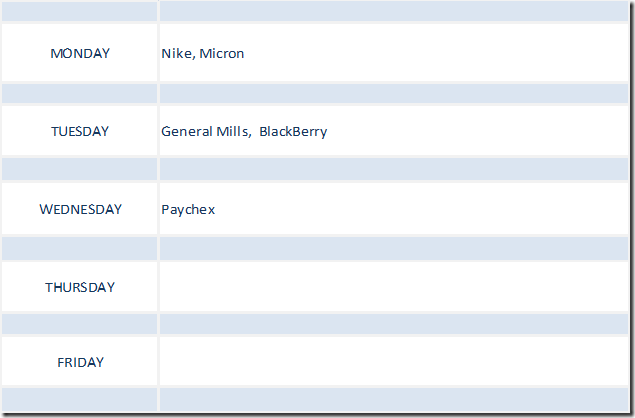
Selected Earnings News This Week
Trader’s Corner
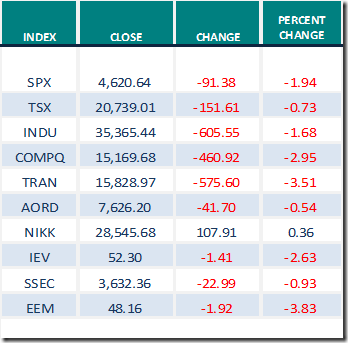
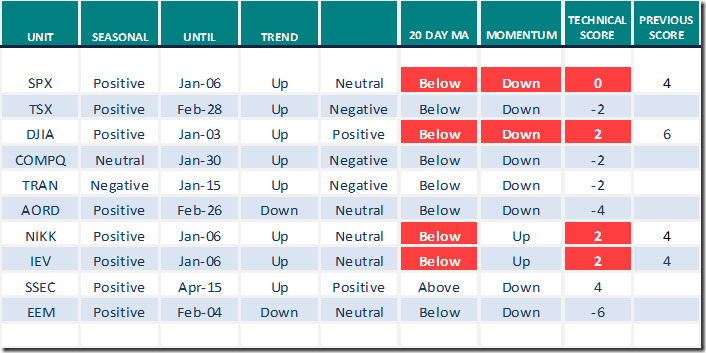
Equity Indices and Related ETFs
Daily Seasonal/Technical Equity Trends for Dec.17th 2021
Green: Increase from previous day
Red: Decrease from previous day
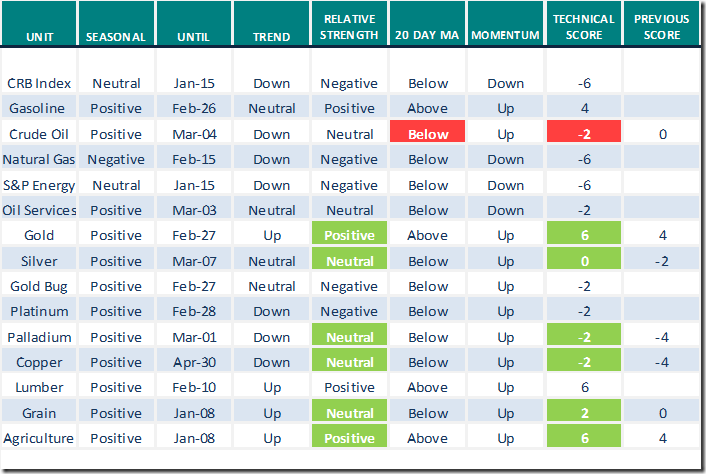
Commodities
Daily Seasonal/Technical Commodities Trends for Dec.17th 2021
Green: Increase from previous day
Red: Decrease from previous day
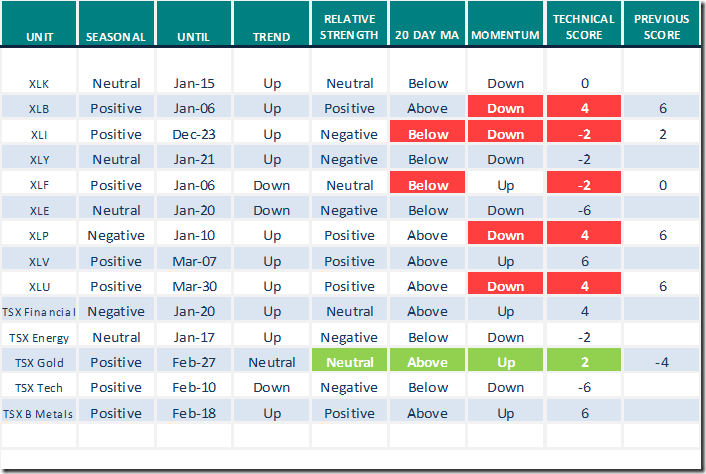
Sectors
Daily Seasonal/Technical Sector Trends for Dec.17th 2021
Green: Increase from previous day
Red: Decrease from previous day
All seasonality ratings are based on performance relative to the S&P 500 Index (except TSX).
Links offered by valued providers
Michael Campbell’s Money Talks for December 18th
December 18th Episode – Michael Campbell’s Money Talks – Omny.fm
Technical Scoop by David Chapman and www.EnrichedInvesting.com
Thank you to Mark Bunting and www.uncommonsenseinvestor.com for links to the following:
Our 10 Most Popular Videos & Articles of 2021 – Uncommon Sense Investor
Two Stock Ideas From Five-Star Dividend Growth Manager – Uncommon Sense Investor
Liz Weston: A year-end money checklist for people 50 and up (yahoo.com)
Mark Leibovit talks about the Fed and inflation
The Fed and Inflation – HoweStreet
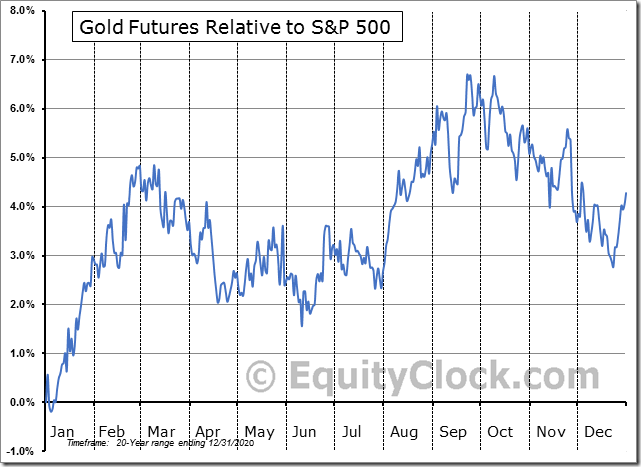
Seasonality Chart of the Day from www.EquityClock.com
Gold bullion prices and related ETNs (e.g. GLD) are about to enter their best period of strength in the year from December 23rd to February 27th.
Technicals became favourable last week: Strength relative to the S&P 500 turned positive, units moved above their 20 and 200 day moving averages and daily momentum indicators advanced.
Technical Scores
Calculated as follows:
Intermediate Uptrend based on at least 20 trading days: Score 2
(Higher highs and higher lows)
Intermediate Neutral trend: Score 0
(Not up or down)
Intermediate Downtrend: Score -2
(Lower highs and lower lows)
Outperformance relative to the S&P 500 Index: Score: 2
Neutral Performance relative to the S&P 500 Index: 0
Underperformance relative to the S&P 500 Index: Score –2
Above 20 day moving average: Score 1
At 20 day moving average: Score: 0
Below 20 day moving average: –1
Up trending momentum indicators (Daily Stochastics, RSI and MACD): 1
Mixed momentum indicators: 0
Down trending momentum indicators: –1
Technical scores range from -6 to +6. Technical buy signals based on the above guidelines start when a security advances to at least 0.0, but preferably 2.0 or higher. Technical sell/short signals start when a security descends to 0, but preferably -2.0 or lower.
Long positions require maintaining a technical score of -2.0 or higher. Conversely, a short position requires maintaining a technical score of +2.0 or lower
Changes Last Week
Technical Notes released on Friday at
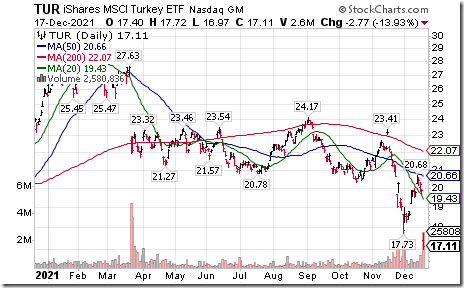
Turkey iShares $TUR moved below $17.73 extending an intermediate downtrend.
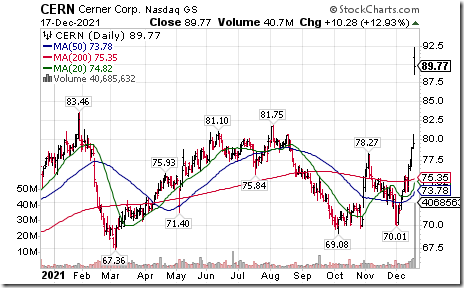
Cerner $CERN a NASDAQ 100 stock moved above $83.46 to an all-time high extending an intermediate uptrend. Oracle is in discussions for possible purchase of the company.
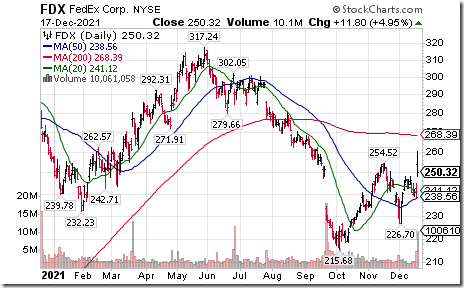
FedEx $FDX moved above $254.52 resuming an intermediate uptrend. The company reported higher than consensus quarterly results and a $5 billion share buyback program.
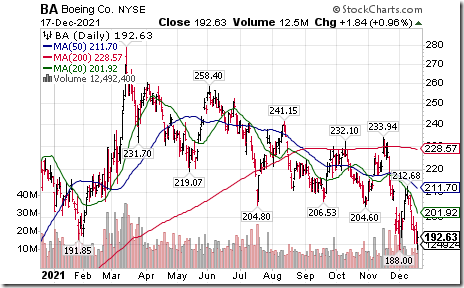
Boeing $BA a Dow Jones Industrial Average stock moved below $188 extending an intermediate downtrend.
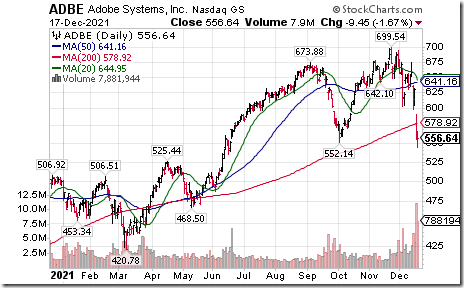
Adobe $ADBE a NASDAQ 100 stock fell below intermediate support at $552.14
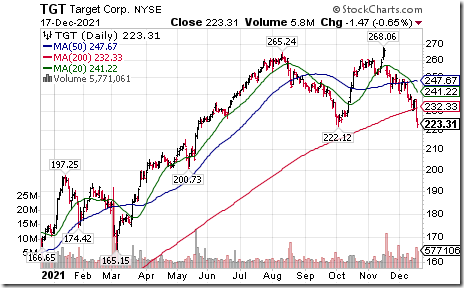
Target $TGT an S&P 100 stock moved below intermediate support at $222.12 completing a double top pattern.
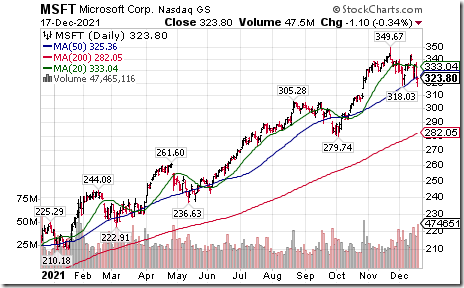
Microsoft $MSFT a Dow Jones Industrial Average stock moved below $318.03 completing a double top pattern.
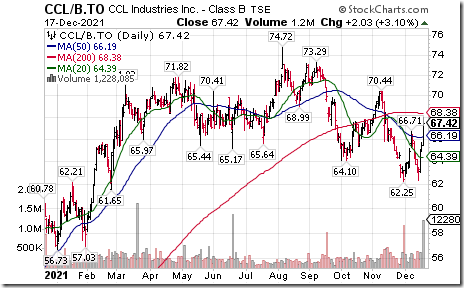
CCL Industries $CCL.B.CA a TSX 60 stock moved above $66.71 completing a double bottom pattern. Seasonal influences are favourable to early April. If a subscriber to EquityClock, see seasonal chart at https://charts.equityclock.com/ccl-industries-inc-tseccl-b-seasonal-chart
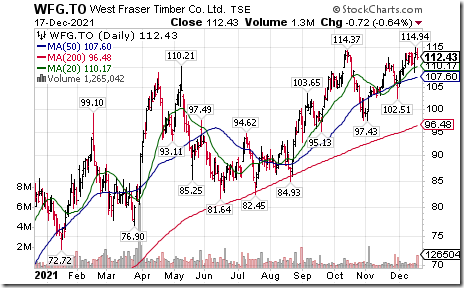
Lumber stocks continue to respond to higher lumber prices. West Fraser Timber $WFG.CA moved above Cdn$114.37 to an all-time high extending an intermediate uptrend. Seasonal influences for West Fraser as well as most lumber stocks are favourable to the end of February. If a subscriber to EquityClock, see seasonality chart at https://charts.equityclock.com/west-fraser-timber-co-ltd-tsewfg-to-seasonal-chart
S&P 500 Momentum Barometers
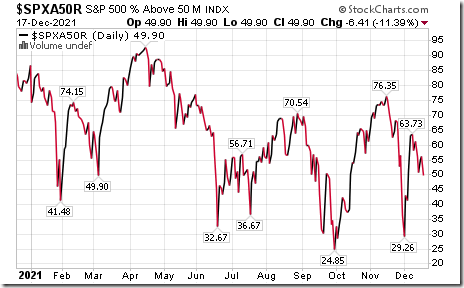
The intermediate term Barometer dropped 6.41 on Friday and 11.42 last week to 49.90. It changed from Overbought to Neutral on a decline below 60.00. Trend is down.
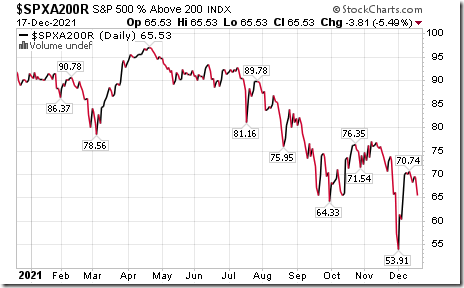
The long term Barometer dropped 3.81 on Friday and 5.21 last week to 65.53. It remains Overbought. Trend is down.
TSX Momentum Barometers
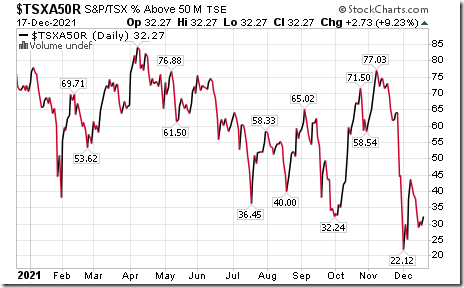
The intermediate term Barometer added 2.73 on Friday, but dropped 5.52 last week to 32.27. It remains Oversold and showing early signs of bottoming
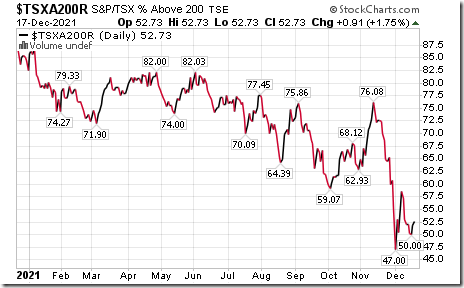
The long term Barometer added 0.91 on Friday and 0.66 last week to 52.73. It remains Neutral
Disclaimer: Seasonality and technical ratings offered in this report and at
www.equityclock.com are for information only. They should not be considered as advice to purchase or to sell mentioned securities. Data offered in this report is believed to be accurate, but is not guaranteed
This post was originally publised at Vialoux's Tech Talk.


![clip_image002[1] clip_image002[1]](https://advisoranalyst.com/wp-content/uploads/2021/12/clip_image0021_thumb-10.png)
