by Don Vialoux, EquityClock.com
Technical Notes released yesterday at
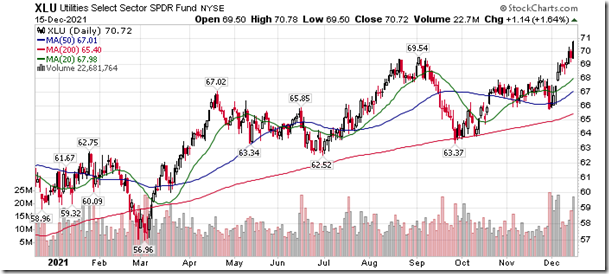
The defensive bias that is proliferating in this market suggests caution remains warranted. equityclock.com/2021/12/15/… $XLP $XLU $XLV $IYR
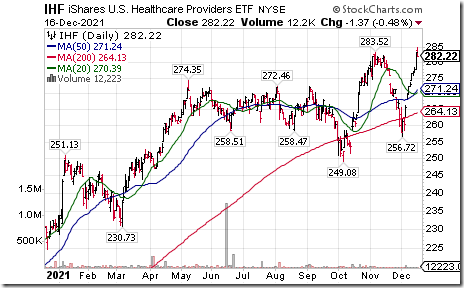
Healthcare Providers $IHF moved above $283.52 to an all-time high extending an intermediate uptrend. Seasonal influences are favourable to the third week in February. If a subscriber to EquityClock, see seasonality chart at https://charts.equityclock.com/ishares-u-s-healthcare-providers-etf-nyseihf-seasonal-chart
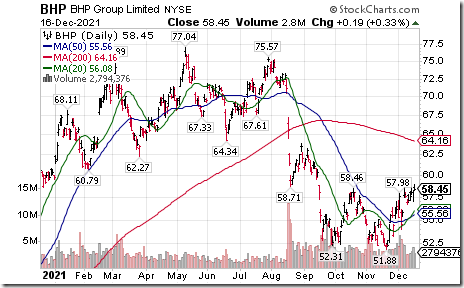
BHP Billiton $BHP one of the largest base metals producers in the world moved above $58.46 completing a double bottom pattern. Seasonal influences are favourable to the third week in April. If a subscriber to EquityClock, see seasonality chart at https://charts.equityclock.com/bhp-billiton-limited-adr-nysebhp-seasonal-chart
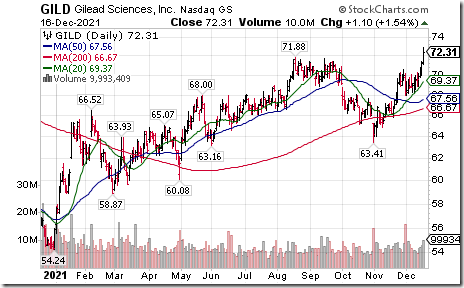
Gilead $GILD a NASDAQ 100 stock moved above $71.88 extending an intermediate uptrend.
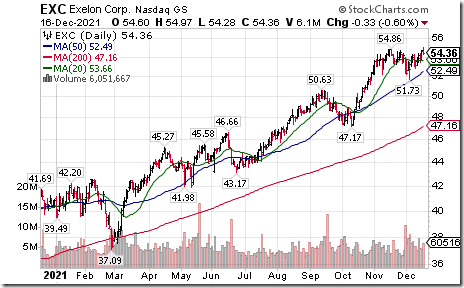
Exelon $EXC an S&P 100 stock moved above $54.86 to an all-time high extending an intermediate uptrend.
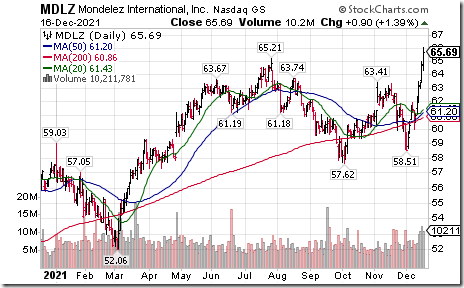
Mondelez $MDLZ a NASDAQ 100 stock moved above $65.21 to an all-time high extending an intermediate uptrend.
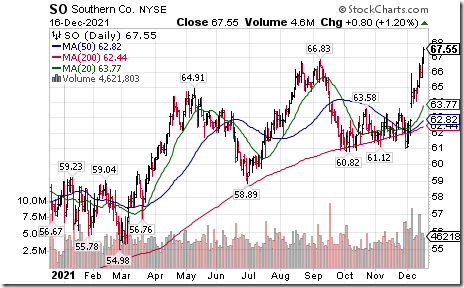
Southern Companies $SO an S&P 100 stock moved above $66.83 to an all-time high extending an intermediate uptrend.
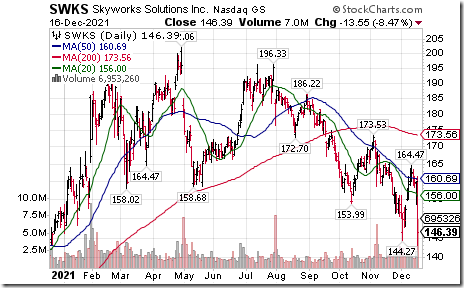
Skyworks Solutions $SWKS a NASDAQ 100 stock moved below $144.27 extending an intermediate downtrend.
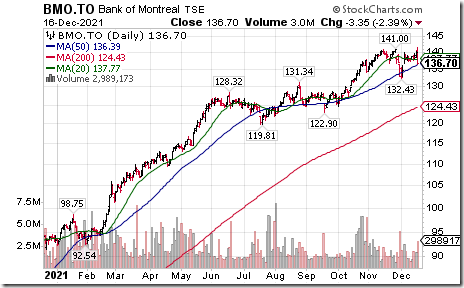
Bank of Monteral $BMO.CA a TSX 60 stock moved above Cdn$141.00 to an all-time high extending an intermediate uptrend.
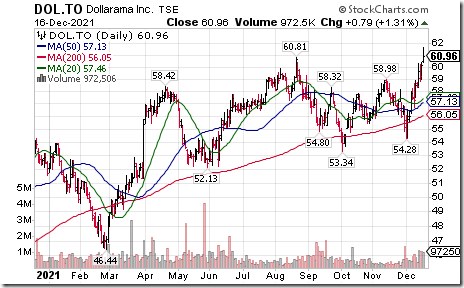
Dollarama $DOL.CA a TSX 60 stock moved above Cdn$60.81 to an all-time high extending an intermediate uptrend.
Trader’s Corner
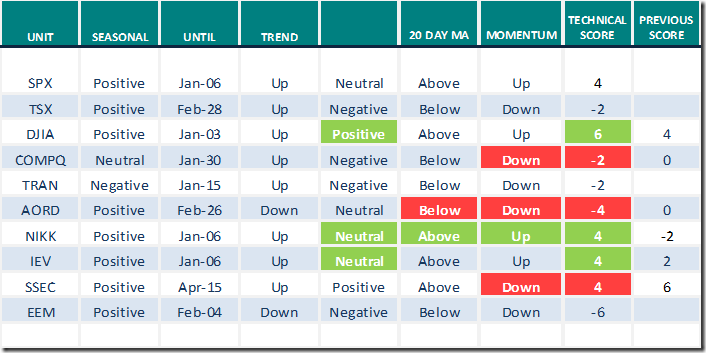
Equity Indices and Related ETFs
Daily Seasonal/Technical Equity Trends for Dec.16th 2021
Green: Increase from previous day
Red: Decrease from previous day
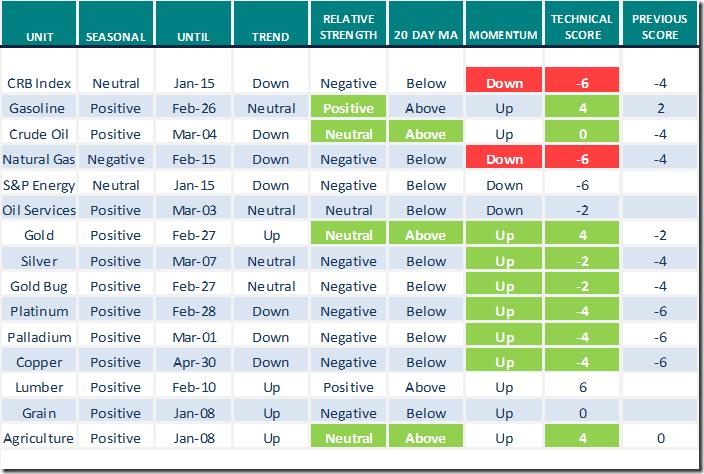
Commodities
Daily Seasonal/Technical Commodities Trends for Dec.16th 2021
Green: Increase from previous day
Red: Decrease from previous day
Sectors
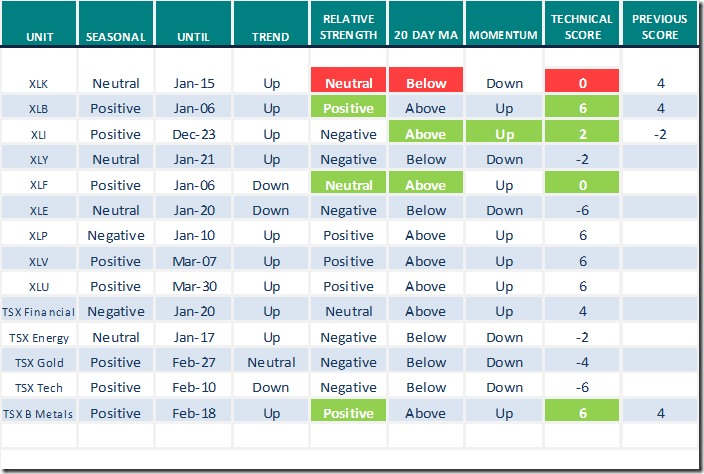
Daily Seasonal/Technical Sector Trends for Dec.16th 2021
Green: Increase from previous day
Red: Decrease from previous day
All seasonality ratings are based on performance relative to the S&P 500 Index (except TSX).
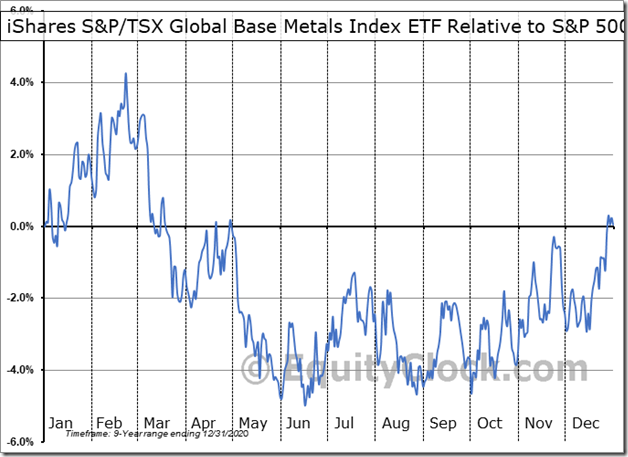
Seasonality Chart of the Day from www.EquityClock.com
Base metals equities and related ETFs (e.g..XBM.TO, PICK, COPX) have a history of moving higher on a real and relative basis between now and the third week in February
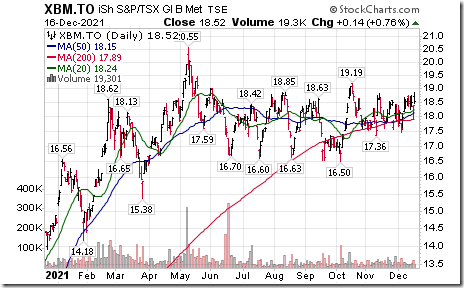
Technical parameters for XBM.TO continue to improve: Intermediate trend is up, strength relative to the S&P 500 Index has just turned positive, units recently moved above their 20, 50 and 200 day moving averages. Daily momentum indicators are trending higher.
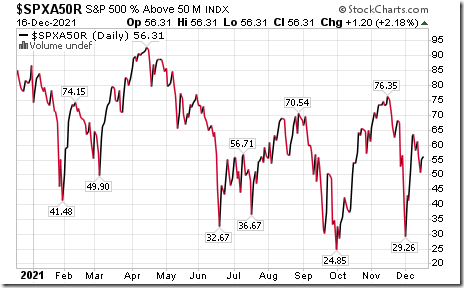
S&P 500 Momentum Barometers
The intermediate term Barometer added 1.20 to 56.31 yesterday. It remains Neutral.
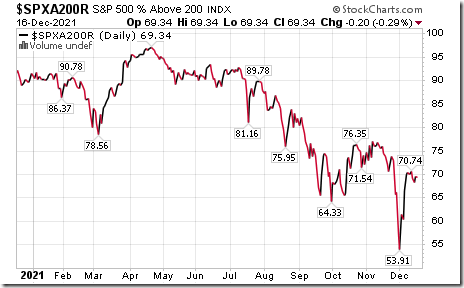
The long term Barometer slipped 0.20 to 69.34 yesterday. It remains Overbought.
TSX Momentum Barometers
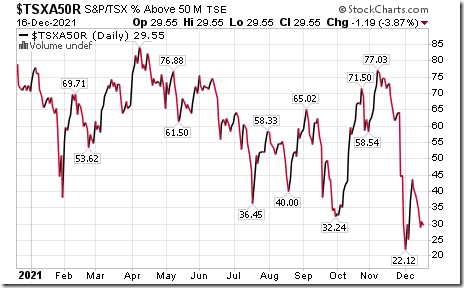
The intermediate term Barometer slipped 1.19 to 29.55 yesterday. It remains Oversold.
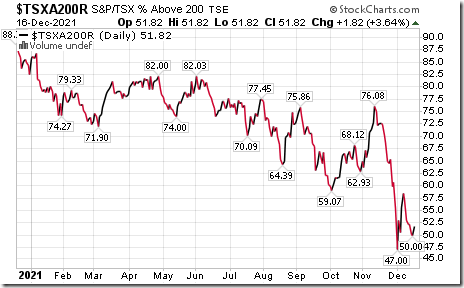
The long term Barometer added 1.82 to 51.82 yesterday. It remains Neutral.
Disclaimer: Seasonality and technical ratings offered in this report and at
www.equityclock.com are for information only. They should not be considered as advice to purchase or to sell mentioned securities. Data offered in this report is believed to be accurate, but is not guaranteed
This post was originally publised at Vialoux's Tech Talk.


