by Don Vialoux, EquityClock.com
The Bottom Line
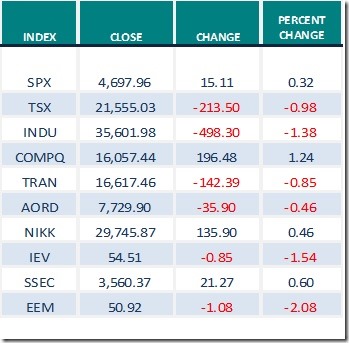
Broadly based equity indices were mixed last week. Look for strength in quiet North American equity markets late this week before and after the U.S. Thanksgiving holiday.
Observations
Equity markets in North America are expected to be quieter than usual with a slightly higher bias this week. Volume is expected to drop as the week progresses towards the Thanksgiving holiday on Thursday. As noted in a study by EquityClock last week, U.S. equity indices on average have record their best two consecutive day performance of the year from the day before Thanksgiving to the day after Thanksgiving.
Short term short term indicators for U.S. equity indices and sectors (20 day moving averages, short term momentum indicators) were mixed last week.
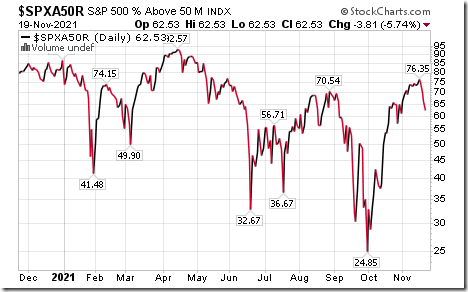
Intermediate term technical indicator for U.S. equity markets (Percent of S&P 500 stocks trading above their 50 day moving average) moved lower last week. It remained Overbought, See Barometer chart at the end of this report.
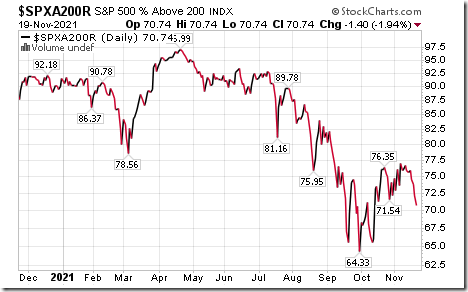
Long term technical indicator for U.S. equity markets (Percent of S&P 500 stocks trading above their 200 day moving average) moved lower last week. It remained Overbought. See Barometer chart at the end of this report.
Short term momentum indicators for Canadian indices and sectors were mixed last week.
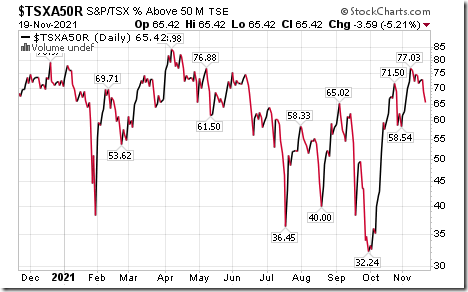
Intermediate term technical indicator for Canadian equity markets moved lower last week. It remained Overbought. See Barometer chart at the end of this report.
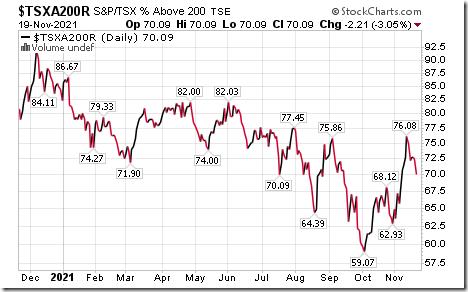
Long term technical indicator for Canadian equity markets (Percent of TSX stocks trading above their 200 day moving average) moved lower last week. It remained Overbought.. See Barometer charts at the end of this report.
Consensus estimates for earnings and revenues in 2021 by S&P 500 companies increased slightly last week: 95% of S&P 500 companies have reported third quarter results to date. According to www.FactSet.com earnings in the third quarter on a year-over year basis are projected to increase 39.6% (versus 39.1% last week) and revenues are projected to increase 17.8% (versus a previous estimate at 17.5%). Earnings in the fourth quarter are projected to increase 21.1% (versus 20.9% last week) and revenues are projected to increase 12.6% (versus 12.3% last week). Earnings for all of 2021 are projected to increase 44.9% (versus 44.7% last week) and revenues are projected to increase 15.8% (versus 15.6 last week).
Consensus estimates for earnings and revenues in 2022 by S&P 500 companies also were virtually unchanged last week. Consensus earnings on a year-over-year basis for the first quarter are projected to increase 5.9% (versus 5.8% last week) and revenues are expected to increase 9.3% (versus 9.1% last week). Earnings in the second quarter are expected to increase 3.8% (versus 3.6% last week) and revenues are expected to increase 7.2% (versus 7.1% last week). Consensus earnings in 2022 by S&P 500 companies are projected to increase 8.7% (versus 8.5% last week) and revenues are projected to increase7.1% (versus 7.0% last week)
Economic News This Week
U.S. October Existing Home Sales to be released at 10:00 AM EST on Monday are expected to slip to 6.20 million units from 6.29 million units in September
October Durable Goods Orders to be released at 8:30 AM EST on Wednesday are expected to increase 0.2% versus a decline of 0.3% in September. Excluding transportation orders, October Durable Goods Orders are expected to increase 0.4% versus a gain of 0.5% in September.
Next estimate of U.S. Third Quarter real GDP to be released at 8:30 AM EST on Wednesday is expected to be revised to growth at a 2.2% versus the previous estimate at 2.0%.
November Michigan Consumer Sentiment to be released at 10:00 AM EST on Wednesday is expected to slip to 65.9 from 55.8 in October.
October New Home Sales to be released at 10:00 AM EST on Wednesday are expected to increase to 802,000 from 800,000 in September.
October Personal Income to be released at 10:00 AM EST on Wednesday is expected to increase 0.2% versus a decline of 1.0% in September. October Personal Spending is expected to increase 0.9% versus a gain of 0.6% in September.
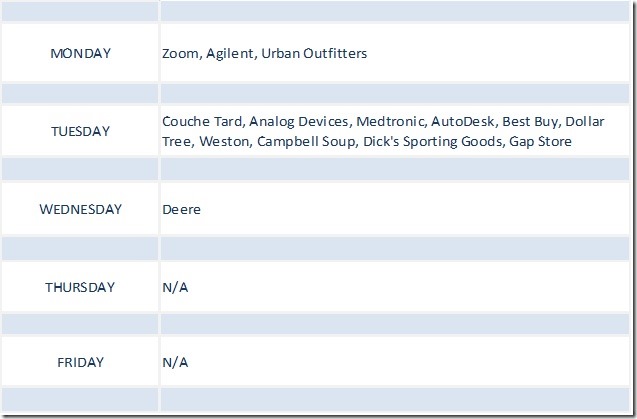
Earnings Reports This Week
Trader’s Corner
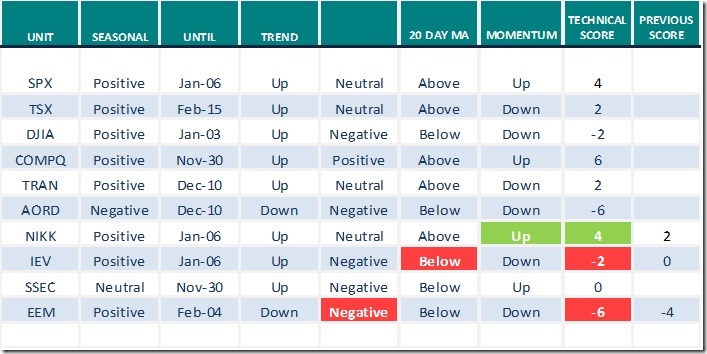
Equity Indices and Related ETFs
Daily Seasonal/Technical Equity Trends for Nov.19th 2021
Green: Increase from previous day
Red: Decrease from previous day
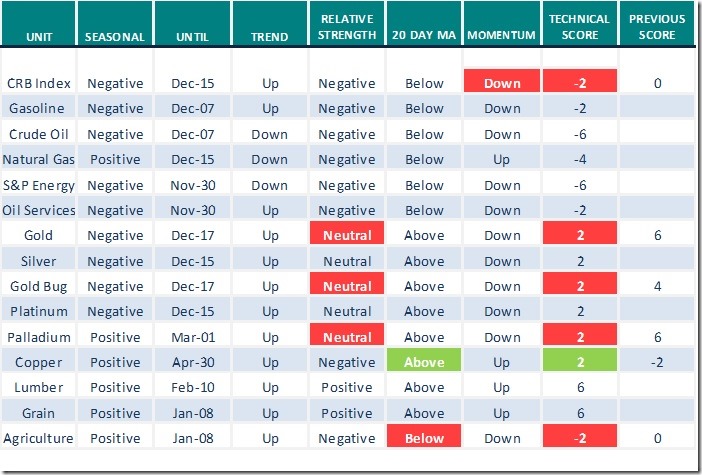
Commodities
Daily Seasonal/Technical Commodities Trends for Nov.19th 2021
Green: Increase from previous day
Red: Decrease from previous day
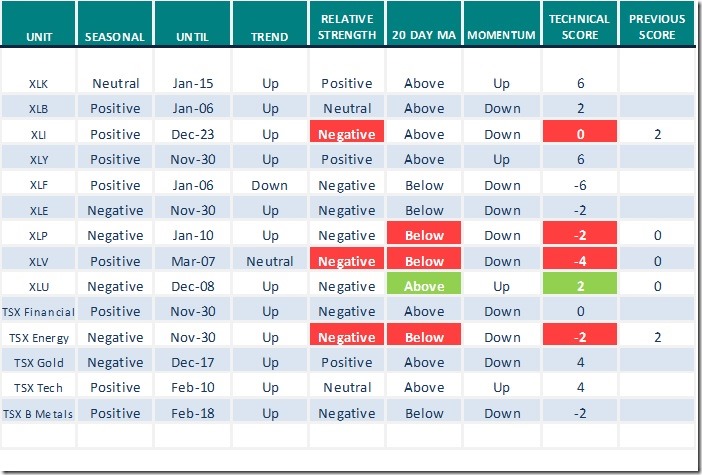
Sectors
Daily Seasonal/Technical Sector Trends for Nov.19th 2021
Green: Increase from previous day
Red: Decrease from previous day
All seasonality ratings are based on performance relative to the S&P 500 Index
(except TSX).
Technical Scores
Calculated as follows:
Intermediate Uptrend based on at least 20 trading days: Score 2
(Higher highs and higher lows)
Intermediate Neutral trend: Score 0
(Not up or down)
Intermediate Downtrend: Score -2
(Lower highs and lower lows)
Outperformance relative to the S&P 500 Index: Score: 2
Neutral Performance relative to the S&P 500 Index: 0
Underperformance relative to the S&P 500 Index: Score –2
Above 20 day moving average: Score 1
At 20 day moving average: Score: 0
Below 20 day moving average: –1
Up trending momentum indicators (Daily Stochastics, RSI and MACD): 1
Mixed momentum indicators: 0
Down trending momentum indicators: –1
Technical scores range from -6 to +6. Technical buy signals based on the above guidelines start when a security advances to at least 0.0, but preferably 2.0 or higher. Technical sell/short signals start when a security descends to 0, but preferably -2.0 or lower.
Long positions require maintaining a technical score of -2.0 or higher. Conversely, a short position requires maintaining a technical score of +2.0 or lower
Changes Last Week
Notes for the interview on Michael Campbell’s Money Talks
Don Vialoux was a guest on Michael Campbell’s radio show on Saturday. Following are notes developed for the interview:
North American equity markets currently are in their strongest 12 week period of the year from the second week in October to the first week in January. On average during the past 20 periods, the TSX Composite Index has gained 4.2% per period and the S&P 500 has advanced 5.4% per period. Strength is related to an improvement in the economy during the Christmas buying season. What about this year? Investors and consumers are in a pent-up “buying mood” as COVID 19 infections subside.
Strongest three week period for North American equity markets is from December 14th to January 6th. This period is better known as “The Santa Claus Rally” period. Since 1990, the S&P 500 Index has gained 74% of the time and the TSX Composite Index has advanced 87% of the time. Reasons for strength include the following:
· Consumers are in a good mood for the holiday
· Employees receive year-end bonuses that partially are investing in equity markets
· Tax loss selling pressures prior to year-end have passed their peak
· Institutional activity is diminished as traders go on holidays and retail investors have a greater influence.
· Investment dealers release bullish year-end reports highlighting the best investment opportunities for the next year.
What about this year? The opportunity to take losses for tax purposes prior to year-end have diminished because equity prices have been exceptionally strong throughout the year. Only a few sectors currently are recording losses during 2021 and are vulnerable to tax loss selling pressures. These sectors include precious metals stocks, Chinese stocks and cannabis stocks. When tax loss selling pressures abate (traditionally by mid-December), these sectors could recover significantly.
A caveat for strength in equity markets during the current December 14th to January 6th period! The U.S. Federal Reserve’s next meeting to determine U.S. monetary policy is scheduled on December 14th and December 15th. If the Federal Reserve decides to accelerate its program to temper purchases of government fixed income securities, equity markets are likely to respond significantly on the downside. However, the Federal Reserve probably will not want to be “the Grinch that stole Christmas” and likely will not change policy at this meeting.
What sectors are likely to outperform equity markets between now and early next year?
1. Sectors that will benefit from the recently passed $1.1 trillion U.S. infrastructure program approved by Congress. Sectors include industrial companies receiving contracts to build infrastructure and companies providing materials used in the infrastructure program (e.g. base metals, steel, plastics, lumber).
2. Sectors that will benefit from a recovery by economies in the Far East (notably China). Sectors include companies producing base metals, lumber and agriculture products. The Chinese economy is expected to be bolstered by plans to prepare and host the Winter Olympic Games in Beijing in February.
Notable equities and ETFs that are top investment candidates to hold into early 2022 include:
· Forest products equities and ETFs: ETFs include WOOD and CUT
· Base metal equities and ETFs: ETFs include XBM.TO, PICK, COPX, XME
· Agriculture equities and ETFs: MOO, COW.TO
And one more! The recovery by North American economies has prompted a strong increase in inflation pressures. The Consumer Price Index in the U.S. recently jumped to 6.2% on a year-over-year basis in October. Recent passage of a $1.1 trillion infrastructure bill will add to inflation pressures. Inflation pressures will accelerate if President Biden’s “Build Back Better” bill valued at an additional $1.9 trillion if approved by Congress. Since August, rising consumer prices have prompted the price of precious metals and related equities to move higher. Massive new government spending programs will accelerate inflation pressures and add to the outlook for precious metals and related equities
Precious metals and related stocks could move higher for another reason: ‘Tis the season for precious metals prices and related equity prices to move higher from mid-December to the end of February. Strength is related to the production and sale of precious metal jewelry in China for gifts exchanged during the Chinese New Year’s. In 2022, Chinese New Year is celebrated on February 1st.
The easiest way for Canadians to participate in the gold sector is through a gold equity ETF (e.g.XGD.TO). Last week, the TSX Gold Index and its related ETFs completing bullish reverse Head and Shoulders patterns on the charts. Any weakness by the sector between now and mid-December will provide a buying opportunity.
Links offered by Valued Providers
Michael Campbell’s Money Talks
(includes the interview with Don Vialoux)
November 20th Episode of MoneyTalks (mikesmoneytalks.ca)
Thank you to David Chapman and www.enrichedinvesting.com for a link to the weekly Technical Scoop
To be added
David Keller is the Mindful Investor
Five Stocks I’m Watching Next Week | The Mindful Investor | StockCharts.com
Thank you to Mark Bunting and www.uncommonsenseinvestor.com to links to the following comments and links:
Catalysts Could Multiply Stock of Revived Global Playboy Brand by 10X – Uncommon Sense Investor
Watch For Resurgent Amazon in 2022 – Uncommon Sense Investor
Why Green Doesn’t Mean Clean – Uncommon Sense Investor
Technical Notes released on Friday at
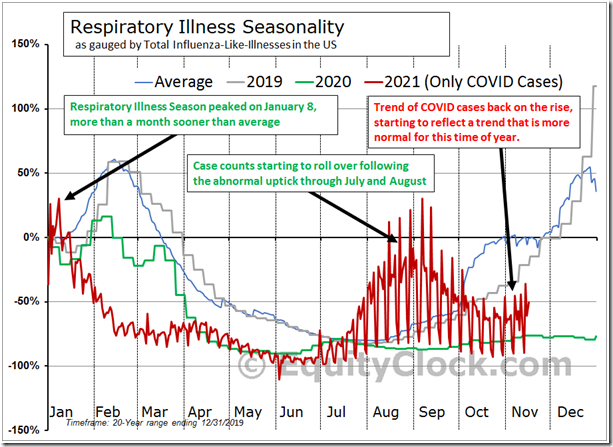
The rise in COVID cases is causing a stir in the market. Read our thoughts in today’s report. equityclock.com/2021/11/18/… $MACRO $STUDY #Economy #COVID $IYT $VOOG $VOOV $IVE $IVW
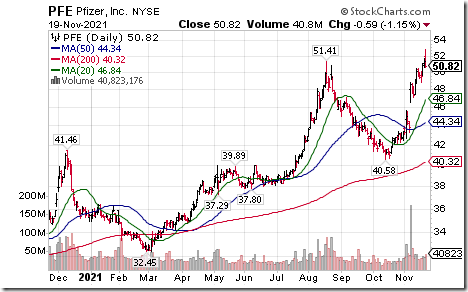
Pfizer $PFE a Dow Jones Industrial Average stock moved above $51.41 to an all-time high. The company received approval in the U.S. for use of its COVID 19 vaccine by children aged 5-11
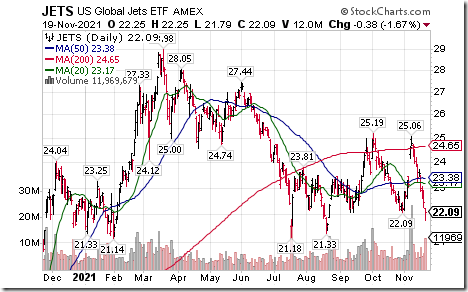
Airline ETF JETS moved below support at $22.09 setting an intermediate downtrend. Units are responding to news that COVID 19 infections in Europe are rising again.
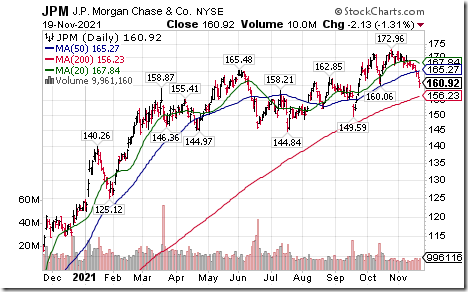
U.S. Bank stocks are under technical pressure. JP Morgan $JPM a Dow Jones Industrial Average stock moved below $160.06 completing a double top pattern. Banks are responding to a narrowing of long term/short term interest rate spreads.
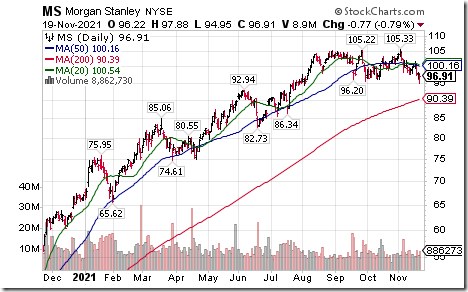
Another major U.S. Bank breakdown! Morgan Stanley $MS an S&P 100 stock moved below $95.59 completing a double top pattern.
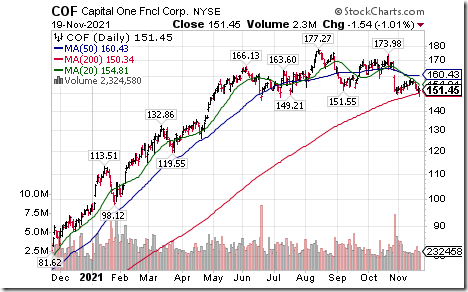
Another U.S. bank breakdown! Capital One $COF moved below $149.65 completing a Head & Shoulders pattern.
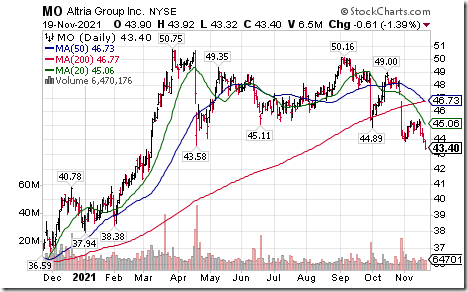
Altria $MO an S&P 100 stock moved below $43.58 completing an extended double top pattern.
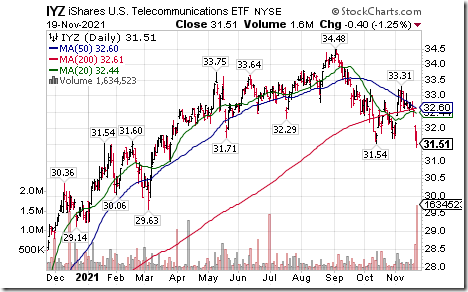
U.S. Telecom iShares $IYZ moved below $31.54 completing a Head & Shoulders pattern.
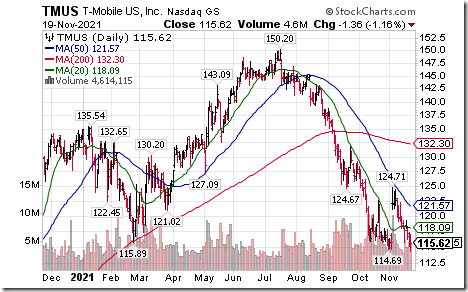
T Mobile $TMUS a NASDAQ 100 stock moved below $114.69 extending an intermediate downtrend.
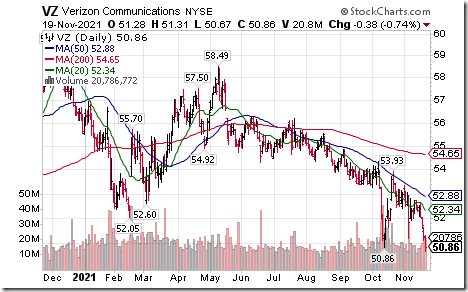
Verizon $VZ an S&P 100 stock moved below $50.86 extending an intermediate downtrend.
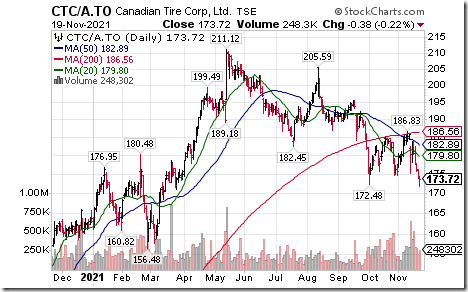
Canadian Tire $CTC.A.CA a TSX 60 stock moved below $172.48 extending an intermediate downtrend. Impacted by floods in British Columbia.
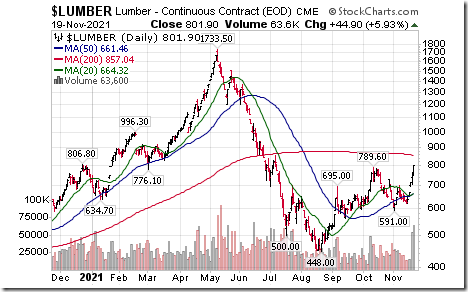
Lumber prices $LUMBER moved above $789.60 extending an intermediate uptrend.
S&P 500 Momentum Barometers
The intermediate term Barometer dropped another 3.81 to 62.53 on Friday and 11.22 last week to 62.53. It remains Overbought and trending down.
The long term Barometer dropped 1.40 on Friday and 4.81 last week to 70.74. It remains Overbought and trending down.
TSX Momentum Barometers
The intermediate term Barometer dropped 3.59 on Friday and 9.11 last week to 65.42. It remains Overbought and is trending down.
The long term Barometer dropped 2.21 on Friday and 4.91 last week to 70.09. It remains Overbought and is trending down.
Disclaimer: Seasonality and technical ratings offered in this report and at
www.equityclock.com are for information only. They should not be considered as advice to purchase or to sell mentioned securities. Data offered in this report is believed to be accurate, but is not guaranteed
This post was originally publised at Vialoux's Tech Talk.


