by Don Vialoux, EquityClock.com
Technical Notes released yesterday at
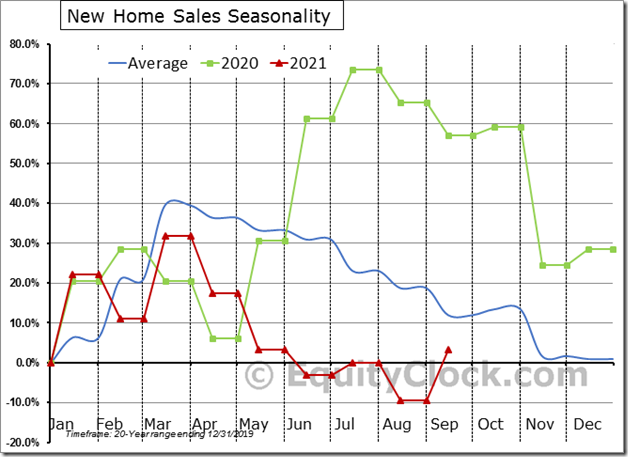
New Home Sales showed an abnormal jump last month, rising by 14.0%, representing the second largest September increase on record. The average change is a decline of 5.5%. $MACRO $STUDY $XHB $ITB $LEN $PHM $TOL #Economy #Housing
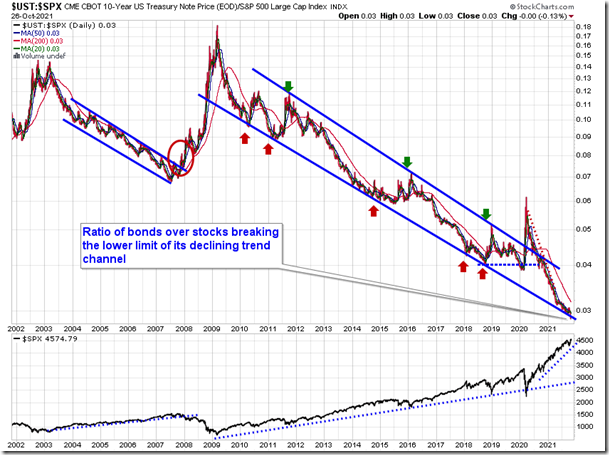
The ratio of bonds over stocks has broken below declining trendline support that has been intact for over a decade, but the move just confirms our bias towards the latter. equityclock.com/2021/10/26/… $STUDY $SPX $SPY $IEF $TLT
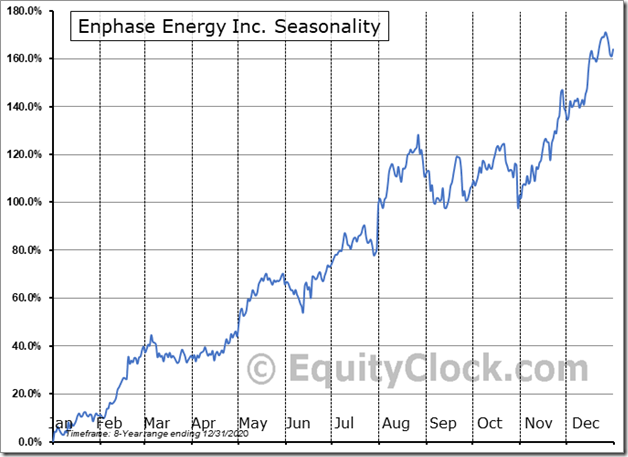
Clean energy stock Enphase surging by almost 30% today following a strong earnings report for the third quarter. We provided favorable comments on the stock and the industry in our Market Outlook for October 25th. Seasonally, the stock tends to gain, on average, through the last couple of months of the year. $ENPH $TAN $ICLN
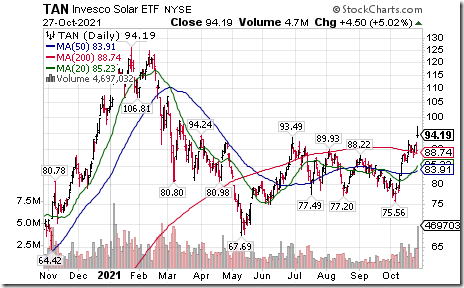
Solar ETF $TAN moved above $93.49 resuming an intermediate uptrend.
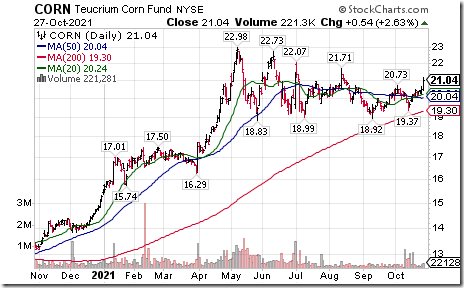
Corn ETN $CORN moved above $20.73 setting a short term uptrend.
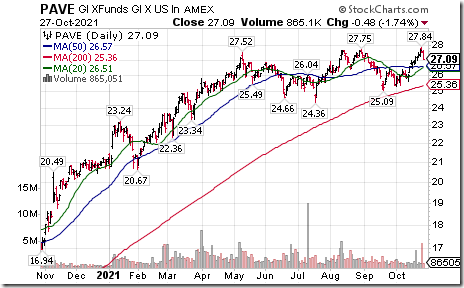
U.S. infrastructure ETF $PAVE moved above $27.75 to an all-time high extending an intermediate uptrend. Responding to imminent expectation for signing of an infrastructure bill by U.S. Congress
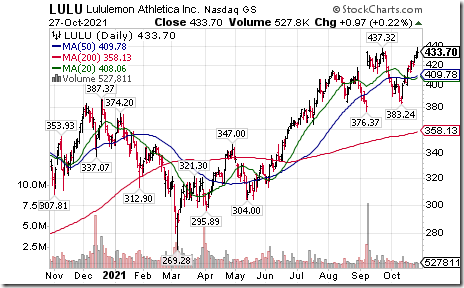
Lululemon $LULU a NASDAQ 100 stock moved above $437.32 to an all-time high extending an intermediate uptrend.
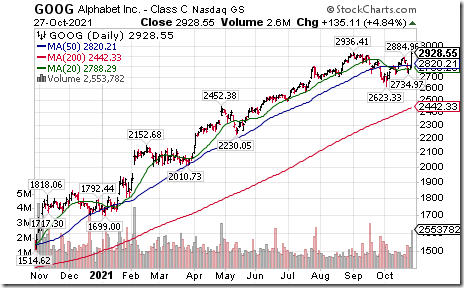
Alphabet $GOOG a NASDAQ 100 stock moved above $2936.41 to an all-time high extending an intermediate uptrend.
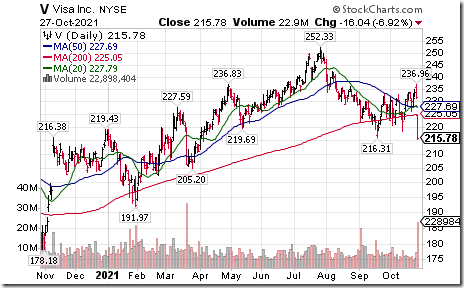
Visa $V an S&P 100 stock moved below $216.31 completing a Head & Shoulders pattern.
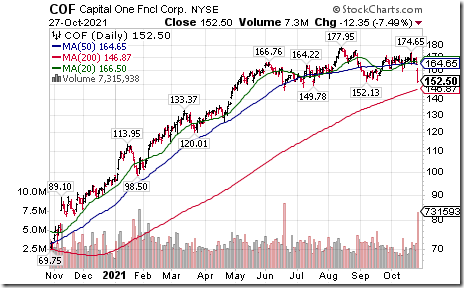
Capital One $COF an S&P 100 stock moved below $152.13 completing a Head & Shoulders pattern.
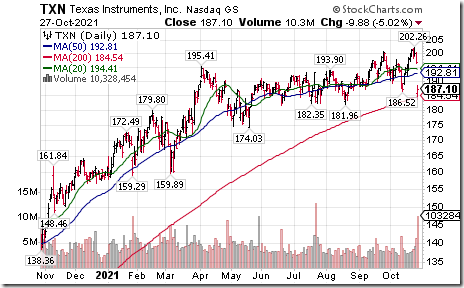
Texas Instruments $TXN a NASDAQ 100 stock moved below support at $186.52 following release of less than consensus third quarter revenues.
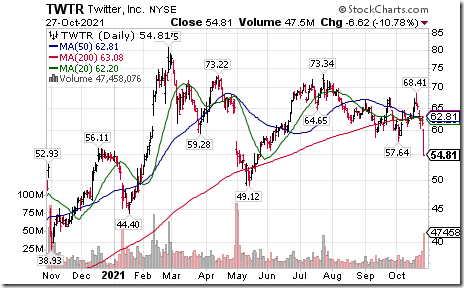
Twitter $TWTR a NASDAQ 100 stock moved below $57.64 following release of quarterly results extending an intermediate downtrend.
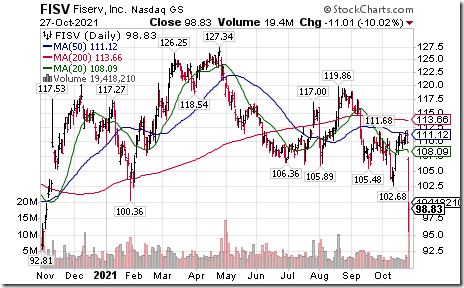
Fiserv $FISV a NASDAQ 100 stock moved below $102.68 and $100.36 extending an intermediate downtrend
Trader’s Corner
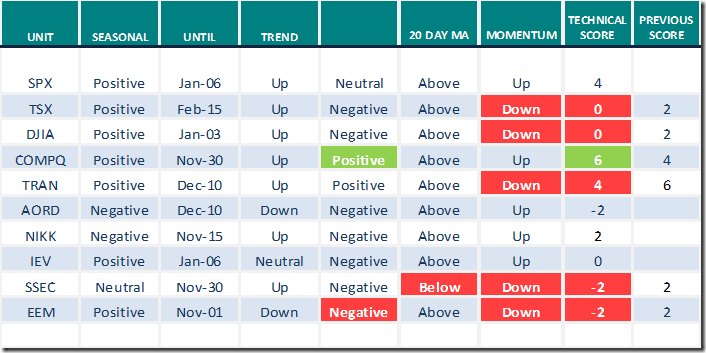
Equity Indices and Related ETFs
Daily Seasonal/Technical Equity Trends for Oct.27th 2021
Green: Increase from previous week
Red: Decrease from previous week
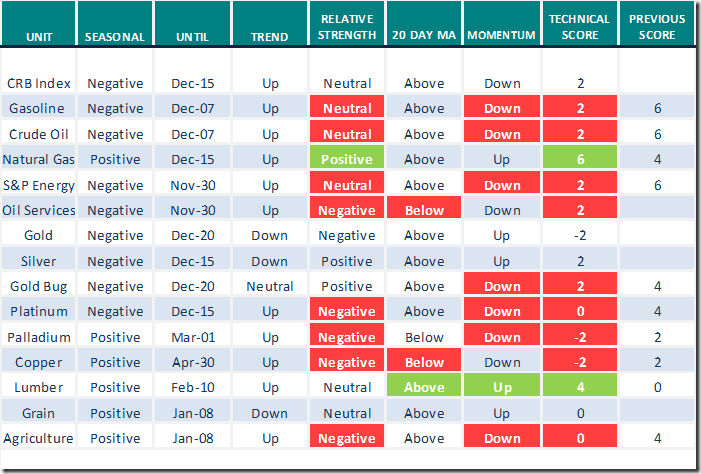
Commodities
Daily Seasonal/Technical Commodities Trends for Oct.27th 2021
Green: Increase from previous week
Red: Decrease from previous week
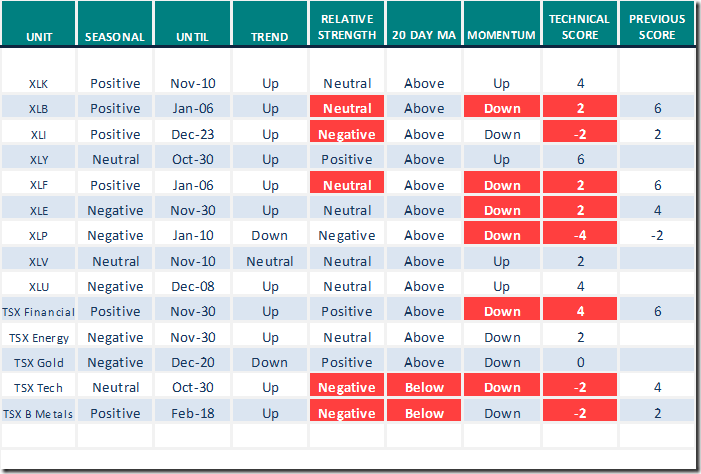
Sectors
Daily Seasonal/Technical Sector Trends for Oct.27th 2021
Green: Increase from previous week
Red: Decrease from previous week
All seasonality ratings are based on performance relative to the S&P 500 Index (except TSX)
Links offered by valued providers
Thank you to Mark Bunting and www.uncommonsenseinvestor.com for the following links:
BANG: Why Gold Miners Could Make FAANG Look Tame – Uncommon Sense Investor
Editor’s Note: Period of seasonal strength for the sector starts in mid-December.
Editor’s Note: Another favourable comment on precious metals, but from a different angle.
Market Buzz by Greg Schnell
Headline reads, “Charting to Bitcoins and Tesla to trade”
https://www.youtube.com/watch?v=jthbJSD93oM
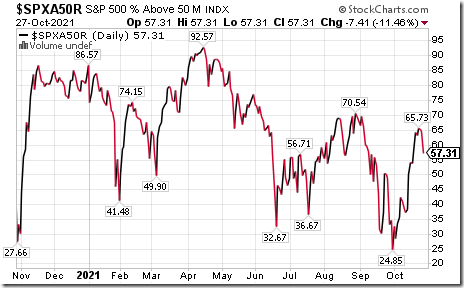
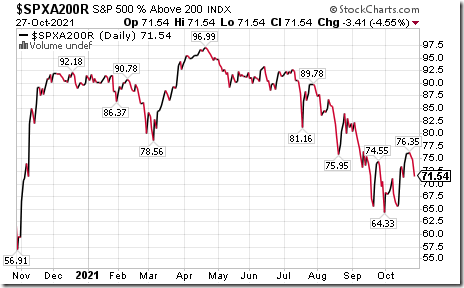
S&P 500 Momentum Barometers
The intermediate term Barometer dropped 7.41 to 57.31 yesterday. It changed from Overbought to Neutral on a drop below 60.00.
The long term Barometer dropped 3.41 to 71.54 yesterday. It remains Overbought.
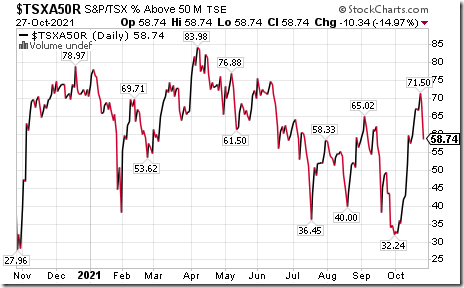
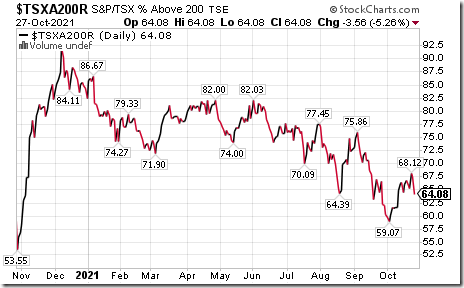
TSX Momentum Barometers
The intermediate term Barometer plunged 10.34 to 58.74 yesterday. It changed from Overbought to Neutral on a move below 60.00.
The long term Barometer dropped 3.58 to 64.08 yesterday. It remains Overbought.
Disclaimer: Seasonality and technical ratings offered in this report and at
www.equityclock.com are for information only. They should not be considered as advice to purchase or to sell mentioned securities. Data offered in this report is believed to be accurate, but is not guaranteed
This post was originally publised at Vialoux's Tech Talk.


