
by Brian Levitt, Invesco Canada
Brian Levitt explains why inflation may not be as transitory as he first hoped, and what he expects to see for the U.S. stock market and economy going forward.
I have found myself working my way from denial to acceptance of the inflation situation. It’s almost reminiscent of the Kubler-Ross Model — denial, anger, bargaining, depression, acceptance — although I’m by no means equating the evolution in my thinking with the process of grieving. Rather, what strikes me has been my need to progress through distinct stages to get to the acceptance that inflation may be less transitory than initially hoped.
Below are the stages that I’ve been through on my way to acceptance of the inflation situation. Read along for a look inside my thought process as the inflation picture became clearer over the course of this year—and what I’m expecting to see going forward.
Stage 1: Denial
Inflation wasn’t on my mind in the early days of the pandemic. After all, shutting down large segments of an economy is inherently deflationary. As demand falls, then prices fall, then wages fall, then demand falls, and so on, in what could become a potentially vicious cycle. Policymakers responded to protect the global financial system and to bridge the hardest hit U.S. businesses and households through what would prove to be a very difficult time. I applauded their efforts and shuddered to contemplate the outcome of a less forceful response.
Stage 2: Frustration
As stimulus checks were deposited into Americans’ bank accounts, inflation concerns started to bubble to the surface. But in my mind, the naysayers were overstating the inflation risk. Survey after survey has suggested that Americans have been treating the government support as income replacement, and not as an excuse to go on a spending spree.1 In fact, a large majority of Americans report using the assistance to add to savings or to pay down debt. As for the concerns that “coddled” Americans won’t return to the workforce, the economy has added over 5 million jobs this year, with all but 194,000 of those jobs coming before the extended unemployment benefits lapsed in early September.2
Stage 3: Bargaining
We started to see price increases in the consumer basket, but the biggest ones could all be easily explained. Rental car prices were up because the rental car companies had shed much of their fleets just as Americans were returning to travel. Lodging prices were up as we unleashed our pent-up demands to get out of the house.3 But I didn’t expect that to persist — how many vacations can we take? Plus, the market has been taking it all in stride. The 10-year U.S. Treasury rate is below its 2021 peak in late March.4 For all the concern about longer-duration equities and speculative growth companies (businesses that are likely to be more adversely affected by inflation because they receive their cash flows well out in the future), the Russell 1000 Growth Index is up over 15% this year.5
Stage 4: Humility
Reality starts to bite. There’s more than enough anecdotal evidence of price increases to suggest that the supply-chain problems are real and will take time to alleviate. I underappreciated the adverse effects of turning the economy on like a light switch before businesses had time to rebuild inventories and bring back workers. Compounding the problem, many of the manufacturing hubs of the world, including Vietnam and Thailand, were dealing with their own COVID challenges as Americans were unleashing their pent-up demand.6 Freight costs have been rising significantly as vessels struggle to unload their wares at ports in a timely fashion.7
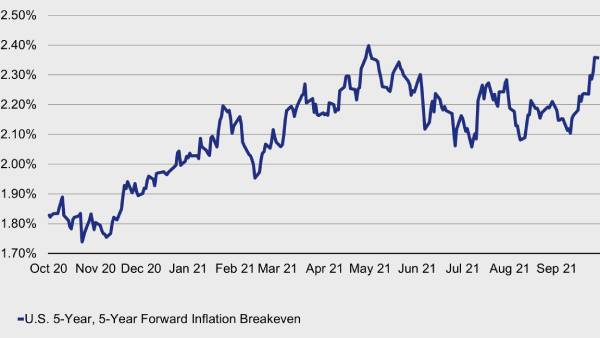
The U.S. bond market, which I believe gets it right more often than any other indicator, is taking notice. For example, the U.S. 5-year, 5-year forward inflation breakeven, an estimate of inflation expectations for the five-year period that begins five years from the present, appears to be breaking out as it did earlier this year.8
Inflation expectations: the U.S. 5-year, 5-year forward inflation breakeven
Stage 5: Acceptance
If it looks like a duck, swims like a duck, and quacks like a duck, then it’s probably a duck (but not a “black swan” which by definition we couldn’t have even seen forthcoming). As they say, inflation is too much money chasing after too few goods. And it’s clear to me that the supply chain challenges will not disappear overnight, and household demand is likely to remain strong.
But to what end? Ultimately, I still expect inflationary pressures to moderate over time. For one, the solution to higher prices is often higher prices. A few more times of spending $50 at the gas pump is likely to erode my demand for other items. Two, the structural forces against inflation—aging populations, automated workforces, technology-driven productivity gains, and globalization —have not gone away. Given all that, I view this as a unique moment in time driven by a once-in-a-century pandemic, and it will take time to work through the challenges.
What then have I accepted? I accept that the risk to the U.S. stock market and economy is currently greater than it typically is at this point in the business cycle. Markets don’t like policy uncertainty. If persistent inflation brings forward market expectations that the U.S. Federal Reserve (Fed) will tighten monetary policy, then a bout of volatility will likely be in the offing. Still, I’d be hard pressed to expect the type of policy tightening that ends cycles. Rather I’d expect inflationary pressures to moderate as supply chain challenges are gradually alleviated, demand to stabilize, and for the Fed to not have to take away the proverbial punchbowl at the party prematurely. I view this period as a transition to a more normalized growth and inflation environment.
As George Orwell said, “Happiness can exist only in acceptance.” I’m mentally prepared for the new near-term reality, but maintain conviction that the duration of the current market and business cycles will ultimately be measured in years, not months.
1 Source: U.S. Census Bureau Household Pulse Survey, September 2021
2 Source: U.S. Bureau of Labor Statistics, September 2021
3 Source: U.S. Bureau of Labor Statistics, September 2021
4 Source: Bloomberg, as of Oct. 11, 2021
5 Source: Bloomberg, as of Oct. 11, 2021. The Russell 1000 Growth Index measures the performance of those Russell 1000 companies with higher price-to-book ratios and higher forecasted growth values. Indices cannot be purchased directly by investors. Past performance does not guarantee future results.
6 Source: Bloomberg, September 2021
7 Source: Drewry World Container Index. Based on the World Container Index Composite Container Freight Benchmark Rate per 40 Foot Box. The World Container Index assessed by Drewry reports actual spot container freight rates for major East West trade routes, consisting of eight route-specific indices representing individual shipping routes and a composite index.
8 Source: Bloomberg, as of Oct. 11, 2021
This post was first published at the official blog of Invesco Canada.