by Don Vialoux, EquityClock.com
Technical Notes released yesterday at
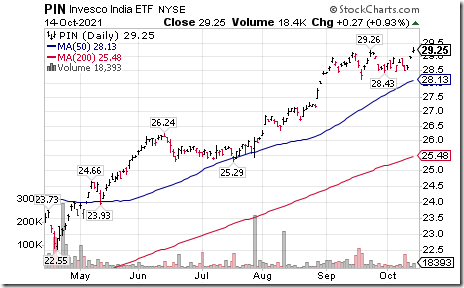
India ETF $PIN moved above $29.26 to an all-time high extending an intermediate uptrend.
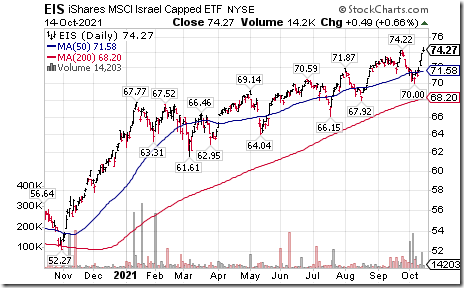
Israel iShares $EIS moved above $74.22 to an all-time high extending an intermediate uptrend.
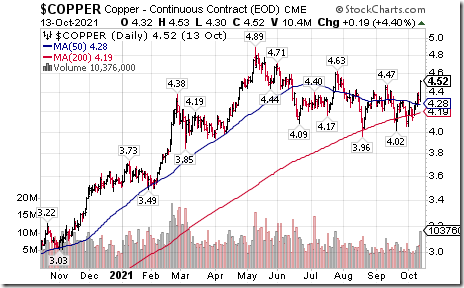
Spot copper futures $COPPER moved above $4.47 per lb. setting an intermediate uptrend.
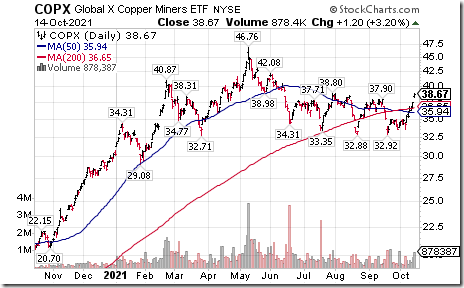
Copper Miners ETF $COPX moved above $38.80 resuming an intermediate uptrend.
Editor’s Note: Seasonal influences for COPX on a real and relative basis are favourable until mid-February. See:
https://charts.equityclock.com/global-x-copper-miners-etf-nysecopx-seasonal-chart
Access to seasonality charts is available to subscribers of www.EquityClock.com
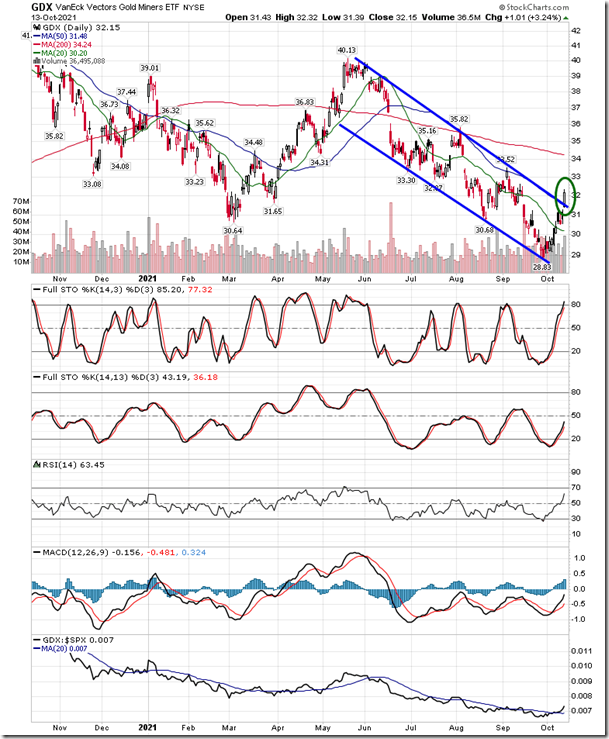
Metal prices are on the move. equityclock.com/2021/10/13/… $GDX $GDXJ $NUGT $JNUG $DUST $JDST
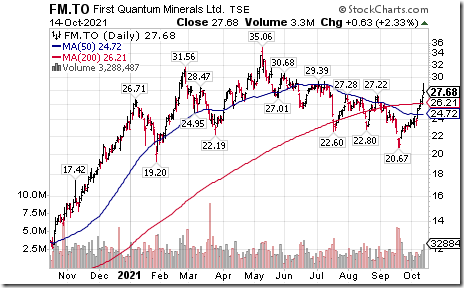
First Quantum Minerals $FM.CA a TSX 60 stock moved above $27.22 and $27.28 setting an intermediate uptrend.
Seasonal influences are favourable on a real and relative basis until the end of February. See:
https://charts.equityclock.com/first-quantum-minerals-limited-tsefm-seasonal-chart
Access to seasonality charts is available for subscribers of www.EquityClock.com
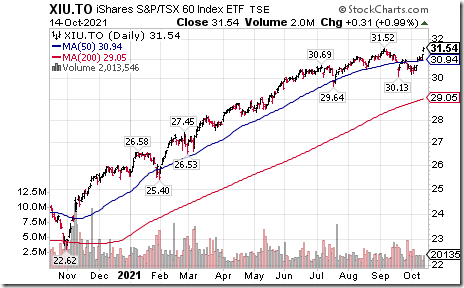
TSX 60 iShares $XIU.CA moved above $31.52 to an all-time high extending an intermediate uptrend.
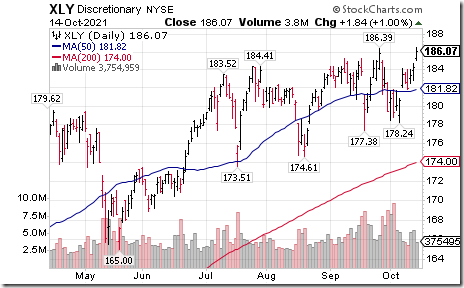
Consumer Discretionary SPDRs $XLY moved above $186.39 to an all-time high extending an intermediate uptrend.
Editor’s Note: Seasonal influences are favourable on a real and relative basis until at least the end of November. See: https://charts.equityclock.com/first-quantum-minerals-limited-tsefm-seasonal-chart
Access to seasonality charts is available for www.EquityClock.com subscribers.
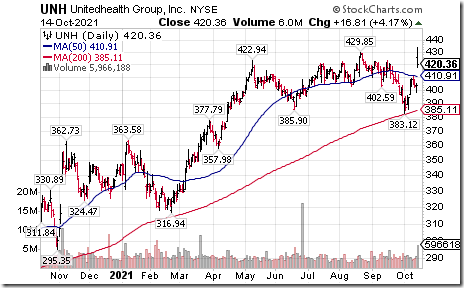
UnitedHealth Group $UNH a Dow Jones Industrial Average stock moved above $429.85 to an all-time high after releasing better than consensus quarterly results.
Editor’s Note: Seasonal influences are favourable on a real and relative basis until the end of January. See: https://charts.equityclock.com/unitedhealth-group-inc-nyseunh-seasonal-chart
Access to seasonality charts is available for www.EquityClock.com subscribers.
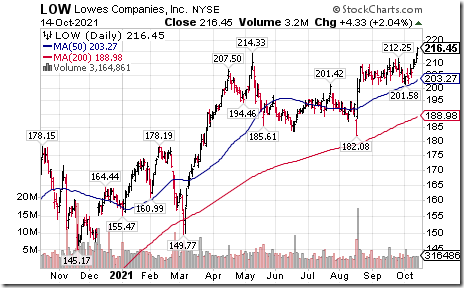
Lowe’s Companies $LOW an S&P 100 stock moved above $214.33 to an all-time high extending an intermediate uptrend.
Editor’s Note: Seasonal influences on a real and relative basis are favourable until the end of February. See: https://charts.equityclock.com/lowes-companies-inc-nyselow-seasonal-chart
Access to seasonality charts is available to www.EquityClock.com subscribers.
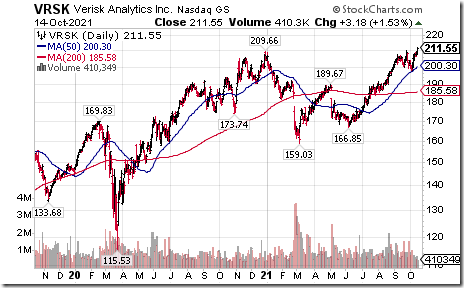
Verisk Analytics $VRSX a NASDAQ 100 stock moved above $209.66 to an all-time high extending an intermediate uptrend.
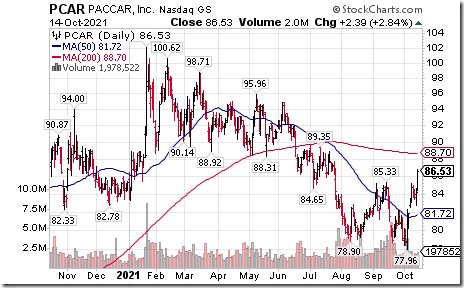
Paccar $PCAR a NASDAQ 100 stock moved above $85.33 completing a double bottom pattern.
Editor’s Note: Seasonal influences on a real and relative basis are favourable until the early January. See:
https://charts.equityclock.com/paccar-inc-nasdaqpcar-seasonal-chart
Access to seasonality charts is available for www.EquityClock.com subscribers.
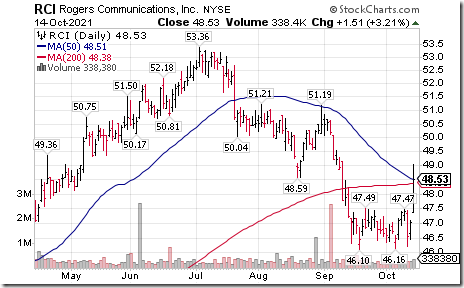
Rogers Communications $RCI a TSX 60 stock moved above US$47.49 completing a double bottom pattern.
Editor’s Note: Seasonal influences on a real and relative basis are favourable until late January. See: https://charts.equityclock.com/rogers-communications-inc-tserci-b-seasonal-chart
Access to seasonality charts is available for www.EquityClock.com subscribers.
Trader’s Corner
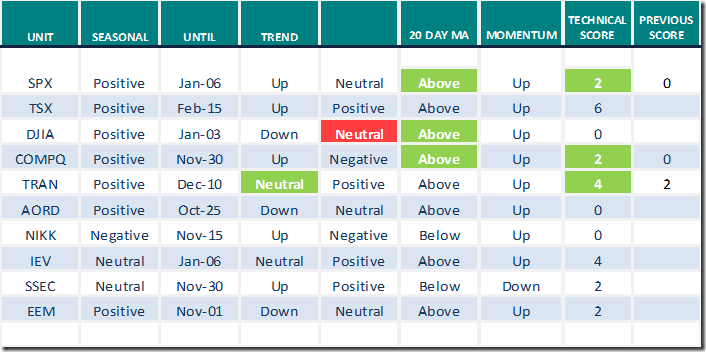
Equity Indices and Related ETFs
Daily Seasonal/Technical Equity Trends for Oct.14th 2021
Green: Increase from previous day
Red: Decrease from previous day
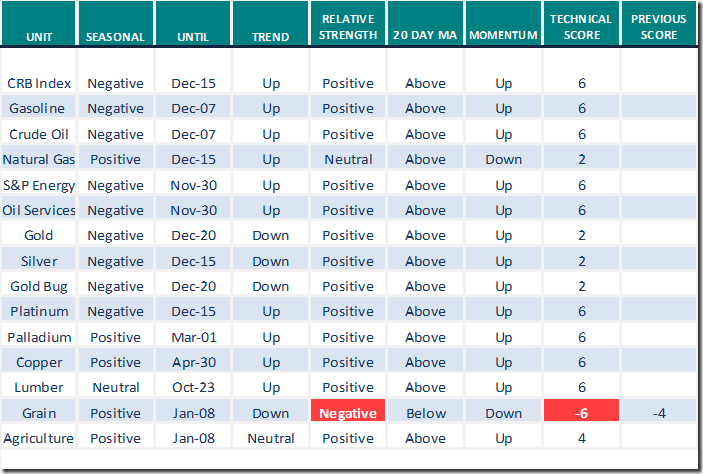
Commodities
Daily Seasonal/Technical Commodities Trends for Oct.14th 2021
Green: Increase from previous day
Red: Decrease from previous day
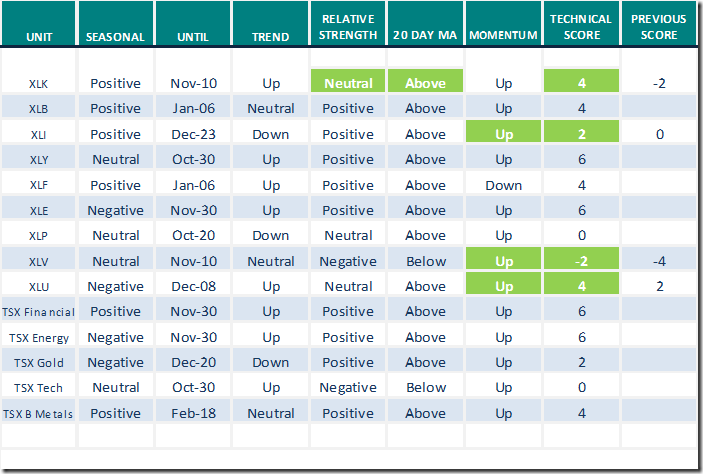
Sectors
Daily Seasonal/Technical Sector Trends for Oct.14th 2021
Green: Increase from previous day
Red: Decrease from previous day
All seasonality ratings are based on performance relative to the S&P 500 Index (except TSX)
Seasonality Chart of the Day from www.EquityClock.com
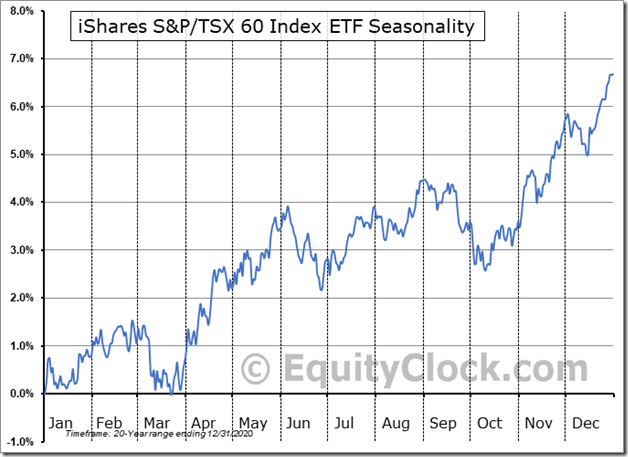
Seasonal influences on a real basis for the TSX Composite Index, TSX 60 Index and related ETFs (e.g. XIU) turned positive this week for a seasonal trade lasting until at least the end of the year and frequently to the end of February.
XIU broke to an all-time high yesterday. See previous price chart.
S&P 500 Momentum Barometers
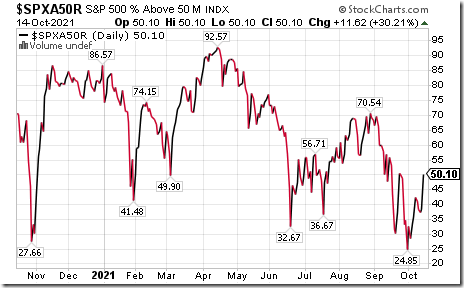
The intermediate term Barometer advanced 11.62 to 50.10 yesterday. It changed from Oversold to Neutral on a recovery above 40.00 and is trending higher.
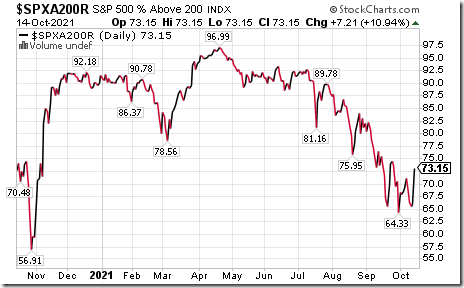
The long term Barometer added 7.21 to 73.15 yesterday. It remains Overbought.
TSX Momentum Barometers
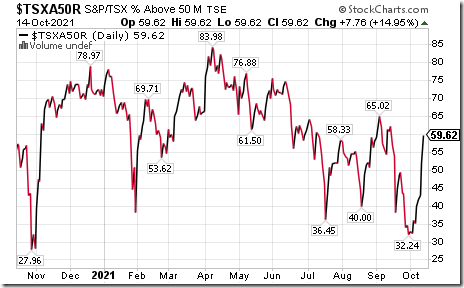
The intermediate Barometer jumped 7.76 to 59.62 yesterday. It remains Neutral and trending up.
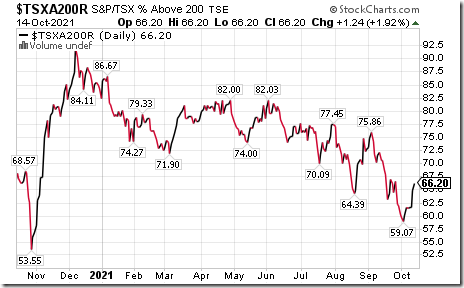
The long term Barometer added 1.24 to 66.20 yesterday. It remains Overbought and trending up.
Disclaimer: Seasonality and technical ratings offered in this report and at
www.equityclock.com are for information only. They should not be considered as advice to purchase or to sell mentioned securities. Data offered in this report is believed to be accurate, but is not guaranteed
This post was originally publised at Vialoux's Tech Talk.


