by Don Vialoux, EquityClock.com
Technical Notes released yesterday at
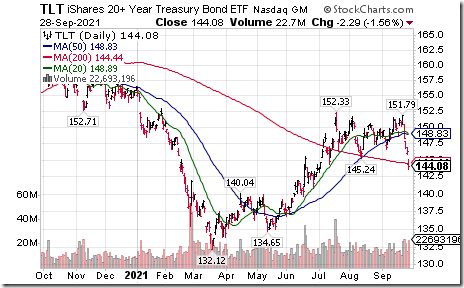
Long term Treasury Bond iShares $TLT moved below $145.24 completing a double top pattern.
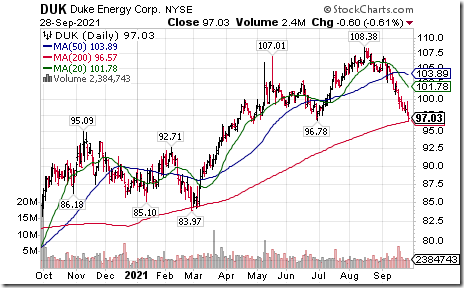
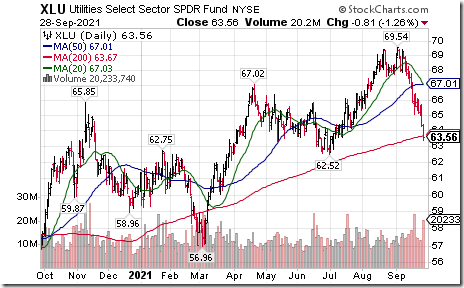
Interest sensitive U.S. utilities stocks are responding to weakness in U.S. Treasury prices. Duke
Energy $DUK an S&P 100 stock moved below support at $96.78 extending an intermediate downtrend.
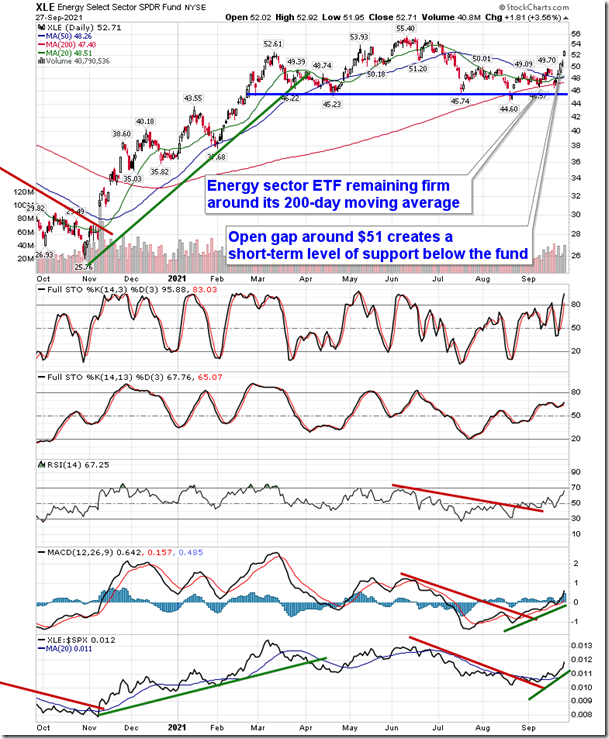
Following weeks of sector downgrades amidst the period of seasonal weakness for stocks, today we flip the script. Find out what we have upgraded to Accumulate in today’s report. equityclock.com/2021/09/27/… $XLU $XLI $XLB $XLF $XLK $XLV $XLE
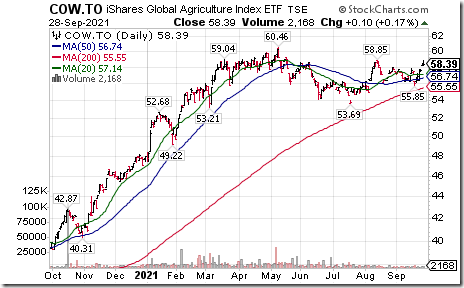
Agriculture iShares $COW.CA moved above Cdn$58.85 setting an intermediate uptrend.
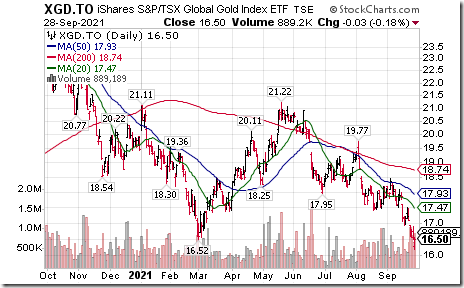
Canadian Gold iShares $XGD.CA moved below $16.52 extending an intermediate downtrend
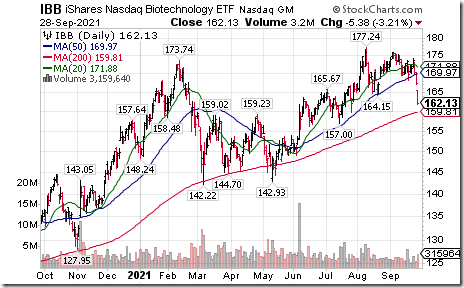
Biotech ETFs $BBH and $IBB moved below intermediate support at $205.75 and $164.15 respectively completing double top patterns.
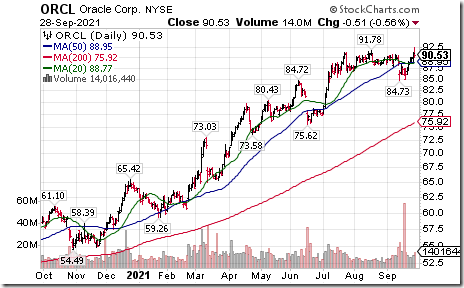
Oracle $ORCL an S&P 100 stock moved above $91.78 to an all-time high extending an intermediate uptrend.
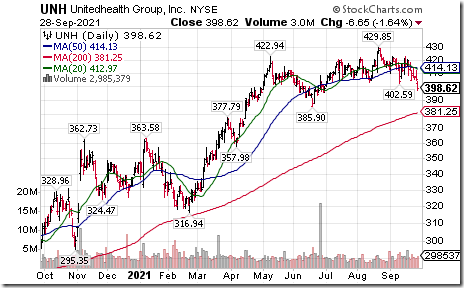
UnitedHealth Services $UNH a Dow Jones Industrial Average stock moved below $402.59 completing a Head & Shoulders pattern.
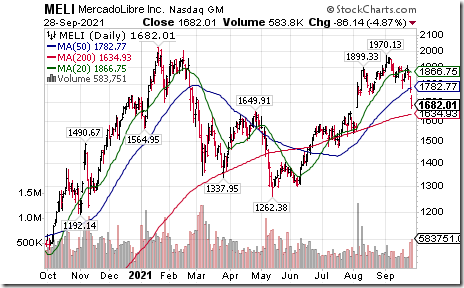
MercadoLibre $MELI a NASDAQ 100 stock moved below intermediate support at $1,744.64
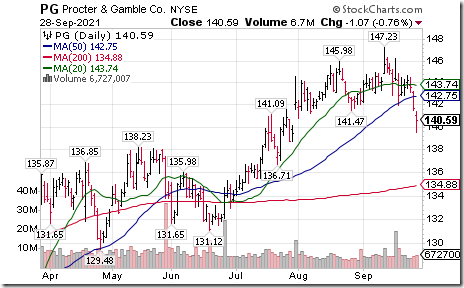
Procter & Gamble $PG a Dow Jones industrial Average stock moved below intermediate support at $141.47
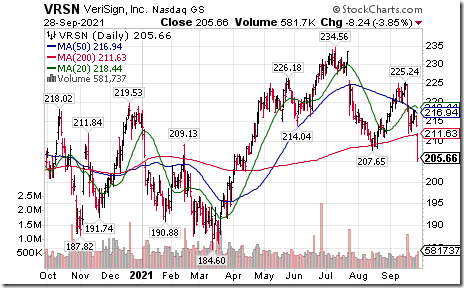
Verisign $VRSN moved below $207.65 completing a Head & Shoulders pattern
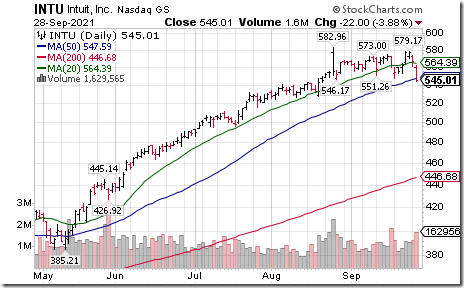
Intuit $INTU a NASDAQ 100 stock moved below 546.17 completing a double top pattern.
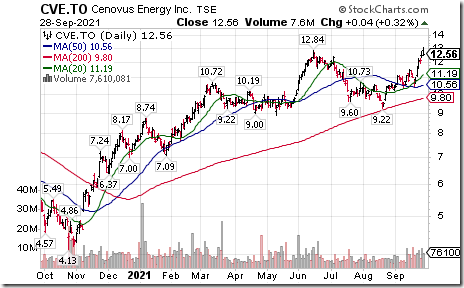
Cenovus $CVE.CA a TSX 60 stock moved above Cdn$12.84 extending an intermediate uptrend.
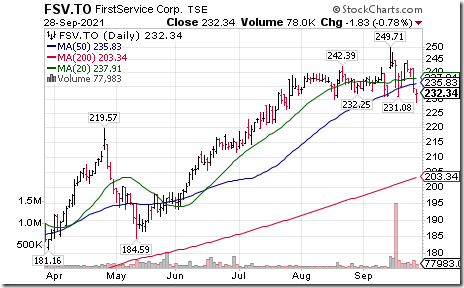
First Service $FSV.CA a TSX 60 stock moved below $231.08 completing a Head & Shoulders pattern.
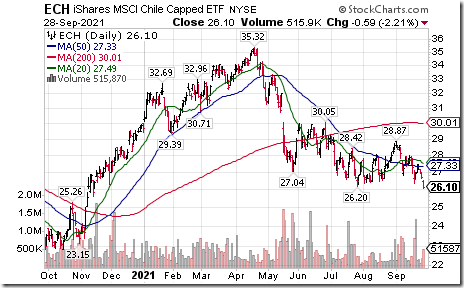
Chile iShares $ECH moved below $26.20 extending an intermediate downtrend.
Trader’s Corner
Equity Indices and Related ETFs
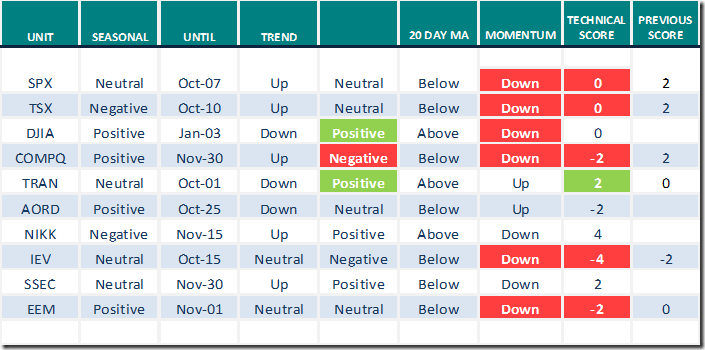
Daily Seasonal/Technical Equity Trends for September 28th 2021
Green: Increase from previous day
Red: Decrease from previous day
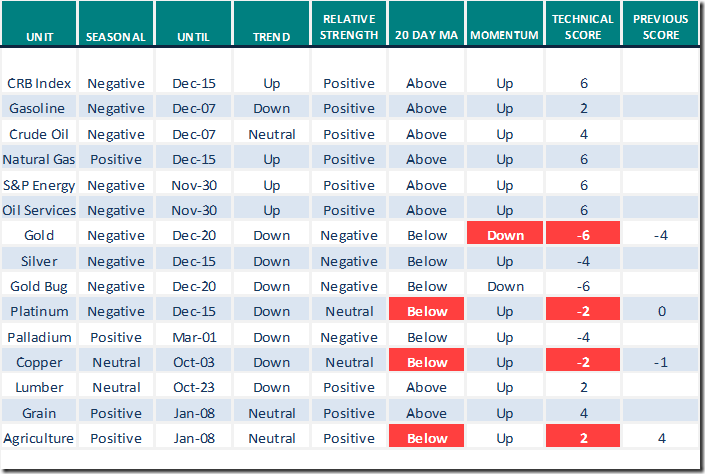
Commodities
Daily Seasonal/Technical Commodities Trends for September 28th 2021
Green: Increase from previous day
Red: Decrease from previous day
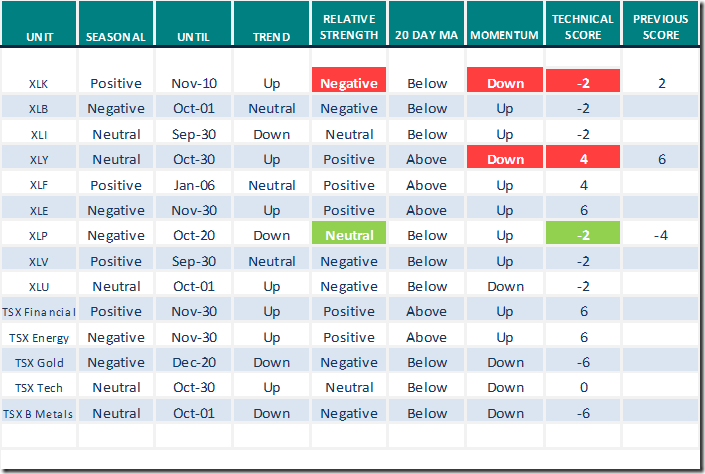
Sectors
Daily Seasonal/Technical Sector Trends for September 28th 2021
Green: Increase from previous day
Red: Decrease from previous day
All seasonality ratings are based on performance relative to the S&P 500 Index
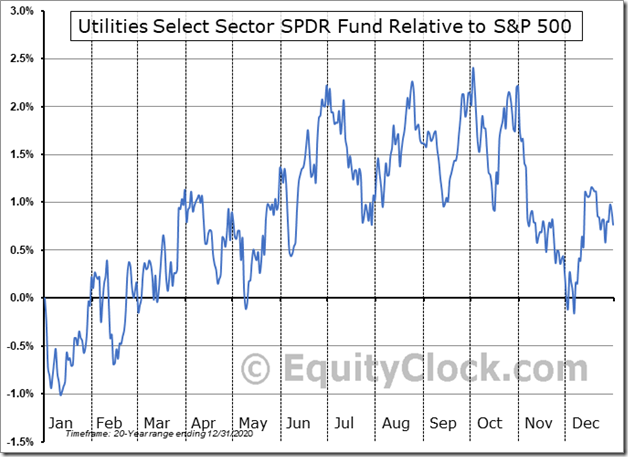
Seasonality Chart of the Day from www.EquityClock.com
U.S. utilities stocks and related ETFs have a history of moving lower relative to the S&P 500 Index between now and early December.
Seasonal influences started earlier than usual this year.
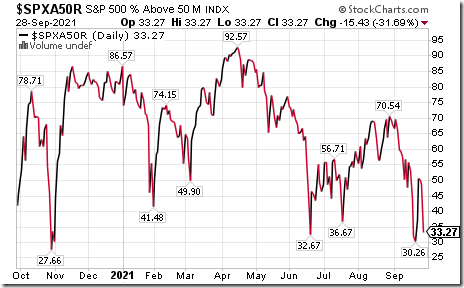
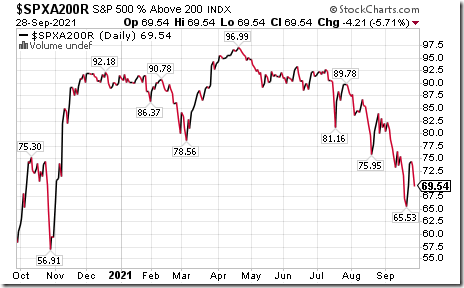
S&P 500 Momentum Barometers
The intermediate term Barometer plunged 15.43 to 33.27 yesterday. It changed from Neutral to Oversold on a move below 40.00.
The long term Barometer dropped 4.21 to 69.54 yesterday. It remains Overbought.
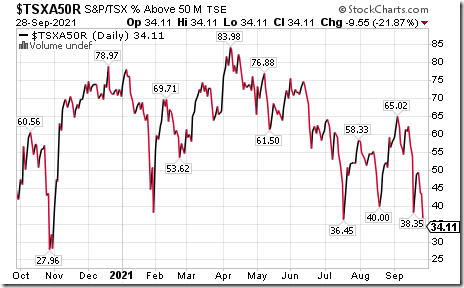
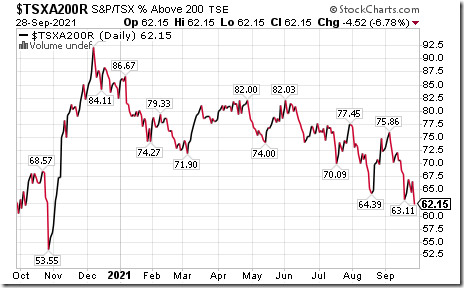
TSX Momentum Barometers
The intermediate term Barometer plunged 9.55 to 34.11 yesterday. It changed from Neutral to Oversold on a move below 40.00 and continues to trend down.
The long term Barometer dropped 4.52 to 62.15 yesterday. It remains Overbought and trending down.
Disclaimer: Seasonality and technical ratings offered in this report and at
www.equityclock.com are for information only. They should not be considered as advice to purchase or to sell mentioned securities. Data offered in this report is believed to be accurate, but is not guaranteed
This post was originally publised at Vialoux's Tech Talk.


