by Don Vialoux, EquityClock.com
The Bottom Line
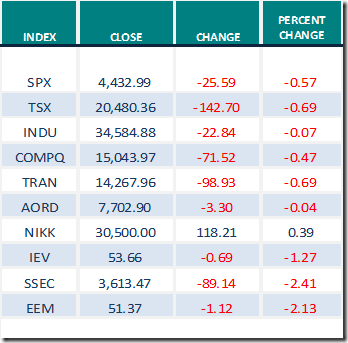
World equity indices were mostly lower again last week. Greatest influences are ramping up of a fourth wave by COVID 19 (negative) and continued expansion of distribution of a COVID 19 vaccine (positive).
Observations
North American equity indices were lower again last week. Moreover, North American equity indices have a history of recording a mild correction from their highs in September to their lows in early October. A study by www.EquityClock.com released on Thursday noted that the S&P 500 Index recorded an average drop 0.92% per period from September 19th to September 30th during the past 50 periods. The Index declined in 31 of the past 50 periods. The brief correction was followed by resumption of an intermediate uptrend to the end of the year.
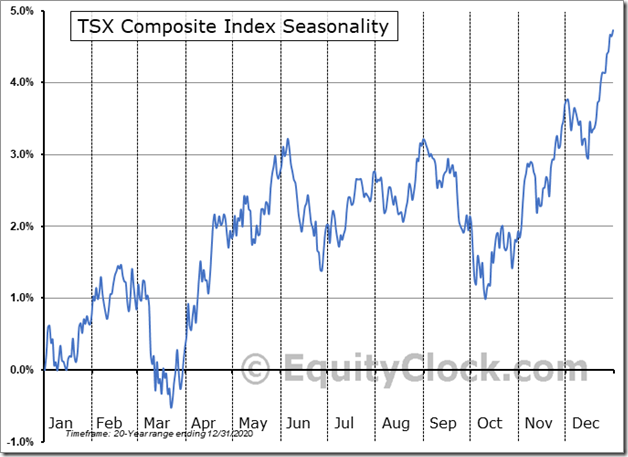
Weakness during the last two weeks in September and first week in October has been more intense during the past 20 periods for the TSX Composite Index than the S&P 500 Index. The TSX Composite Index dropped an average of 1.9% per period.
Short term short term indicators for U.S. equity indices and sectors (20 day moving averages, short term momentum indicators) continued moving lower last week.
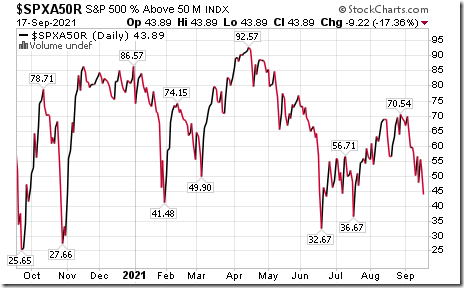
Intermediate term technical indicator for U.S. equity markets (Percent of S&P 500 stocks trading above their 50 day moving average) moved lower again last week. It remained Neutral and is trending down. See Barometer charts at the end of this report.
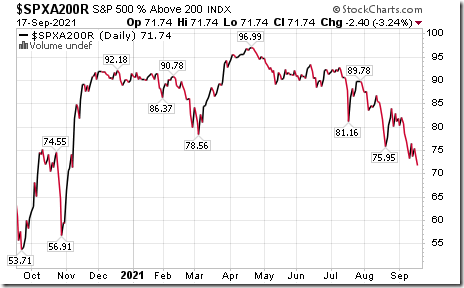
Long term technical indicator for U.S. equity markets (Percent of S&P 500 stocks trading above their 200 day moving average) also moved slower again last week. It remained Overbought and is trending down. See Barometer chart at the end of this report.
Short term momentum indicators for Canadian indices and sectors continued moving lower last week.
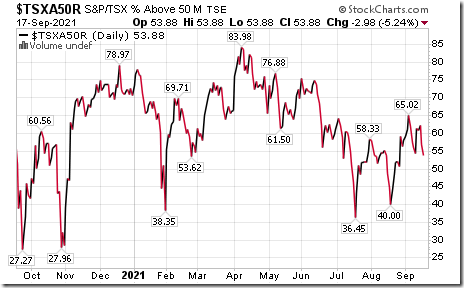
Intermediate term technical indicator for Canadian equity markets moved lower last week. It remained Neutral and is trending down. See Barometer chart at the end of this report.
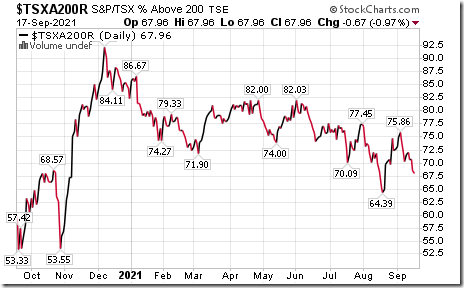
Long term technical indicator for Canadian equity markets (Percent of TSX stocks trading above their 200 day moving average) also moved lower last week. It remained Overbought and trending down. See Barometer charts at the end of this report.
Consensus estimates for earnings and revenues in 2021 by S&P 500 companies were virtually unchanged last week. According to www.FactSet.com Earnings in the third quarter are projected to increase 27.6% (versus previous estimate at 27.9%) and revenues are projected to increase 14.8%. Earnings in the fourth quarter are projected to increase 21.6% (versus previous estimate at 21.5%) and revenues are projected to increase 11.3% (versus previous estimate at 11.2). Earnings for all of 2021 are projected to increase 42.6% and revenues are projected to increase 14.9%..
Growth in 2022 continues, but at a slower pace. .Consensus earnings in 2022 by S&P 500 companies are projected to increase 9.5% (versus previous estimate at 9.4%) and revenues are projected to increase 6.6% (versus 6.5% last week). Consensus earnings for the first quarter are projected to increase 5.6% on a year-over-year basis and revenues are expected to increase 8.1%.
Economic News This Week
Focus this week is on the FOMC meeting on Wednesday and Powell’s testimony on Friday.. Will the Fed continue to expand its monetary basis at the same rate or will it begin to taper its expansion?
August Housing Starts to be released at 8:30 AM EDT on Tuesday are expected to increase to 1.555 million units from 1.534 million units in July
August Existing Home Sales to be released at 10:00 AM EDT on Wednesday are expected to slip to 5.88 million units from 5.99 million units in July.
FOMC interest rate decision to be released at 2:00 PM EDT on Wednesday is expecting no change in the Fed Fund Rate at 0.00%-0.25%. Press conference is available at 2:30 PM EDT.
July Canadian Retail Sales to be released at 8:30 AM EDT on Thursday are expected to increase 4.4% versus a gain of 4.2% in June.
August New Home Sales to be released at 10:00 AM EDT on Friday are expected to increase to 710,000 units from 708,000 units in July.
Federal Reserve Chairman Powell speaks at 10:00 AM EDT on Friday.
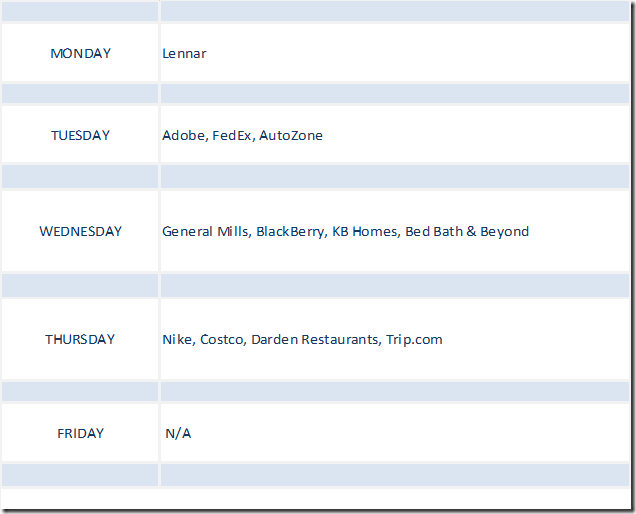
Selected Earnings News This Week
Trader’s Corner
Equity Indices and Related ETFs
Daily Seasonal/Technical Equity Trends for September 17th 2021
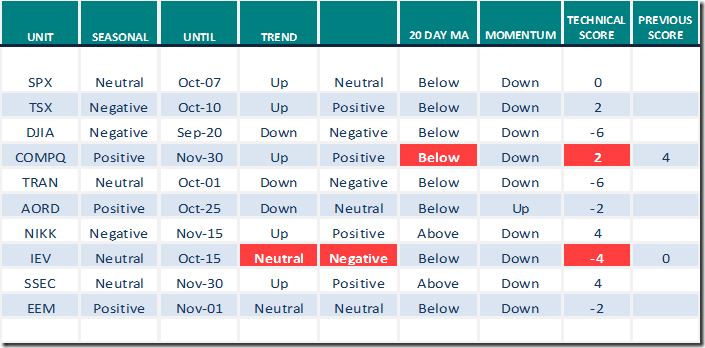 Green: Increase from previous day
Red: Decrease from previous day
Commodities
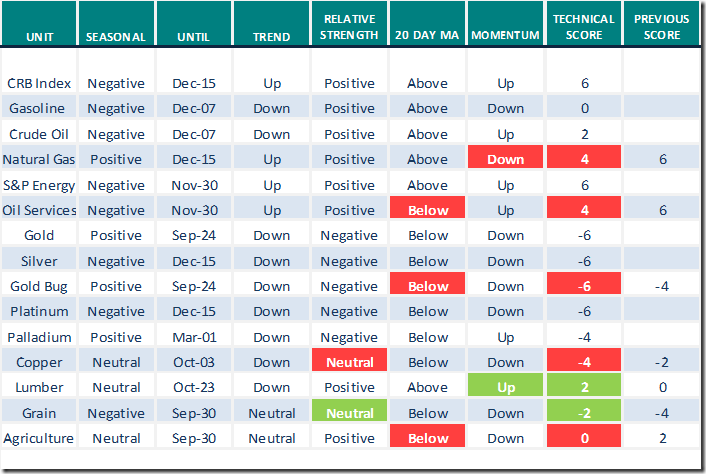
Daily Seasonal/Technical Commodities Trends for September 17th 2021
Green: Increase from previous day
Red: Decrease from previous day
Sectors
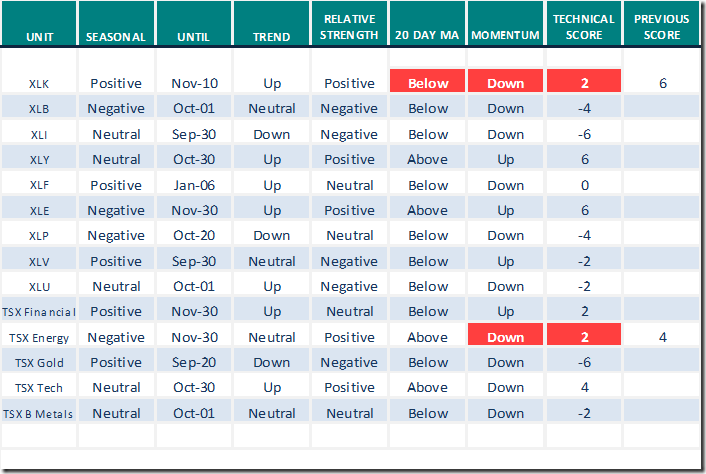
Daily Seasonal/Technical Sector Trends for September 17th 2021
Green: Increase from previous day
Red: Decrease from previous day
All seasonality ratings are based on performance relative to the S&P 500 Index
Links from valued providers
Video: Where September’s seasonality might be taking us
Comment by Greg Schnell: Walking Blind into an Energy Crisis
Walking Blind Into An Energy Crisis | ChartWatchers | StockCharts.com
Michael Campbell’s Money Talks for September 18th
Entire Show – September 18th (mikesmoneytalks.ca)
Technical Scoop
Thank you to Mark Bunting and www.uncommonsenseinvestor.com for links to the following videos and articles:
Video with John Johnston, chief strategist at Davis Rea Investment Counsel
"This Burst of Inflation Will Be Temporary." Here’s Why. – Uncommon Sense Investor
Comments by Bob Pisani, CNBC.com commentator
Slow-Mo Deterioration of Some Stocks Could Signal Broader Decline – Uncommon Sense Investor
5 Top Dividend Aristocrats to Beef Up Your Portfolio | Kiplinger
5 Medtech Stocks to Seize Major Growth | Kiplinger
Technical Scoop
Link to be added
Technical Scores
Calculated as follows:
Intermediate Uptrend based on at least 20 trading days: Score 2
(Higher highs and higher lows)
Intermediate Neutral trend: Score 0
(Not up or down)
Intermediate Downtrend: Score -2
(Lower highs and lower lows)
Outperformance relative to the S&P 500 Index: Score: 2
Neutral Performance relative to the S&P 500 Index: 0
Underperformance relative to the S&P 500 Index: Score –2
Above 20 day moving average: Score 1
At 20 day moving average: Score: 0
Below 20 day moving average: –1
Up trending momentum indicators (Daily Stochastics, RSI and MACD): 1
Mixed momentum indicators: 0
Down trending momentum indicators: –1
Technical scores range from -6 to +6. Technical buy signals based on the above guidelines start when a security advances to at least 0.0, but preferably 2.0 or higher. Technical sell/short signals start when a security descends to 0, but preferably -2.0 or lower.
Long positions require maintaining a technical score of -2.0 or higher. Conversely, a short position requires maintaining a technical score of +2.0 or lower
Changes Last Week
Technical Notes released on Friday at
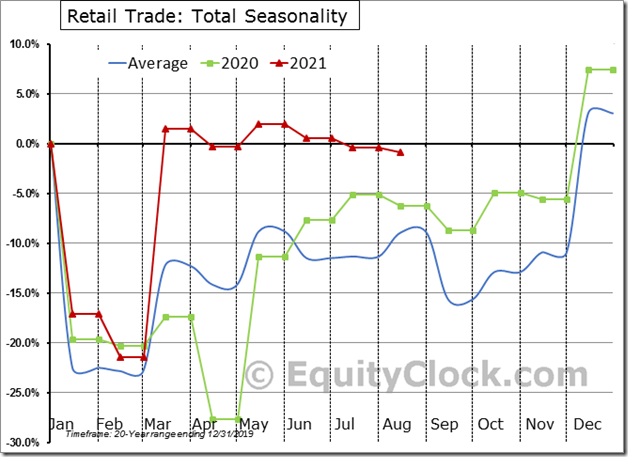
Headlines may have you believe that last month’s retail sales report was strong, but we have an alternate view. Find out why in today’s report. equityclock.com/2021/09/16/… $STUDY $MACRO $XRT $RTH #Economy #Consumer
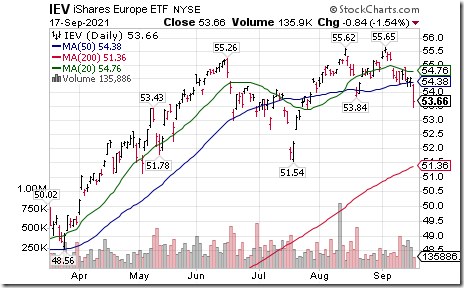
Europe iShares $IEV moved below $53.84 completing a double top pattern.
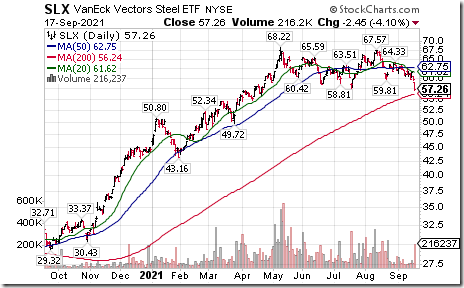
Steel ETF $SLX moved below $58.81 completing a double top pattern.
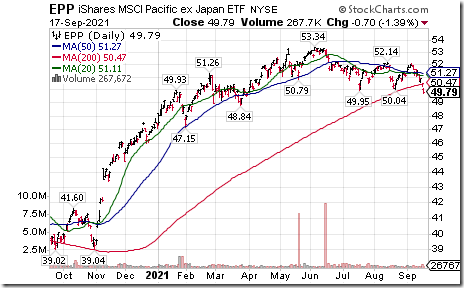
Pacific ex Japan iShares $EPP moved below $49.95 completing a double top pattern.
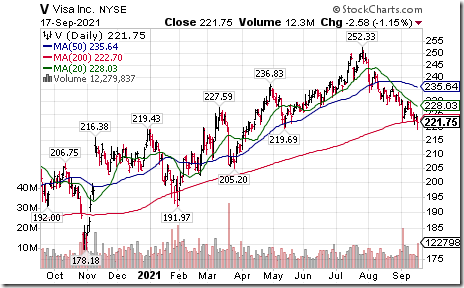
Visa $V a Dow Jones Industrial Average stock moved below $221.96 and $219.69 extending an intermediate downtrend.
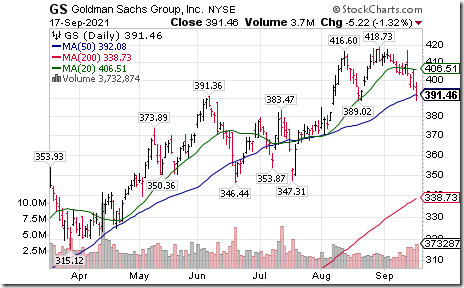
Goldman Sachs $GS a Dow Jones Industrial Average stock moved below $389.02 completing a double top pattern.
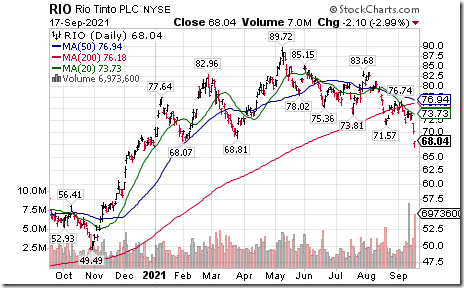
Rio Tinto $RIO one of the world’s largest base metals producers moved below $68.81 extending an intermediate downtrend.
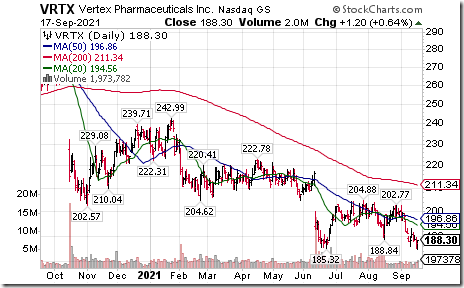
Vertex Pharma $VRTX a NASDAQ 100 stock moved below $185.32 extending an intermediate downtrend.
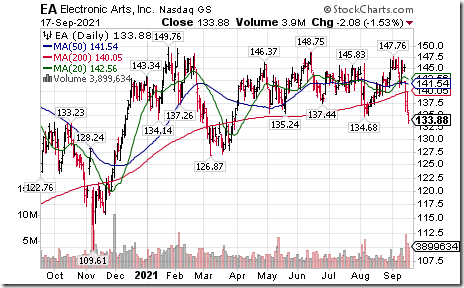
Electronic Arts $EA a NASDAQ 100 stock moved below $134.84 setting an intermediate downtrend.
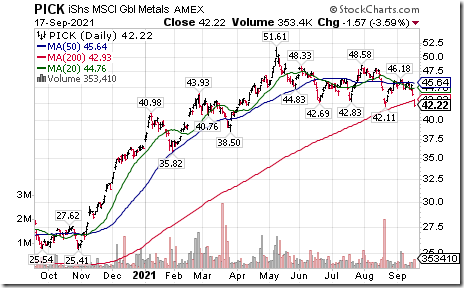
Global Base Metals iShares $PICK moved below $42.11 completing a double top pattern.
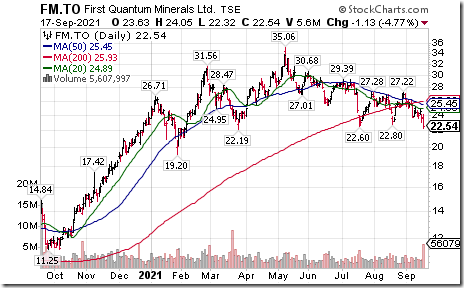
First Quantum Minerals $FM.CA a TSX 60 stock moved below $22.60 completing a long term Head & Shoulders pattern
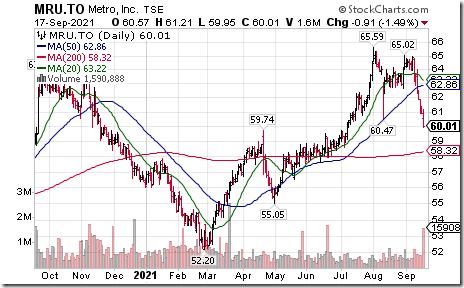
Metro $MRU.CA a TSX 60 stock moved below $60.47 completing a double top pattern.
S&P 500 Momentum Barometers
The intermediate term Barometer dropped 9.22 on Friday and 6.41 last week to 43.89. It remains Neutral and trending down.
The long term Barometer dropped 2.40 on Friday and 1.61 last week to 71.74. It remains Overbought and trending down.
TSX Momentum Barometers
The intermediate term Barometer dropped 2.98 on Friday and 0.53 last week to 53.88. It remains Neutral and showing early signs of trending down.
The long term Barometer slipped 0.67 on Friday and 3.61 last week to 67.96. It remains Overbought and showing early signs of trending down.
Disclaimer: Seasonality and technical ratings offered in this report and at
www.equityclock.com are for information only. They should not be considered as advice to purchase or to sell mentioned securities. Data offered in this report is believed to be accurate, but is not guaranteed
This post was originally publised at Vialoux's Tech Talk.


