by Don Vialoux, EquityClock.com
Technical Notes released yesterday at
More reason to be optimistic of the stocks with exposure to the manufacturing economy this fall. equityclock.com/2021/09/15/… $STUDY $MACRO $SPX $SPY $ES_F
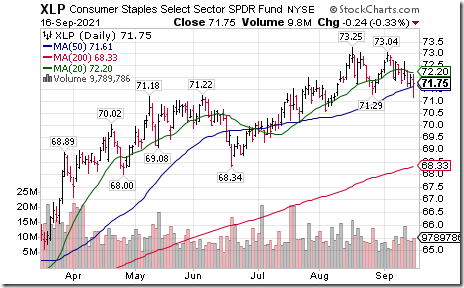
Consumer Staples SPDRs $XLP moved below $71.29 completing a double top pattern.
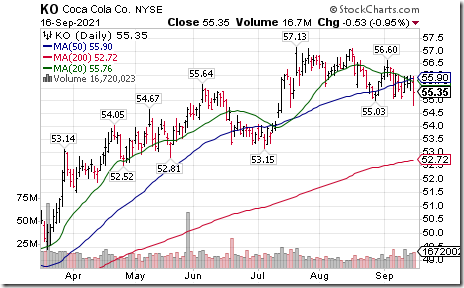
Coca Cola $KO a Dow Jones Industrial Average stock moved below $55.03 extending an intermediate downtrend
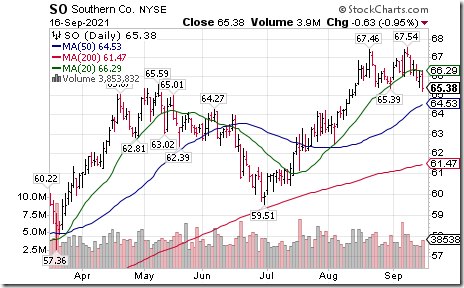
Southern Companies $SO an S&P 100 stock moved below $65.39 completing a double top pattern.
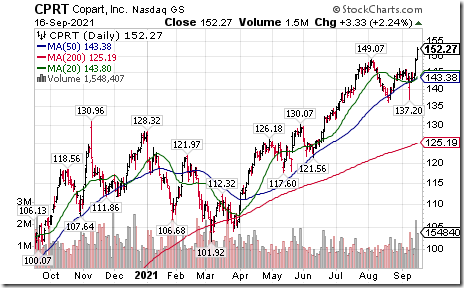
Copart $CPRT a NASDAQ 100 stock moved above $149.07 to an all-time high extending an intermediate uptrend.
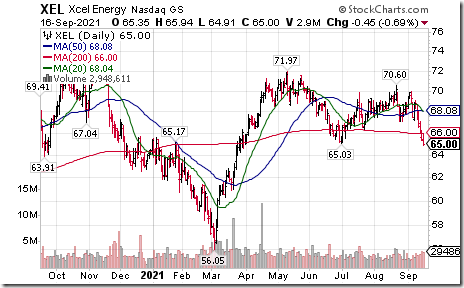
Xcel Energy $XEL a NASDAQ 100 stock moved below $65.03 completing a double top pattern.
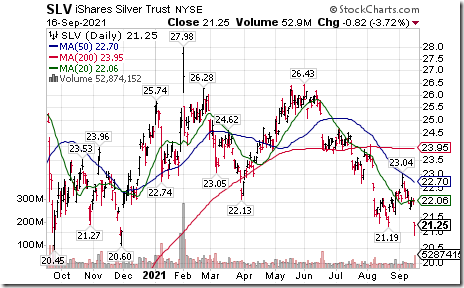
Silver iShares $SLV moved below US$21.19 extending an intermediate downtrend.
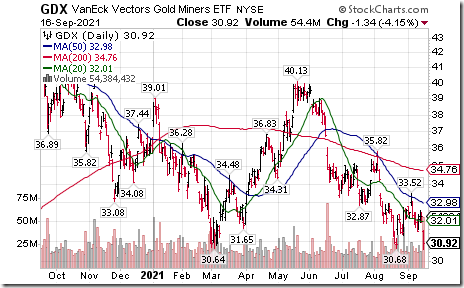
Gold equity ETF $GDX moved below $30.68 and $30.64 extending an intermediate downtrend.
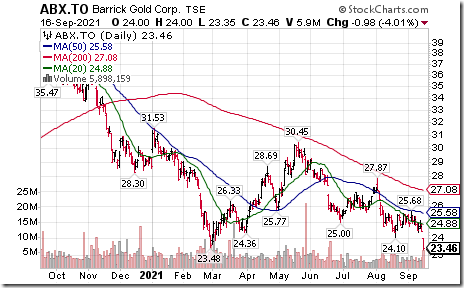
Weakness in silver and gold prompted intermediate breakdowns in three gold stocks that are part of the TSX 60 Index extending an intermediate downtrend. $ABX.CA moved below $Cdn$24.10. Wheaton Precious Metals $WPM moved below US$42.16. Kinross Gold $KGC moved below US$5.62
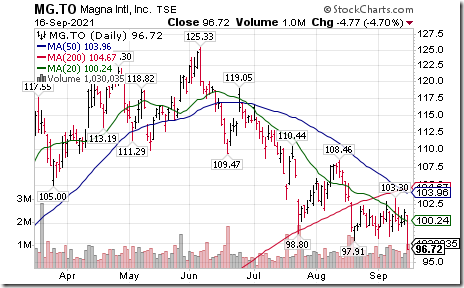
Magna International $MG.CA a TSX 60 stock moved below Cdn$97.91 extending an intermediate downtrend.
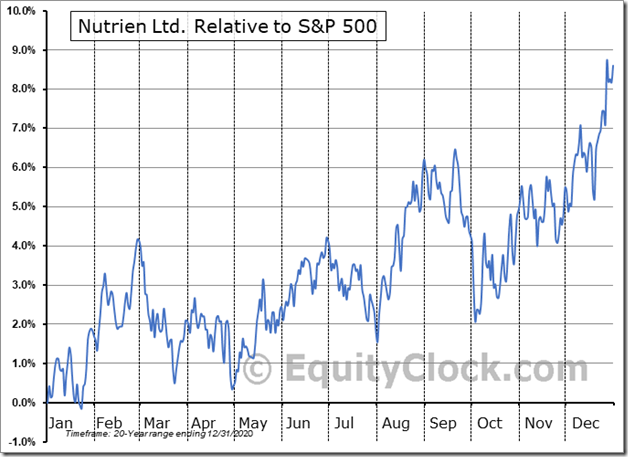
Nutrient $NTR.CA a TSX 60 stock moved above $80.82 extending an intermediate uptrend.
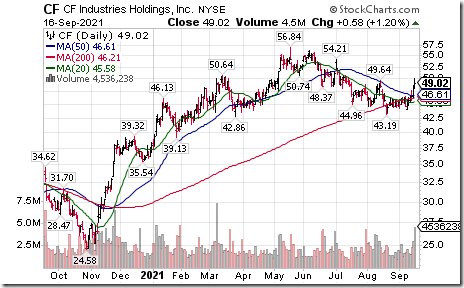
Fertilizer stocks are notably higher today. $NTR.CA broke above intermediate resistance earlier today. CF Industries $CF is the strongest stock in the sector. Nice move above resistance at $49.64. Mosaic $MOS also is significantly higher.
Trader’s Corner
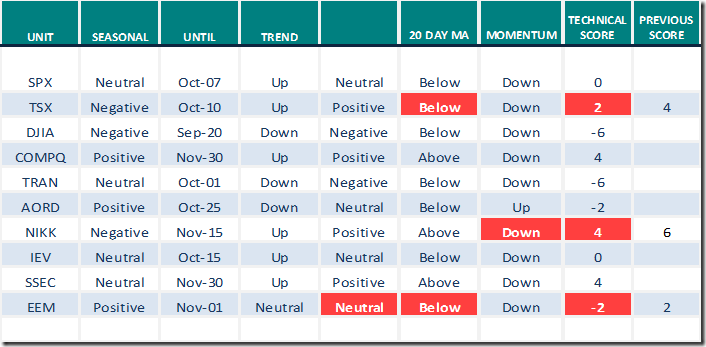
Equity Indices and Related ETFs
Daily Seasonal/Technical Equity Trends for September 16th 2021
Green: Increase from previous day
Red: Decrease from previous day
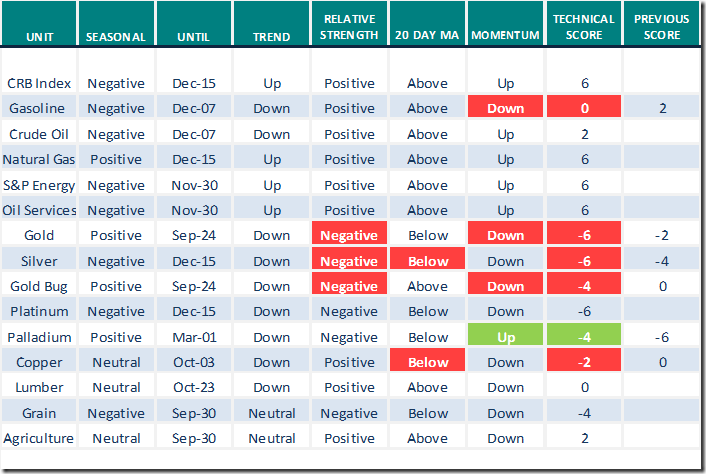
Commodities
Daily Seasonal/Technical Commodities Trends for September 16th 2021
Green: Increase from previous day
Red: Decrease from previous day
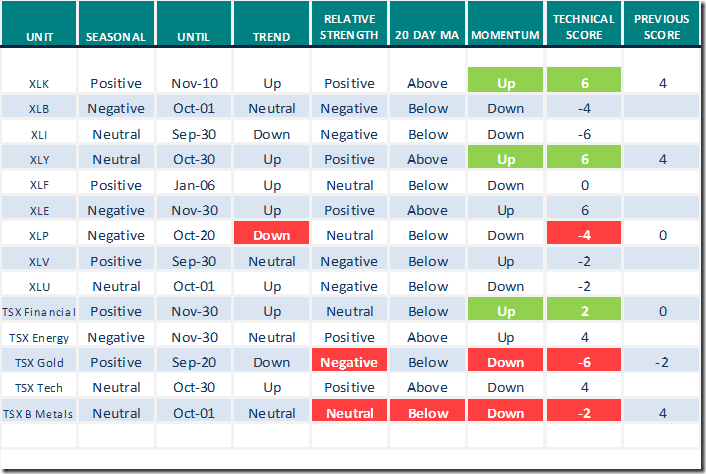
Sectors
Daily Seasonal/Technical Sector Trends for September 16th 2021
Green: Increase from previous day
Red: Decrease from previous day
All seasonality ratings are based on performance relative to the S&P 500 Index
Seasonality Chart of the Day from www.EquityClock.com
Trends by seasonality charts for fertilizer stocks including Nutrien, Mosaic and CF Industries are virtually identical: They show weakness on a real and relative basis (relative to the S&P 500 Index and TSX Composite Index) during the last two week in September followed by an important seasonal low in early October. Thereafter, the sector enters its best period of seasonal strength for the year, a trend that can last to the end of February.
S&P 500 Momentum Barometers
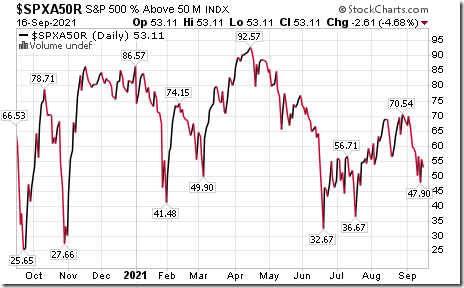
The intermediate term Barometer slipped 2.61 to 53.11 yesterday. It remains Neutral.
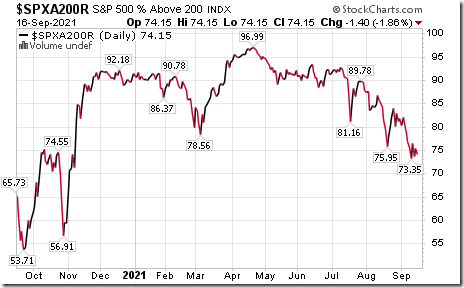
The long term Barometer eased 1.40 to 74.15 yesterday. It remains Overbought.
TSX Momentum Barometers
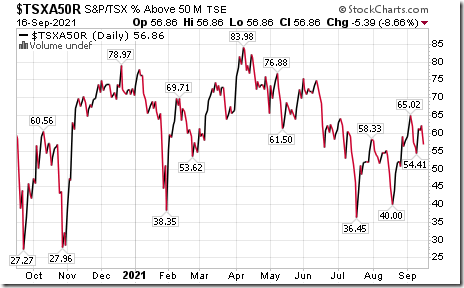
The intermediate term Barometer dropped 5.39 to 56.86 yesterday. It changed from Overbought to Neutral on a move below 60.00.
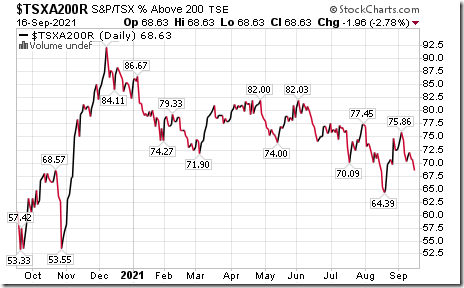
The long term Barometer slipped 1.96 to 68.63 yesterday. It remains Overbought and trending down.
Disclaimer: Seasonality and technical ratings offered in this report and at
www.equityclock.com are for information only. They should not be considered as advice to purchase or to sell mentioned securities. Data offered in this report is believed to be accurate, but is not guaranteed
This post was originally publised at Vialoux's Tech Talk.


![clip_image011[1] clip_image011[1]](https://advisoranalyst.com/wp-content/uploads/2021/09/clip_image0111_thumb.png)
