by Don Vialoux, EquityClock.com
Technical Notes released yesterday at
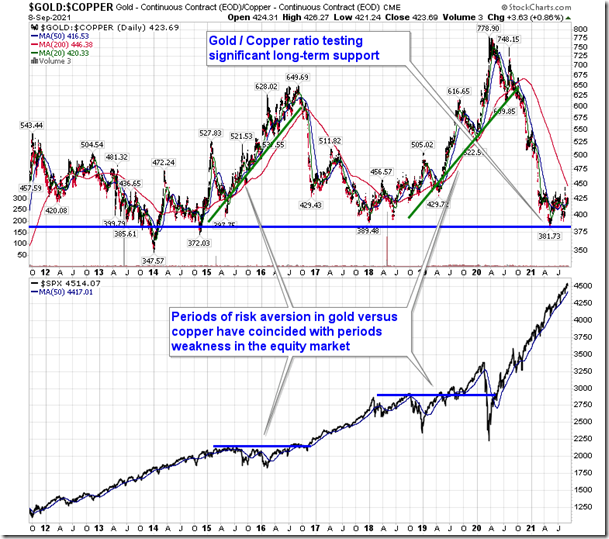
Gold/Copper ratio continues to hold around significant long-term support, the reaction to which could have implications for the long-term trend of stocks. equityclock.com/2021/09/08/… $GC_F $HG_F $GLD $CPER $STUDY
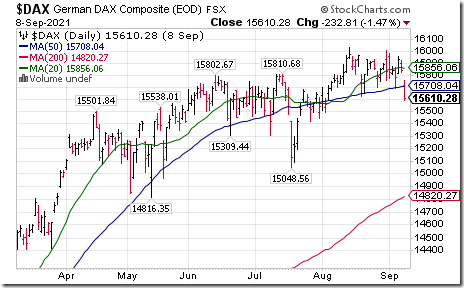
German DAX Index $DAX moved below $15,621.98 completing a double top pattern.
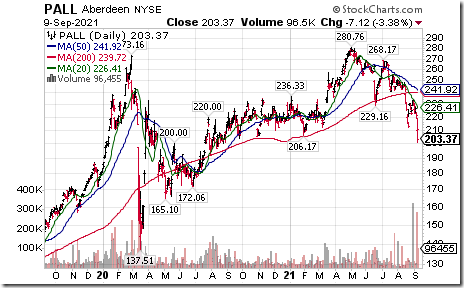
Palladium ETN $PALL moved below $204.14 extending an intermediate downtrend.
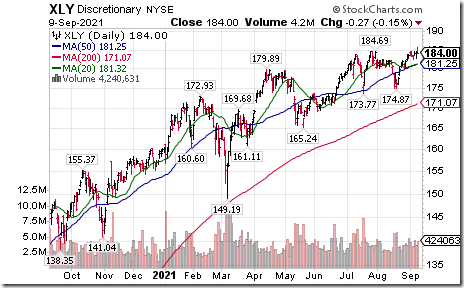
Consumer Discretionary SPDRs $XLY moved above $184.69 to an all-time high extending an intermediate uptrend.
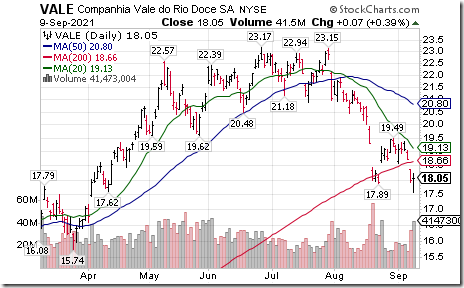
VALE SA $VALE one of the world’s largest base metals producers moved below $17.89 extending an intermediate downtrend.
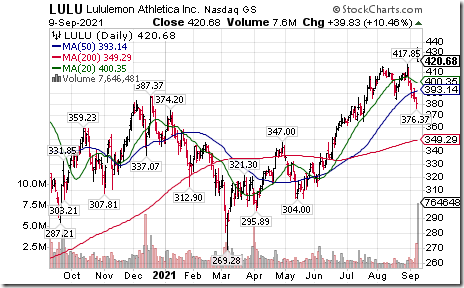
Lululemon $LULU a NASDAQ 100 stock moved above $417.85 to an all-time high extending an intermediate uptrend.
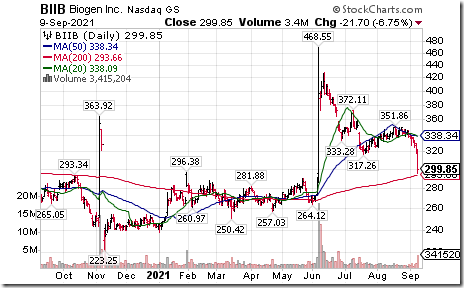
Biogen $BIIB an S&P 100 stock moved below $317.26 extending an intermediate downtrend.
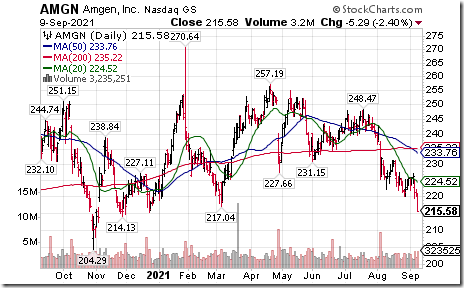
Amgen $AMGN an S&P 100 stock moved below $217.04 extending an intermediate downtrend.
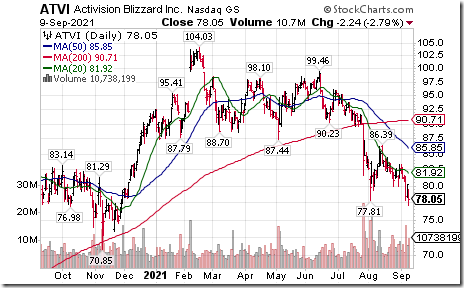
Activision Blizzard $ATVI a NASDAQ 100 stock moved below $77.81 extending an intermediate downtrend.
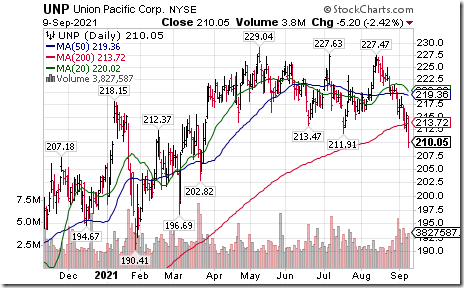
Union Pacific $UNP an S&P 100 stock moved below $211.91 completing a double top pattern.
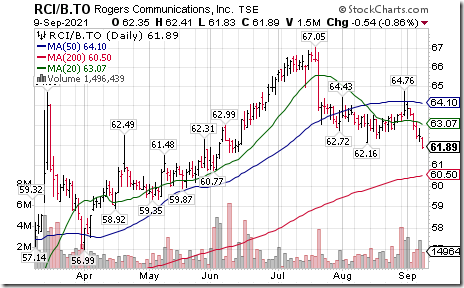
Rogers Communications $RCI.A.CA a TSX 60 stock moved below $62.16 completing a double top pattern.
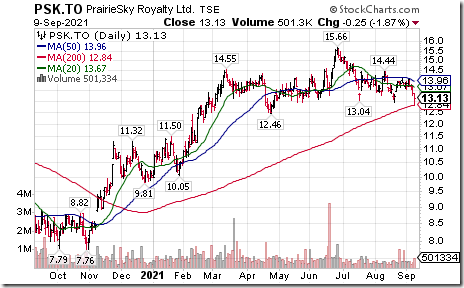
Canadian junior "oily" producers are under technical pressure with a drop in crude oil prices. PrairieSky Royalties $PSK.CA moved below Cdn$12.97 completing a Head & Shoulders pattern
Trader’s Corner
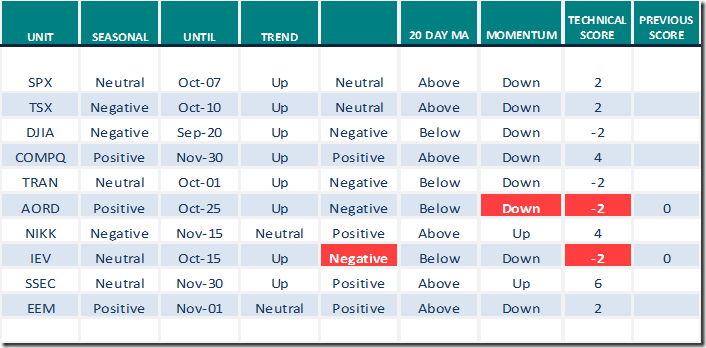
Equity Indices and Related ETFs
Daily Seasonal/Technical Equity Trends for September 9th 2021
Green: Increase from previous day
Red: Decrease from previous day
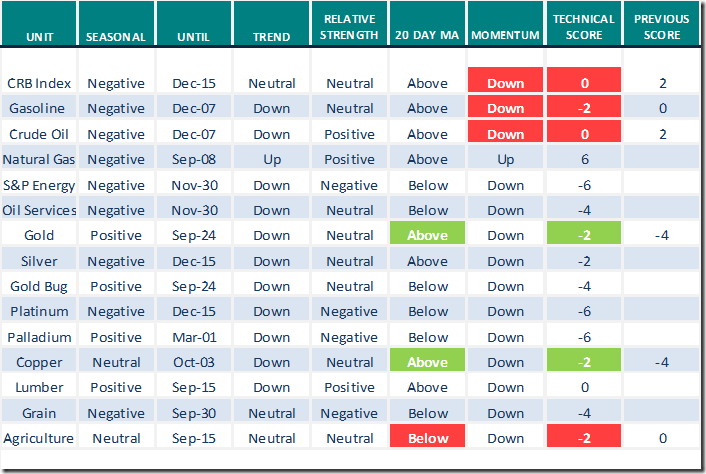
Commodities
Daily Seasonal/Technical Commodities Trends for September 9th 2021
Green: Increase from previous day
Red: Decrease from previous day
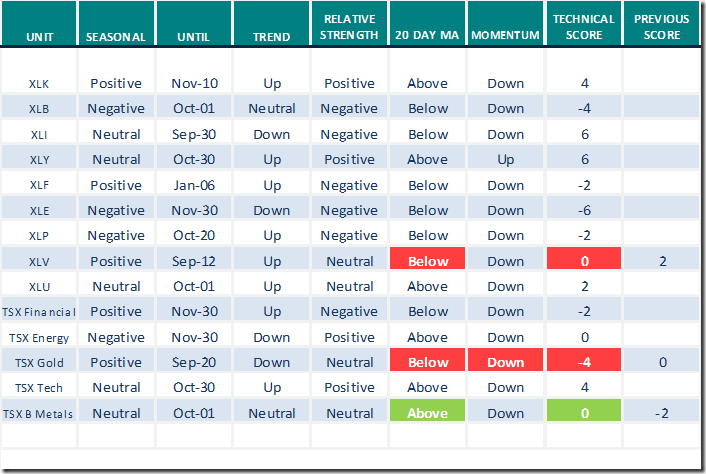
Sectors
Daily Seasonal/Technical Sector Trends for September 9th 2021
Green: Increase from previous day
Red: Decrease from previous day
All seasonality ratings are based on performance relative to the S&P 500 Index
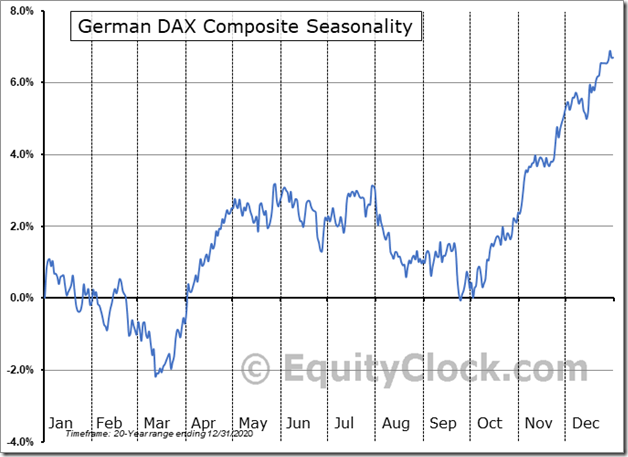
Seasonality Chart of the Day from www.EquityClock.com
Seasonal influences on the DAX Index are negative on a real and relative basis (relative to the S&P 500 Index) between now and the first week in October when they reach an important seasonal low. Thereafter, seasonal influences turn strongly positive.
What’s the story with Bitcoin? Let’s take a look!
Greg Schnell comments (including how to access information on www.stockcharts.com) Following is the link:
https://www.youtube.com/watch?v=I0bZlL_SNsM
S&P 500 Momentum Barometers
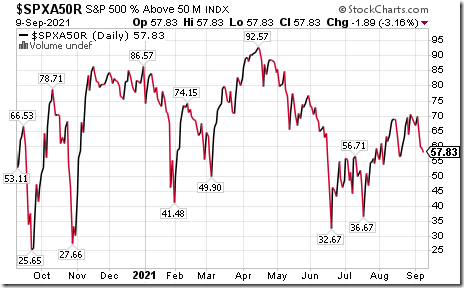
The intermediate term Barometer slipped 1.89 to 57.83 yesterday. It remains Neutral and trending down.
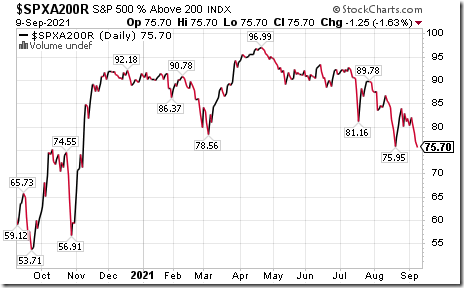
The long term Barometer dropped another 1.25 to 75.70 yesterday. It remains Overbought and extending a downtrend.
TSX Momentum Barometers
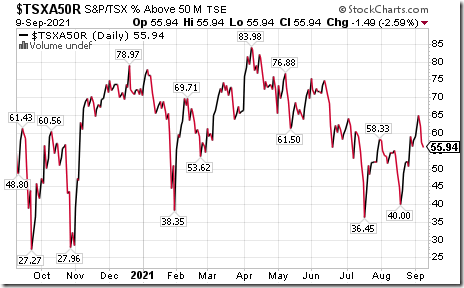
The intermediate Barometer dropped another 1.49 to 55.94 yesterday. It remains Neutral and trending down.
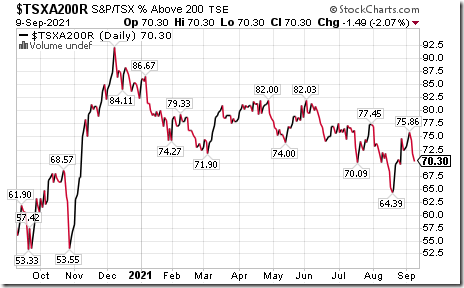
The long term Barometer eased another 1.49 to 70.30 yesterday. It remains Overbought and trending down.
Disclaimer: Seasonality and technical ratings offered in this report and at
www.equityclock.com are for information only. They should not be considered as advice to purchase or to sell mentioned securities. Data offered in this report is believed to be accurate, but is not guaranteed
This post was originally publised at Vialoux's Tech Talk.


