by Don Vialoux, EquityClock.com
Technical Notes released yesterday at
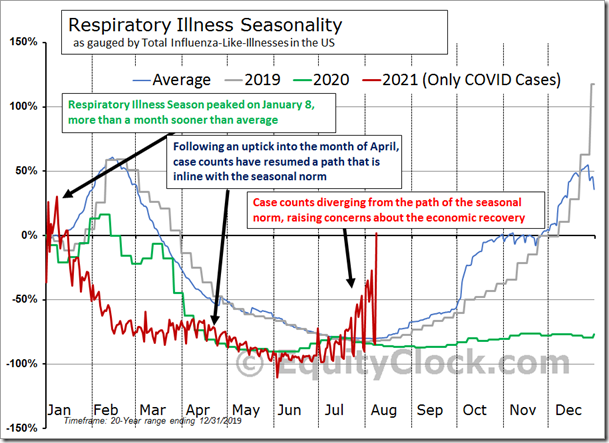
While the equity market shifts in an abnormal manner for this time of year, it is the abnormal rise in respiratory illnesses that has us concerned. equityclock.com/2021/08/10/… $STUDY $SPX #Economy #COVID
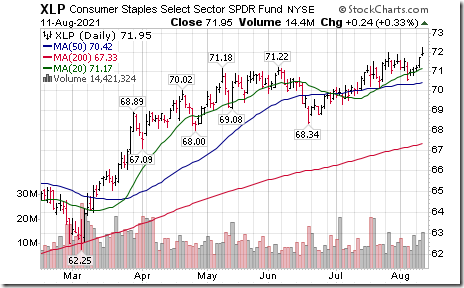
Consumer Staples SPDRs $XLP moved above $71.98 to an all-time high extending an intermediate uptrend.
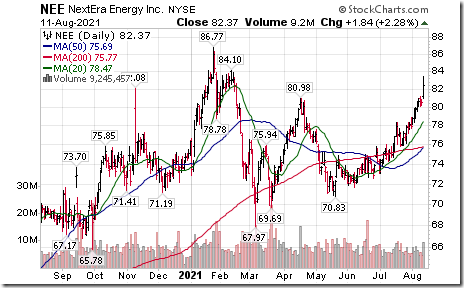
NextEra Energy $NEE moved above $86.77 resuming an intermediate uptrend.
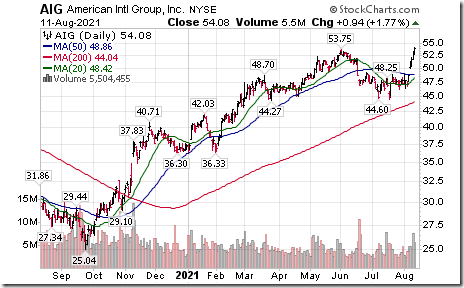
American International Group $AIG an S&P 100 stock moved above $53.75 extending an intermediate uptrend.
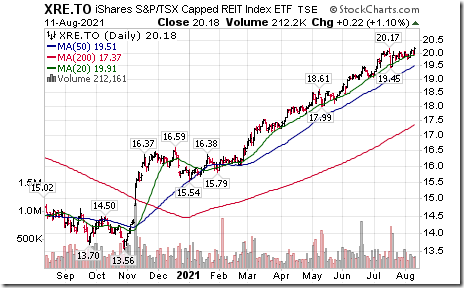
S&P/TSX REIT iShares $XRE.CA moved above $20.47 to an all-time high extending an intermediate uptrend.
Trader’s Corner
Equity Indices and Related ETFs
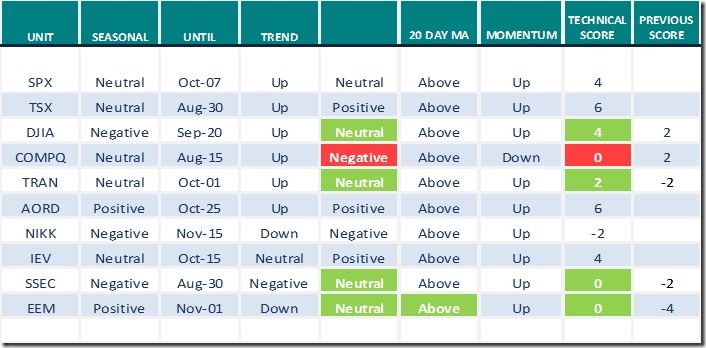
Daily Seasonal/Technical Equity Trends for August 11th 2021
Green: Increase from previous day
Red: Decrease from previous day
Commodities
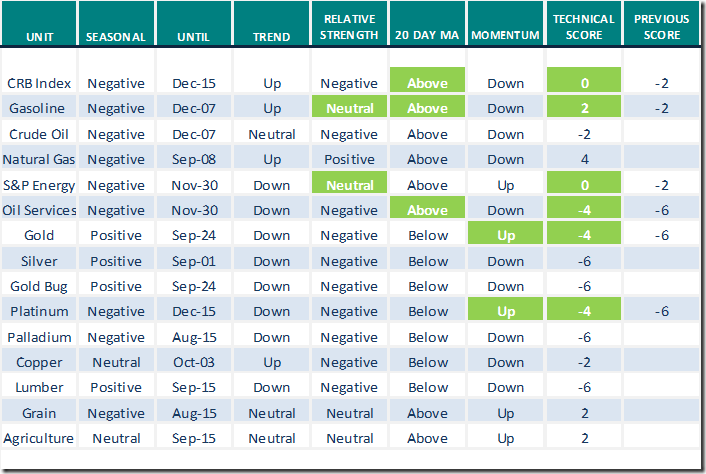
Daily Seasonal/Technical Commodities Trends for August 11th 2021
Green: Increase from previous day
Red: Decrease from previous day
Sectors
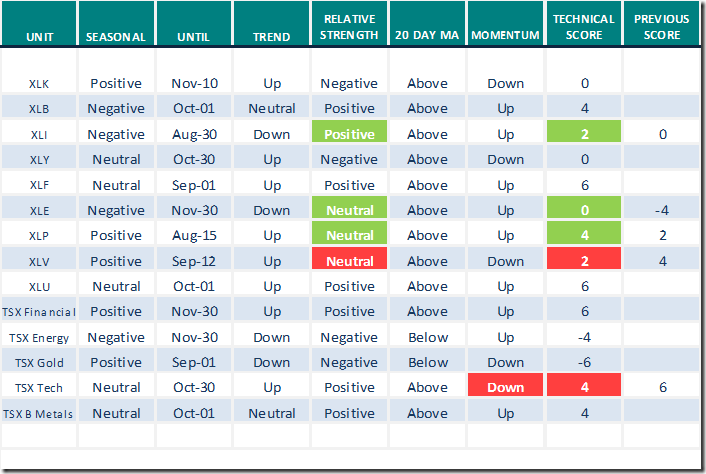
Daily Seasonal/Technical Sector Trends for August 11th 2021
Green: Increase from previous day
Red: Decrease from previous day
All seasonality ratings are based on performance relative to the S&P 500 Index
Notes from uncommon SENSE Investor
Thank you to Mark Bunting and www.uncommonsenseinvestor.com for a link to the following comment:
S&P 500 index will hit 5,000 by end of 2022
Comments by Ed Yardeni:
S&P 500 Will Hit 5,000 By End of 2022. Here’s How. – Uncommon Sense Investor
Market Buzz
Greg Schnell discusses “The bizarre oil market”. Following is a link:
https://www.youtube.com/watch?v=XIOs6MiirEw
Seasonality Chart of the Day
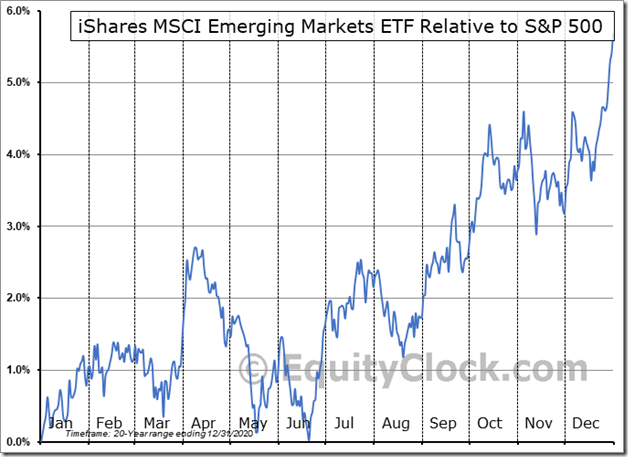
Emerging equity markets and related ETFs have a history on a real and relative basis (relative to the S&P 500 Index) of reaching a low this week and moving higher until at least the beginning of November and frequently to the end of January.
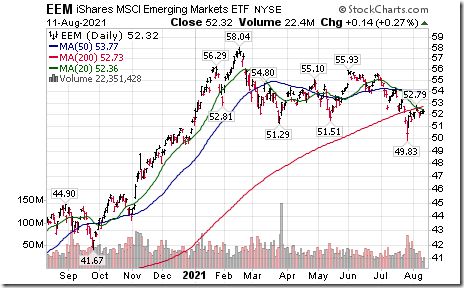
Technicals have started to recover. Notably, EEM units moved above their 20 day moving average yesterday and relative strength finally changed from Negative to at least Neutral.
S&P 500 Momentum Barometers
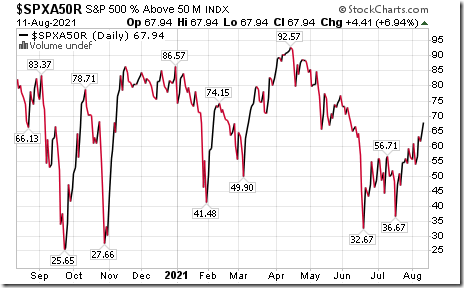
The intermediate term Barometer added 4.41 to 67.94 yesterday. It remains Overbought.
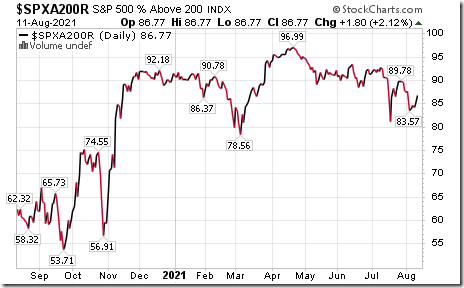
The long term Barometer gained 1.80 to 86.77 yesterday. It remains Extremely Overbought.
TSX Momentum Barometers
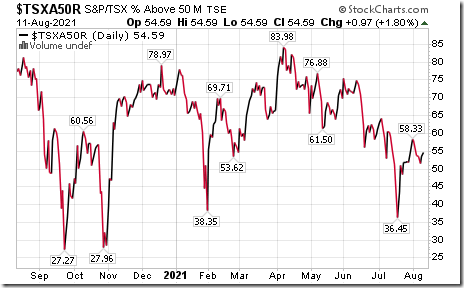
The intermediate term Barometer added 0.97 yesterday. It remains Neutral.
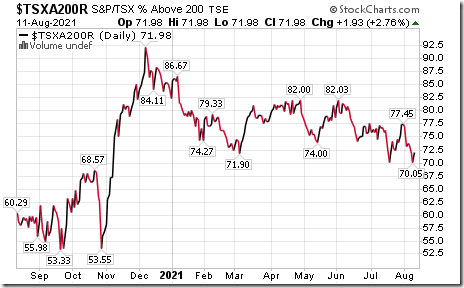
The long term Barometer added 1.93 to 71.98 yesterday. It remains Overbought.
Disclaimer: Seasonality and technical ratings offered in this report and at
www.equityclock.com are for information only. They should not be considered as advice to purchase or to sell mentioned securities. Data offered in this report is believed to be accurate, but is not guaranteed
This post was originally publised at Vialoux's Tech Talk.


