
by Joe Steidl, Tiffany Su, Research Affiliates
Key Points
- The largest stock holdings in a global market-cap index consistently turn over. Investing in these companies, particularly via a highly concentrated market-cap index, can mean underperformance for investors over time.
- Investing in a diversified strategy, such as a smart beta multi-factor index, can improve diversification, not only across companies, but across investment styles, and lower the concentration risk inherent in a market-cap-weighted index.
Joe Steidl is the corresponding author.
Greek mythology, replete with tales of gods, intense battles, and mystical powers, is captivating. Hollywood has always found a plethora of screenplay material in Greek mythology, spotlighting gods and demigods, catapulting them and the actors who play them into stardom, back when big screens were a thing! Titanomachy is one of the most defining moments in Greek mythology: a great battle between two generation of gods—the older Titans and the younger Olympians.
True of all great stories, this story teaches us an important lesson: never underestimate how drastically the playing field can change, even in the most unlikely of circumstances. Against all odds, even the most powerful can fail. Not only the Greek gods, but the rulers of the equity market, the largest market-cap stocks in a market-cap index, repeatedly fall from grace. Investing in these stocks, particularly via a highly concentrated market-cap index, can mean underperformance for investors over time. Investing in a more-diversified strategy, such as a smart beta multi-factor index, can improve diversification, not only across companies, but across investment styles.
Stock Titans Fall Too
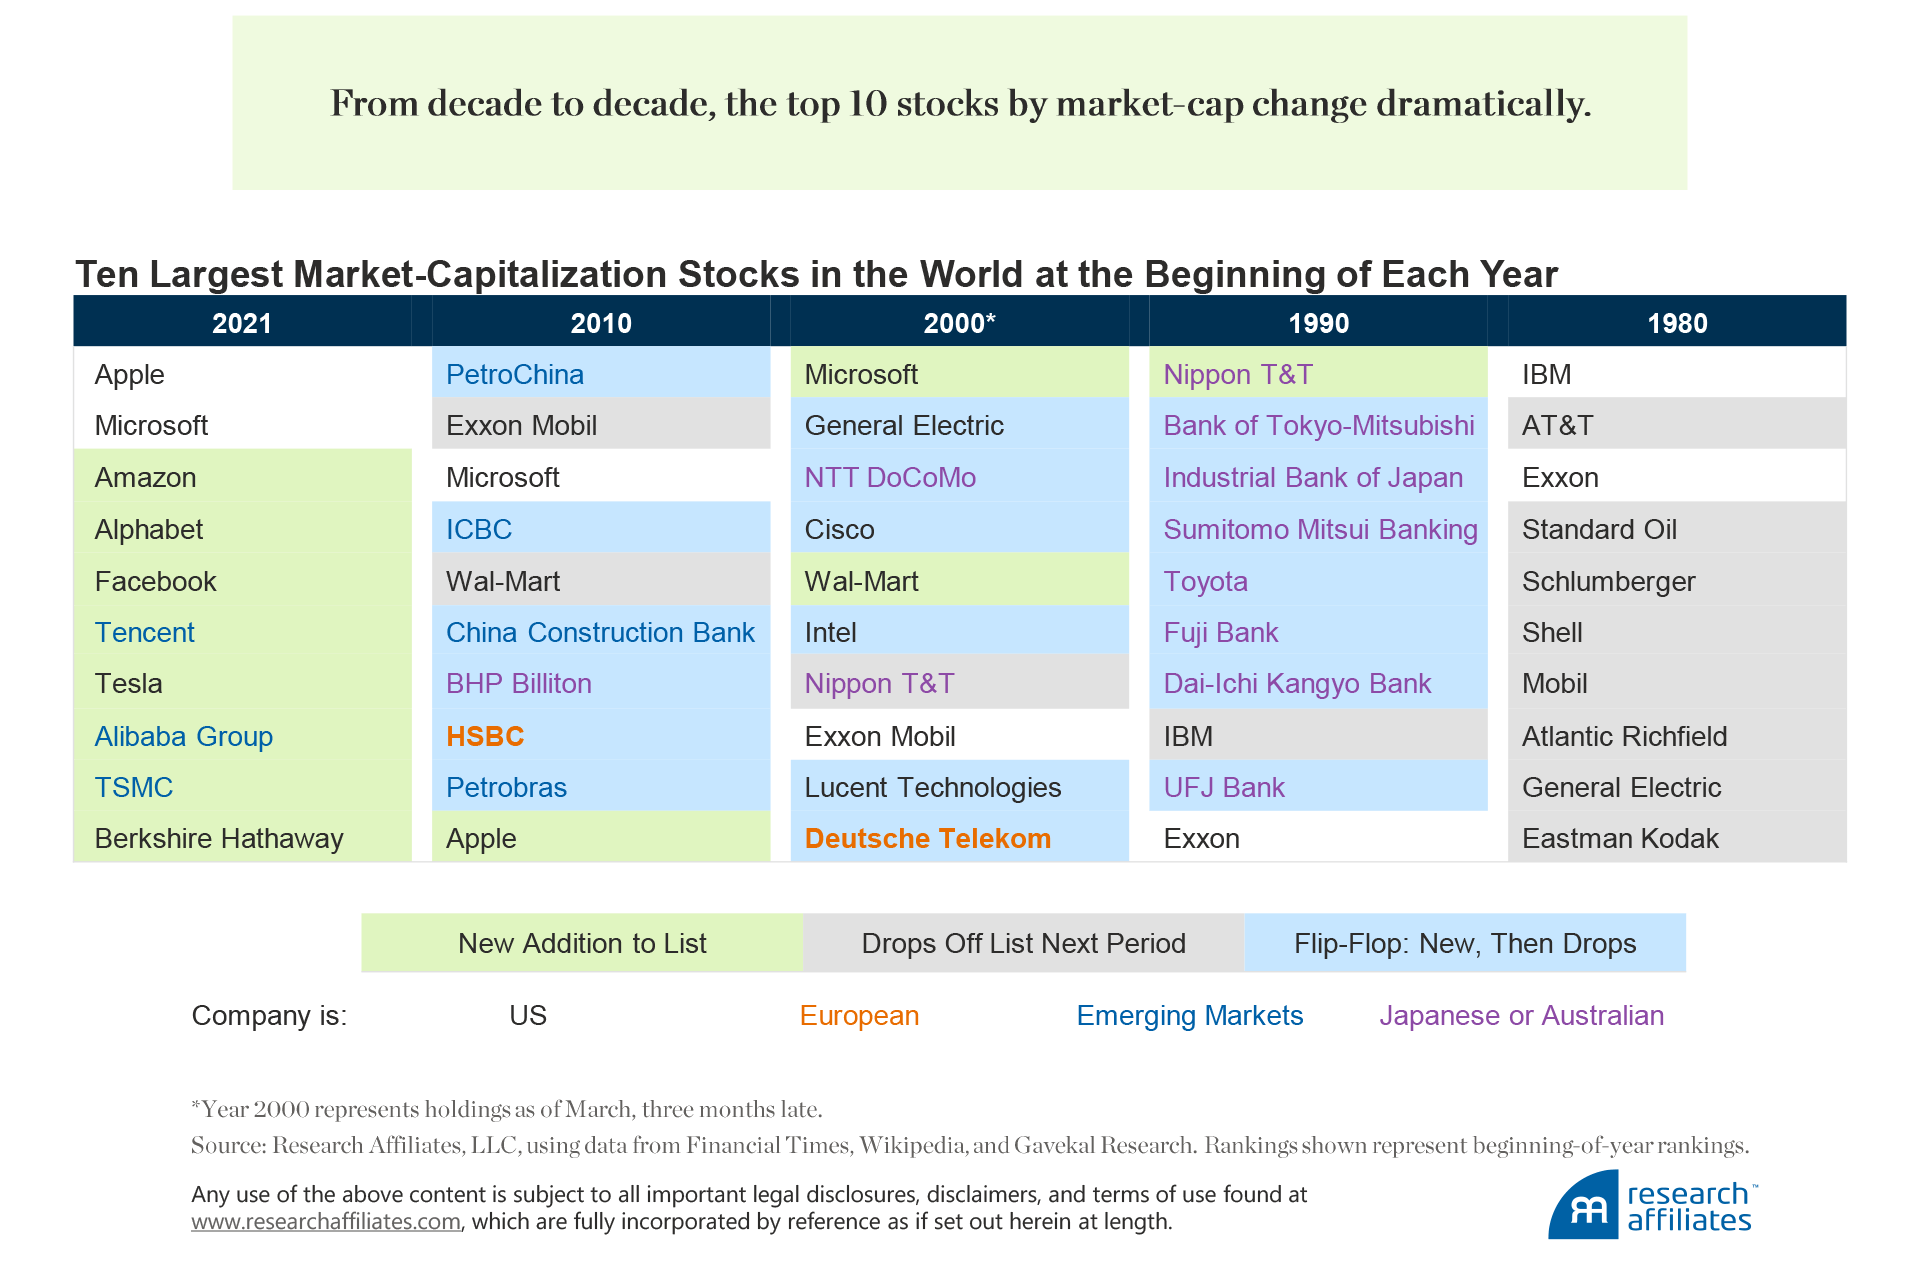
The companies that dominate a global market-cap index are, by definition, those with the largest market capitalizations. Arnott, Kalesnik, and Wu (2018) updated earlier research by our firm on what we call the global top-dog stocks, the top 10 stocks in the world by market-cap. These companies can hold that esteemed position for an extended period of time, sometimes decades. Often forgotten, however, is that the top 10 stocks can also have significant turnover from decade to decade. From the vantage point of their being a top 10 stock, it seems outlandish they would ever fall out of the top 10 position, but history bears witness that this is in fact the case.
A comparison of the top-dog stocks at the beginning of the first year of each decade, beginning in 1980, shows the dramatic shift in the top 10 companies over time. None of the 10 largest stocks by market-cap, which would have dominated a global market-cap index, in 1980 or 1990 are in the top 10 in 2021. In 1980, oil stocks were the titans. In 1990, Japanese conglomerates were the titans.
In the 2000s, the rise of the technology and communications industries paved the way to entry in the top 10 for Chinese firms a decade later. Today, we are all aware of the remarkable domination of global capital markets by US and Chinese growth stocks. The only two companies to remain in the top 10 since 2010 are Microsoft and Apple.
Today, the titans are tech and communications stocks. These companies’ market-caps skyrocketed over 2020 as the global pandemic pushed us all into a more-digital world. History suggests the next decade will bring more turnover. Will any of the current titans still rule in 2030?
The concentration level of the top 10 stocks varies over time. Our analysis of the period since April 1996 shows that the aggregate weight of the top 10 stocks in the global market-cap-weighted index hit an all-time high of 16.6% in September 2020, far surpassing the concentration levels of 13.7% in April 2000 at the height of the tech bubble. An argument we hear today, a rationale for why the extremely high multiples of tech firms are not in bubble territory, is that these tech titans are a lot more profitable, with their cash-heavy balance sheets, than the tech titans in the dot-com bubble. We compared the economic size, represented by a company’s fundamentals (company sales, cash flows, dividends plus buybacks, and book value), of the top 10 companies in April 2000 and September 2020. The aggregate fundamental weights of the two groups are 5.4% and 6.9%, respectively. Therefore, the largest companies in April 2000 had an economic footprint only slightly lower than today’s titans, suggesting the concentration level now is as risky as it was in the tech bubble.

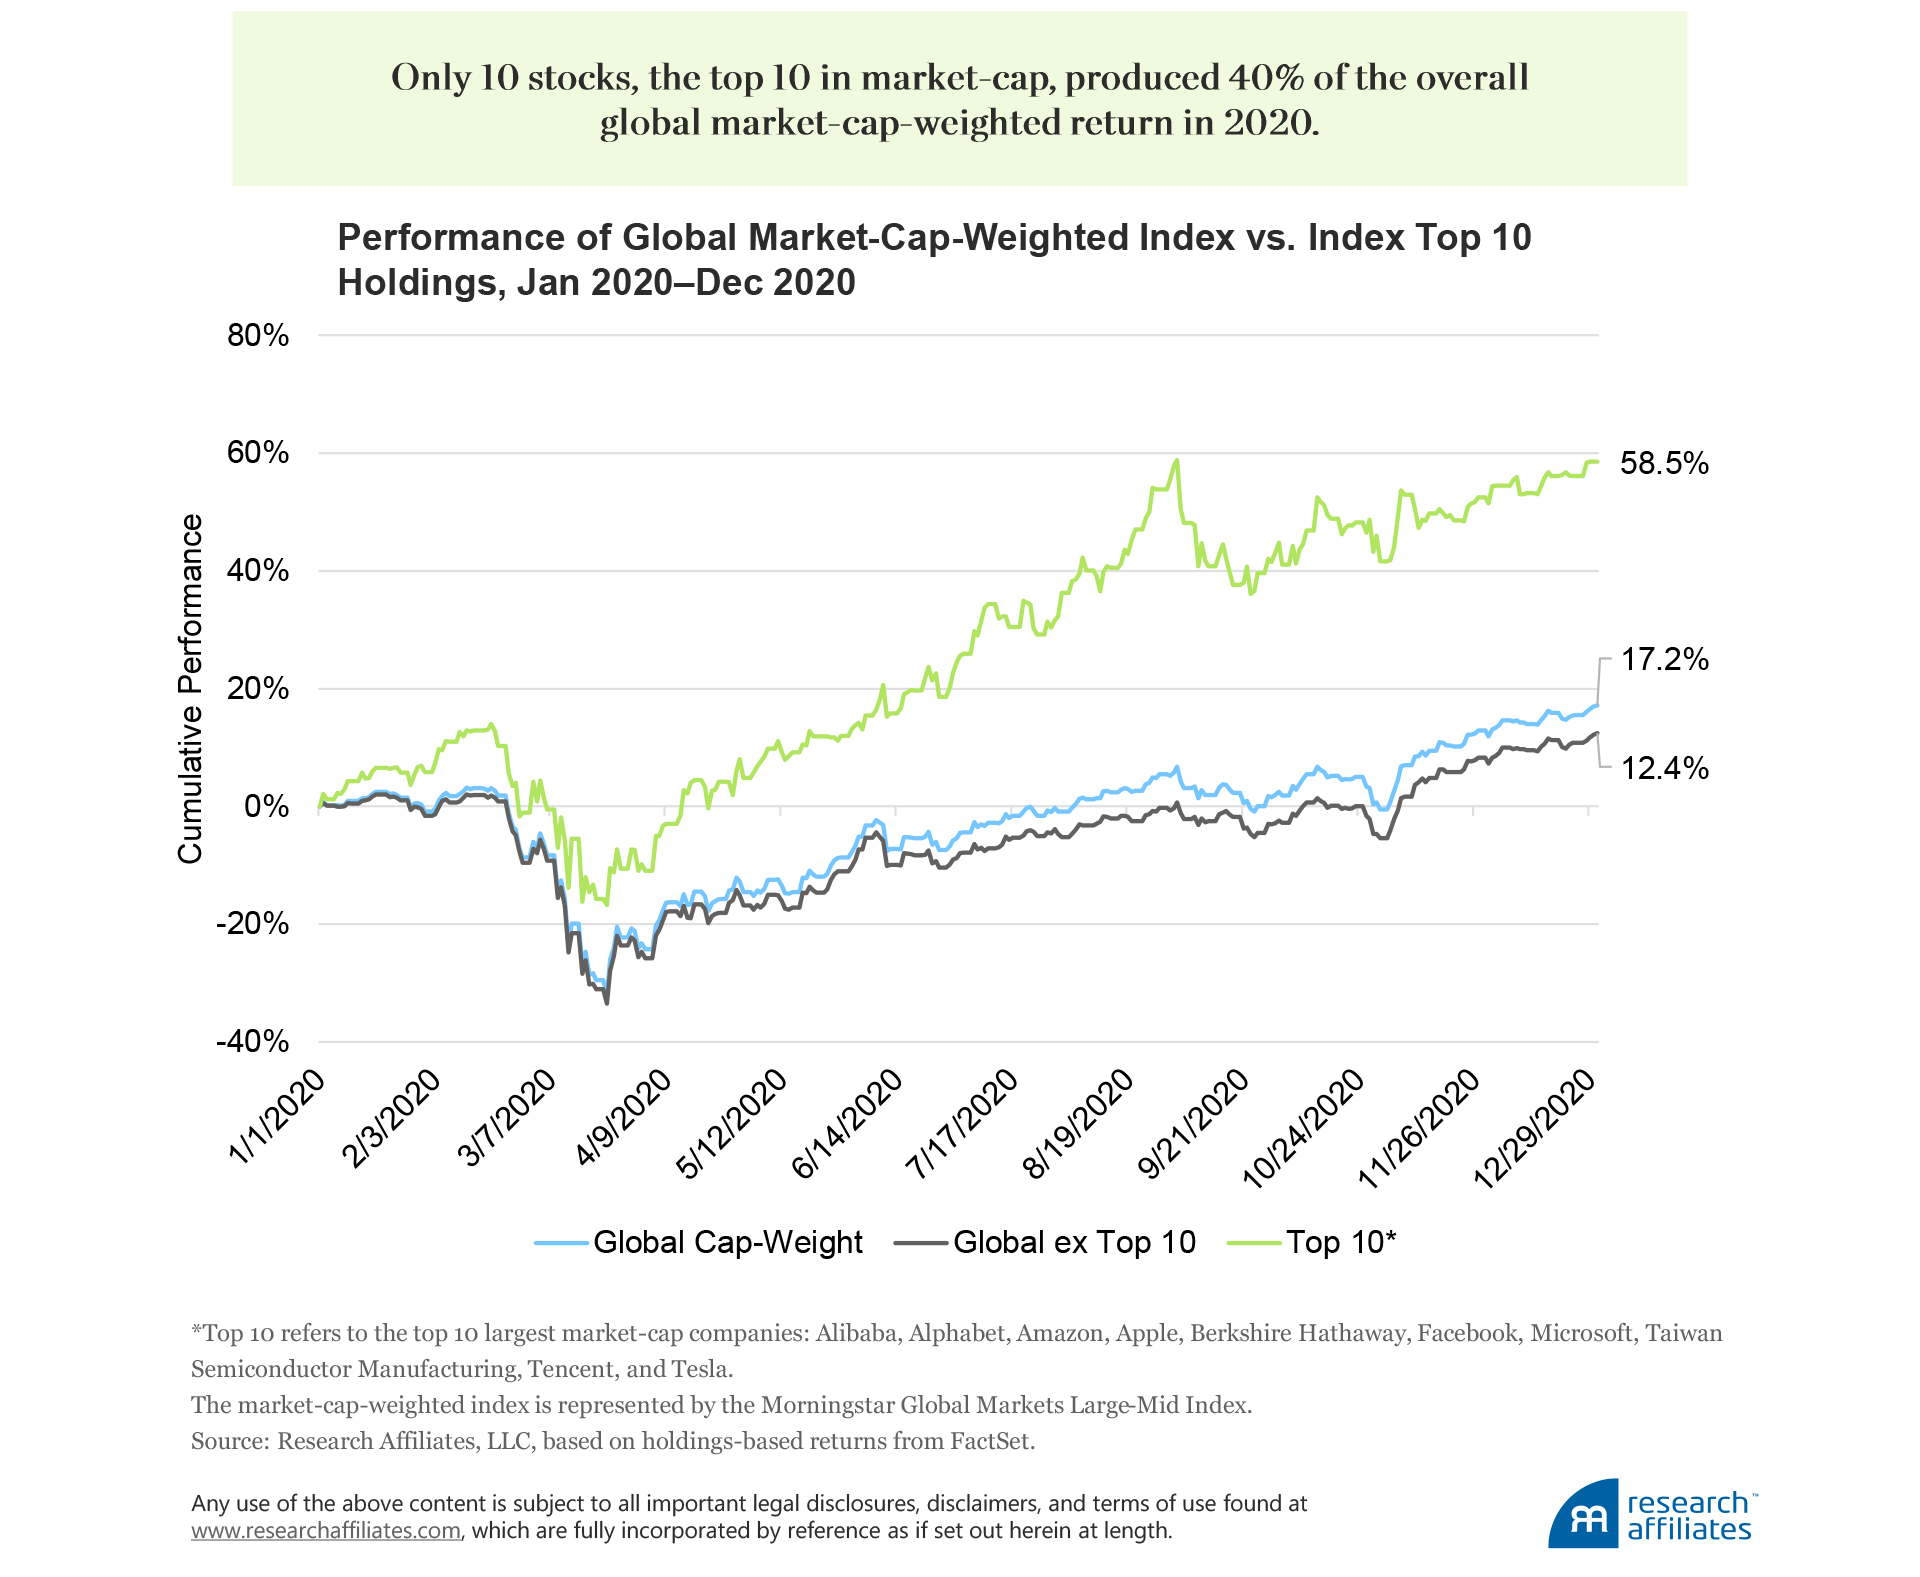
High concentration is a red flag for investors, because the top market-cap stocks strongly influence the performance of a market-cap-weighted index. For instance, if we compare the performance of the market in 2020 with and without the top 10 stocks by market-cap (Alibaba, Alphabet, Amazon, Apple, Berkshire Hathaway, Facebook, Microsoft, Taiwan Semiconductor Manufacturing, Tencent, and Tesla), their influence in elevating returns is astonishing.
“The aggregate weight of the top 10 stocks in the global market-cap-weighted index hit an all-time high of 16.6% in September 2020.
”
The global cap-weight excluding the top 10 produced an impressive 12.4% cumulative return in a year roiled with a global pandemic. The top 10 stocks alone returned a cumulative 58.5% in 2020, increasing the return for the global cap-weight to 17.2%. That’s right, 10 stocks out of thousands contributed a staggering 40% of the global index’s overall return in 2020. Of course, the market was trending up, a best-case scenario, but watch out, when the market retreats, it usually falls far quicker than it rose.
That brings us to the big question. Are these growth-dominated titans overinflated from market hype, and could investors be in for a painful ride if their prices reverse course?
Today’s Titans: Discrepancy in Price vs. Intrinsic Value
Many accept the notion that markets are efficient and prices reflect all current and relevant information available to investors. Nevertheless, we are all well aware of the exuberance of capital markets and investors’ willingness to overpay for assets versus their perceived intrinsic value. Although history never repeats itself, it can be a useful guide for understanding the capital markets and investor behavior. An approach that Arnott, Li, and Sherrerd (2009a, b) used to analyze market exuberance is to compare a company’s clairvoyant value to its historical cap-weight. Nobel Laureate William Sharpe coined the term clairvoyant value in 1975. He defined the term as ex post realized value, or value that can only be determined after the fact or measured ex ante only with the perfect foresight of a clairvoyant. Arnott and his coauthors used discounted realized cash flows going back 50 years to calculate clairvoyant value and compare it against the-then market value to gauge how accurate market foresight was.
To bring more color to their analysis, Arnott, Li, and Sherrerd (2009a, b) categorized companies using a range of growth to value segments to determine if the market’s predictive ability was consistent across the spectrum, regardless of whether a company was a popular growth company or a traditional value company. With clairvoyant value as a yardstick, they found that investors tend to overly discount value companies and overpay for growth companies.
Given that today’s titans are heavily skewed toward growth companies, coupled with the concentration risk of their dominating a large part of a market-cap-weighted portfolio, the potential for future underperformance of these (likely overvalued) stocks and the portfolios that hold them has merit.
As Arnott, Kalesnik, and Wu (2021) observed, the 2020 pandemic-related lockdowns contributed to a tremendous rise in retail investor participation in the stock market, leading to some very curious asset-price anomalies over the last 12 months.
The percentage of shares traded in the US market by retail participants increased substantially over the last decade, jumping from 15% to 20% in 2020. Of real concern is a meaningful rise in the use of options, which are ultimately levered positions and serve to exacerbate the inefficiencies in the market. In 2020, higher retail participation introduced a new twist on the potential for a popular stock’s market price to deviate from its intrinsic value. A number of examples, which illuminate the effect of increased retail participation in the markets, are readily at hand.
In the early part of 2020 as offices closed due to COVID-19, the video and web conferencing platform Zoom benefited from the rapid transition to virtual meetings. Unsophisticated investors rushed to buy the stock with the ticker ZOOM, not recognizing the Zoom Video Communication’s ticker is ZM. ZOOM was Zoom Technologies, a Beijing-based company that had zero to do with virtual meetings. The surge in demand sent its stock price up 1000%! Once the realization kicked in that these “investors” had bought the wrong stock, Zoom Technologies’ price quickly collapsed (Wieczner, 2020).
“The only two companies to remain in the top 10 by market-cap since 2010 are Microsoft and Apple.”
Another buying frenzy occurred after Elon Musk tweeted in January 2021 that his followers should move from WhatsApp, a popular messaging app, to a privacy-focused messaging app called Signal. Signal was developed by the nonprofit Signal Foundation and is not a publicly traded company. Not to be deterred, Musk’s followers charged headlong into speculating in shares of a company called Signal Advance, which focuses on healthcare tech and has absolutely nothing to do with the messaging app. The episode caused a 1500% meteoric rise in the Signal Advance share price (Ho, 2021).
More recently, we have seen investors craze over anything related to electric vehicles (EV). New EV specialist auto makers are recording unprecedented valuations. Some makers, with billions in market value, have yet to sell a car. The net result from this surge in EV valuations is that the global auto industry has almost doubled in value, strongly driven by the EV addiction (Arnott, Cornell, and Wu, 2021). The number of all cars on the road does not appear to have doubled, and the EV specialists leading the pack do not appear to have a profit margin advantage over traditional auto makers. We can only conclude that the elevated stock prices of EV companies look like a bubble, feel like a bubble, and most likely are another example of market inefficiency partly fueled by the glamourous growth rush of retail investors.
Overall, the increasing numbers of retail investors are gravitating to the success stories of the popular growth stocks, putting even more upward pressure on the titans’ prices. Particularly in the United States, a growing cohort of “Robinhooders” (named after the commission-free trading platform Robinhood) has the ability to trade fractions of these shares at extremely low—if any—cost. As of December 2020, the top 10 companies had a weighted-harmonic-average valuation multiple of 12.6, three times higher than the rest of the global equity universe.
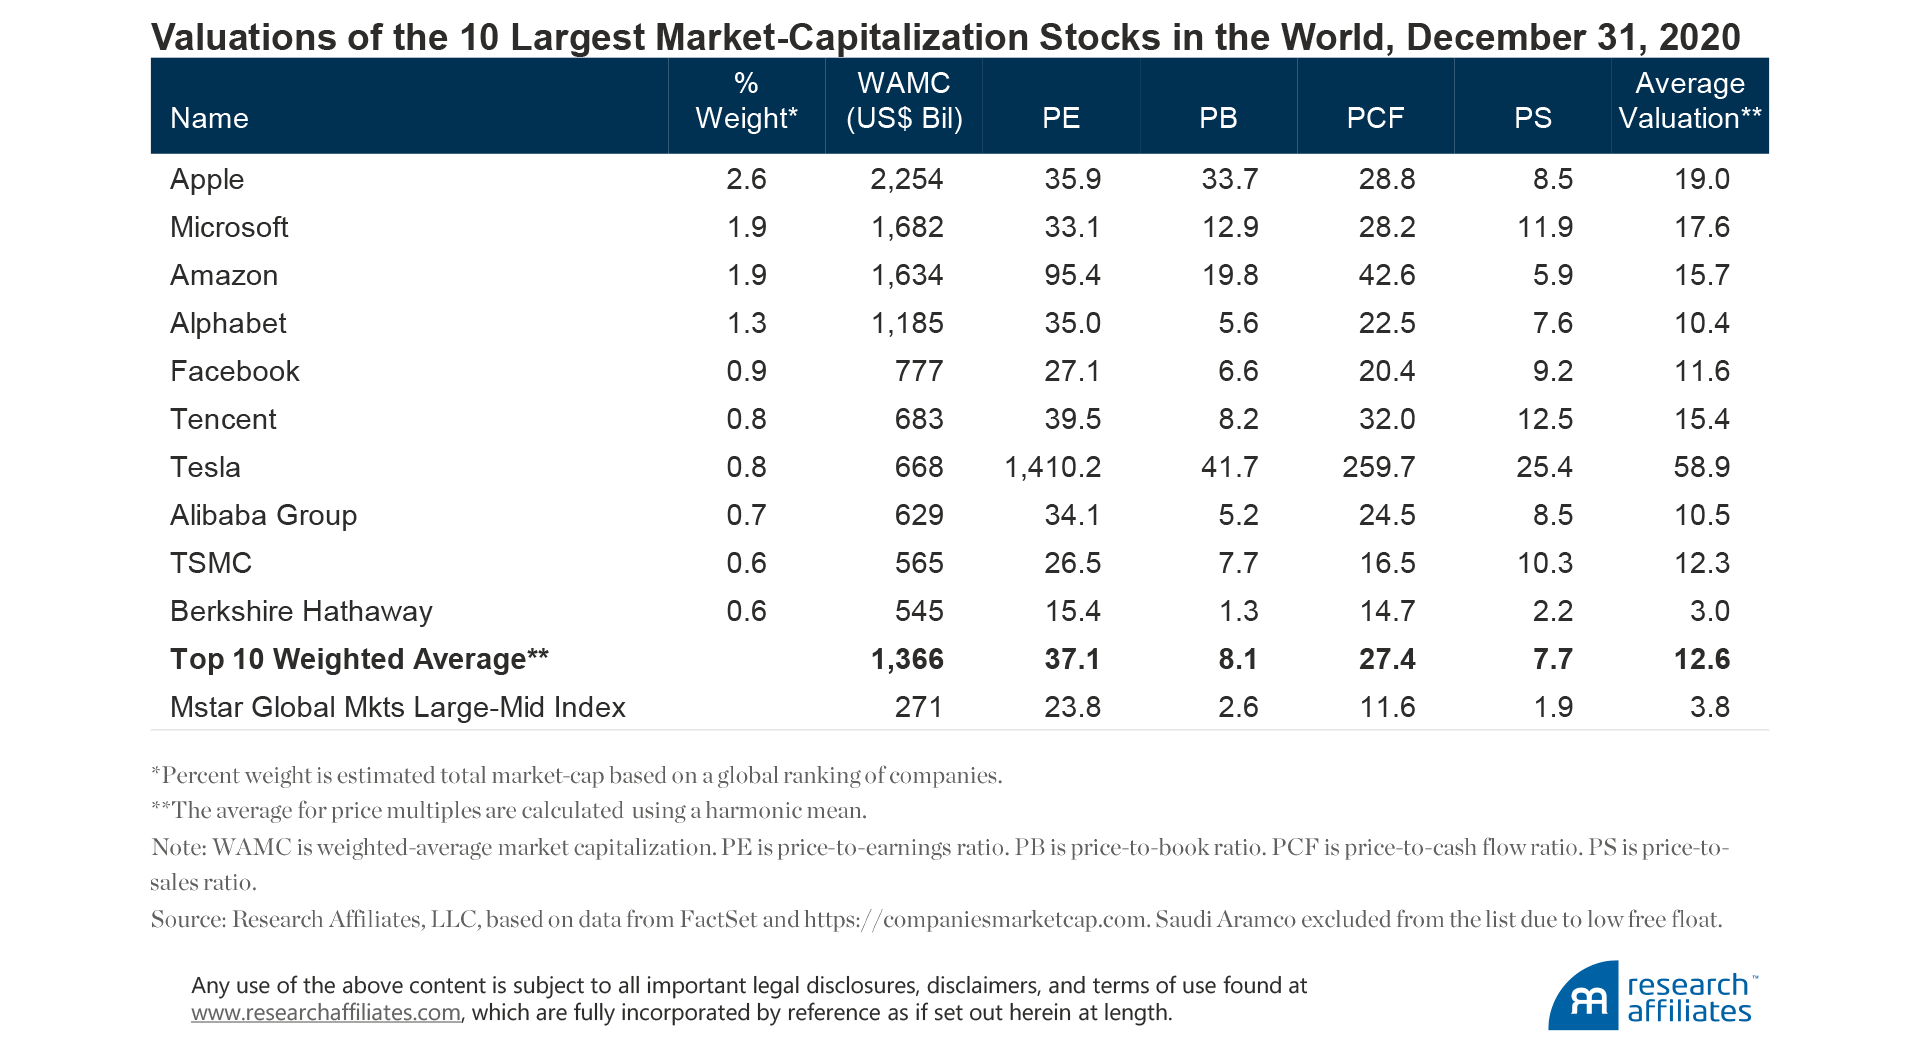
This huge valuation multiple represents a substantial premium for investors in global market-cap-weighted indices. We are not saying these dominating titans are not good companies, but are they worth their current prices? At the peak of the tech bubble, Cisco had a price-to-earnings ratio of 200 times. Its share price tumbled 86% during the market correction, even though its company fundamentals continued to grow. Just like the tech companies in favor today, Cisco was a great company, but its share price exploded, fueled by investor exuberance.
The argument that low (and negative) interest rates justify higher valuations does not seem to hold water when the 10 largest companies by market-cap have an aggregate valuation multiple three times higher than the market. Add in the growing numbers of unsophisticated investors who are buying and selling stocks based largely on speculation, and the result is a potent mix for investors in today’s stock titans. For investors who are worried about the implications for their portfolios, solutions are available to help alleviate this concentration risk.
An Effective Strategy to Mitigate Concentration Risk
Smart beta multi-factor strategies are able to improve portfolio diversification in terms of both concentration risk and investment style. This characteristic is coupled with an objective to deliver a long-term return premium in a transparent manner and at a cost-effective price.
Factor investing strategies have been around for decades and are supported by a substantial body of academic literature. A factor is a company attribute that has been shown over time to deliver a return premium to investors. A very popular factor, which until recently had experienced a prolonged period of underperformance, is value. This extended period of poor performance relative to growth investing had caused many to debate if value was dead. In the fourth quarter of 2020, the tide began to turn for the value factor. With a continuation of the reversal into the first quarter of 2021, value stocks (proxied by the Russell 1000 Value Index) outperformed their growth counterparts (proxied by the Russell 1000 Growth Index) by an astonishing 10.3% in the US equity market, the largest outperformance in 20 years.
The value factor essentially selects the cheapest companies based on one or a combination of valuation ratios to form a portfolio of value stocks. Periodically refreshing, or rebalancing, the portfolio by rotating into newly cheap stocks and rotating out of appreciated stocks, helps retain the attractive value exposure.
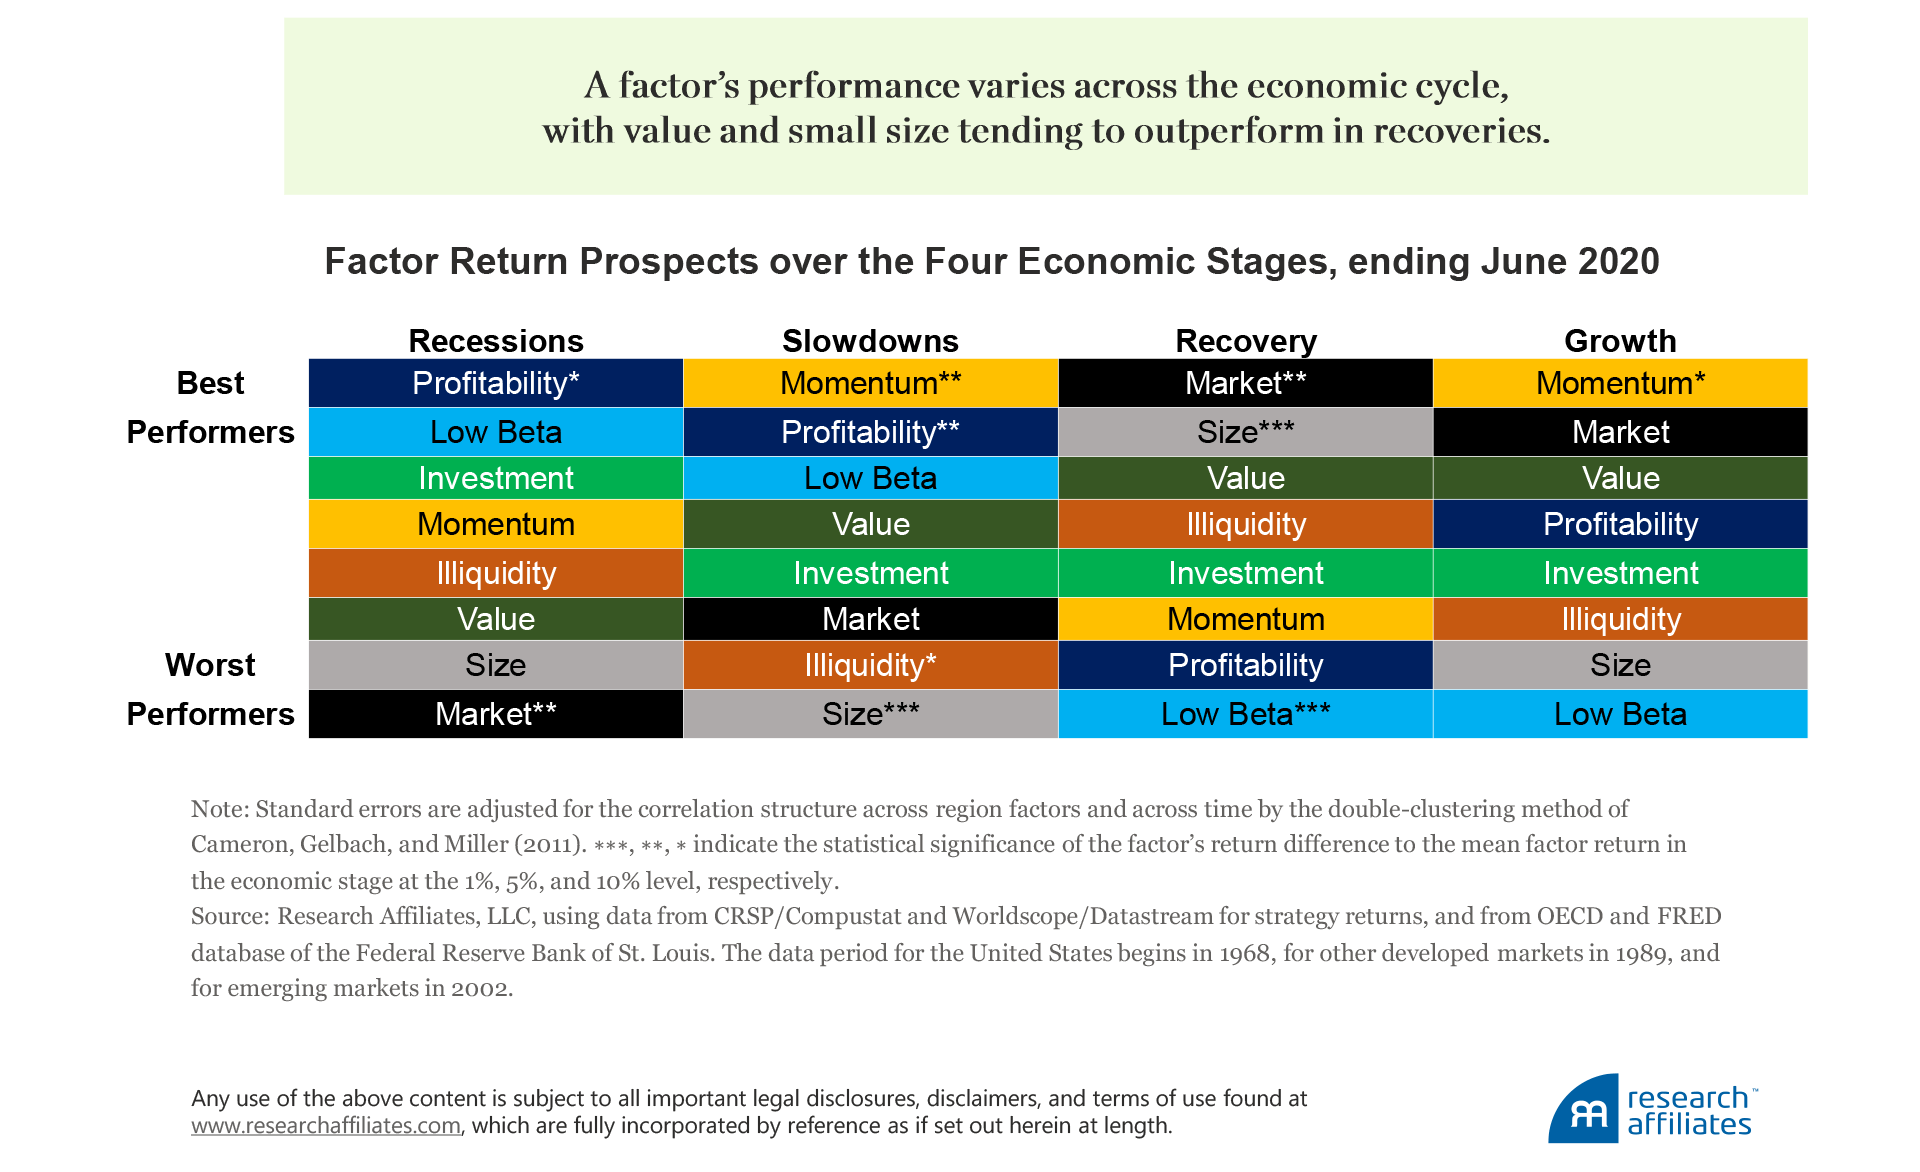
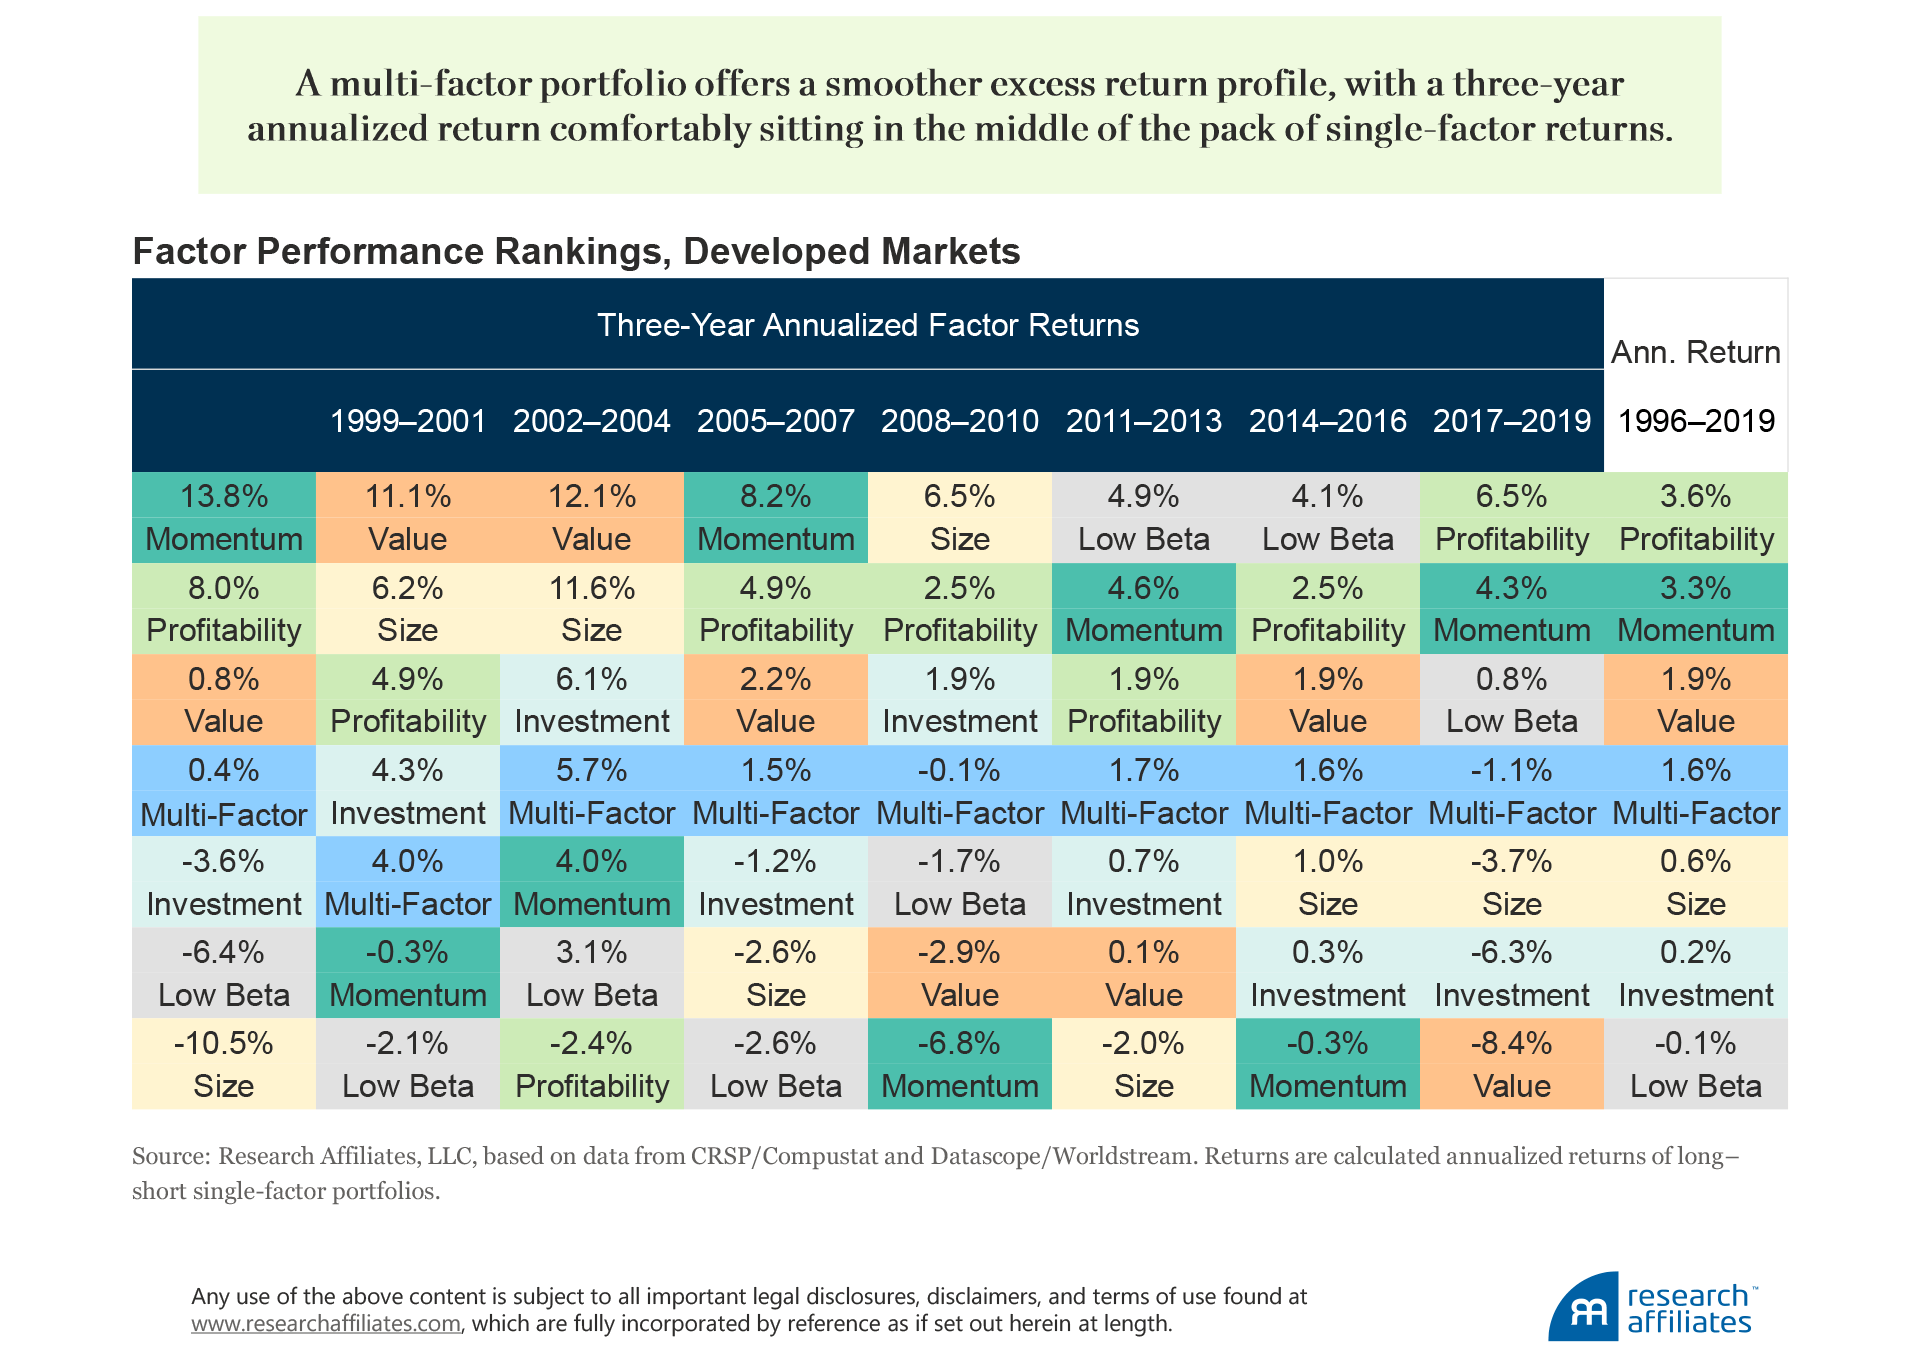
Other popular factors are quality, low volatility, momentum, and small size. Each factor alone has more volatile performance than when combined with other factors in a portfolio, because a factor’s performance tends to ebb and flow through economic cycles (Aked, 2020). We are beginning to observe a rotation among the factors from better or worse performing as global economies are vaccinating and entering economic recovery post pandemic lockdowns. As is consistent with history (Kalesnik and Polychronopoulos, 2020), factors such as small size and value are leading the charge, while low beta lags behind.
Over the long term, however, these popular factors have shown an ability to deliver a superior risk-adjusted return over the market. A multi-factor strategy aims to capture the return premiums from each factor, while smoothing out the performance ups and downs through diversification. A multi-factor strategy is less prone to severe crashes when compared to a factor in isolation, and combining the factors into a multi-factor portfolio provides a smoother excess return profile over time.
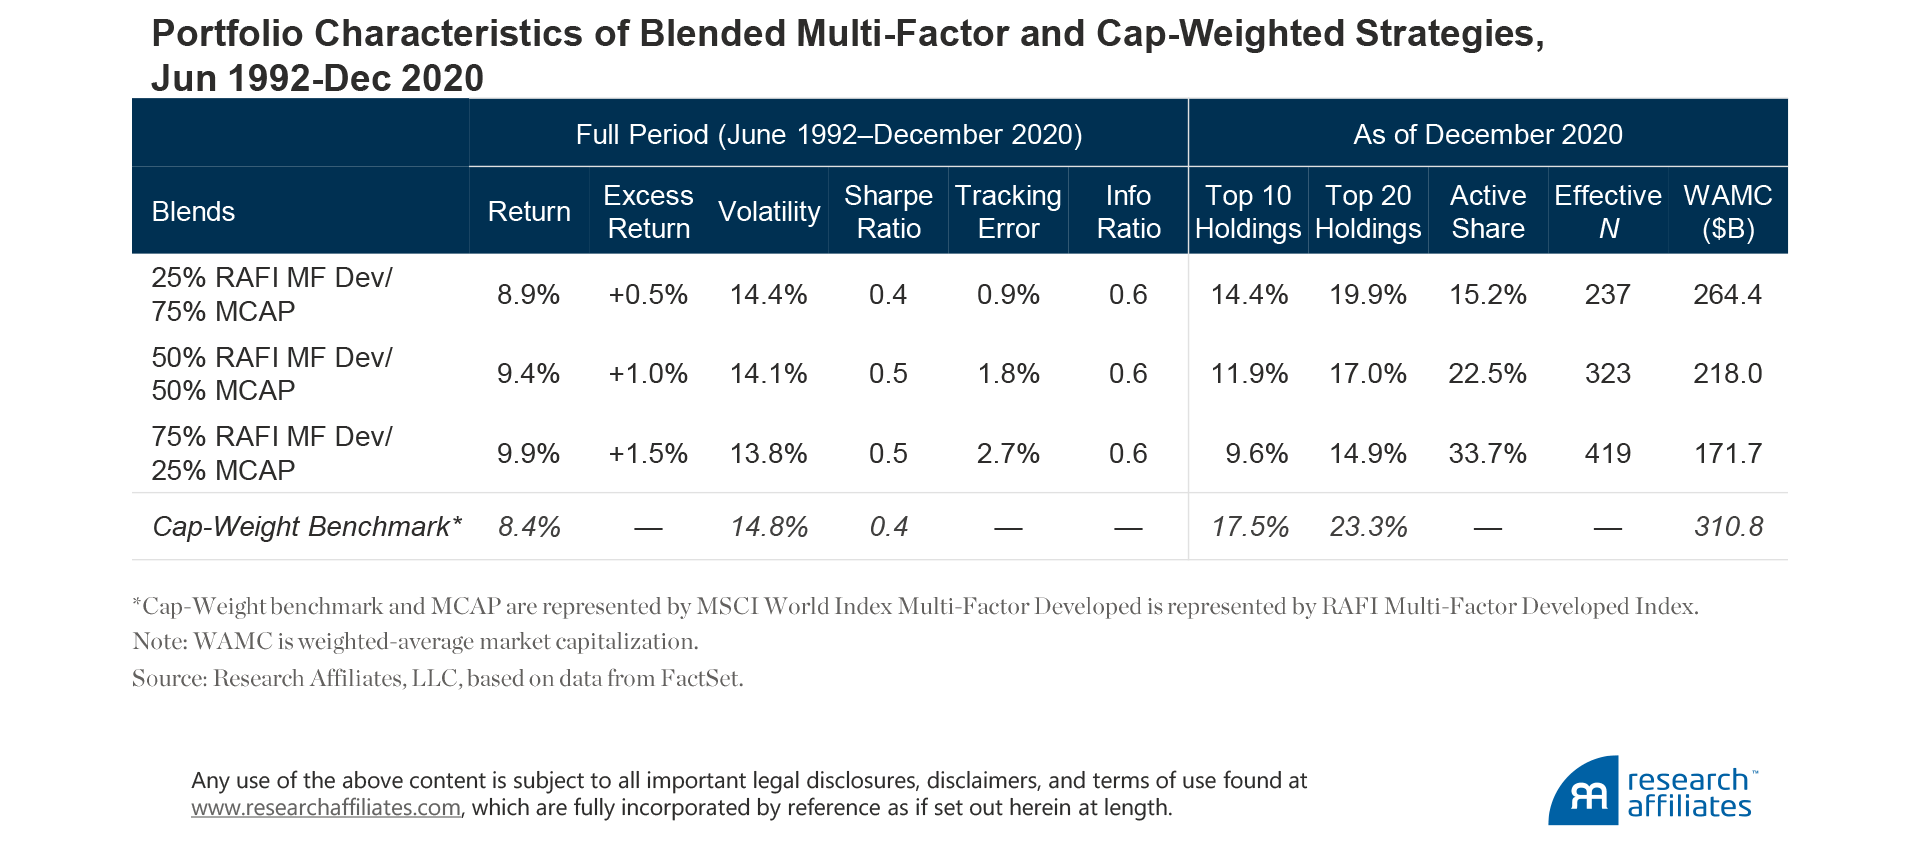
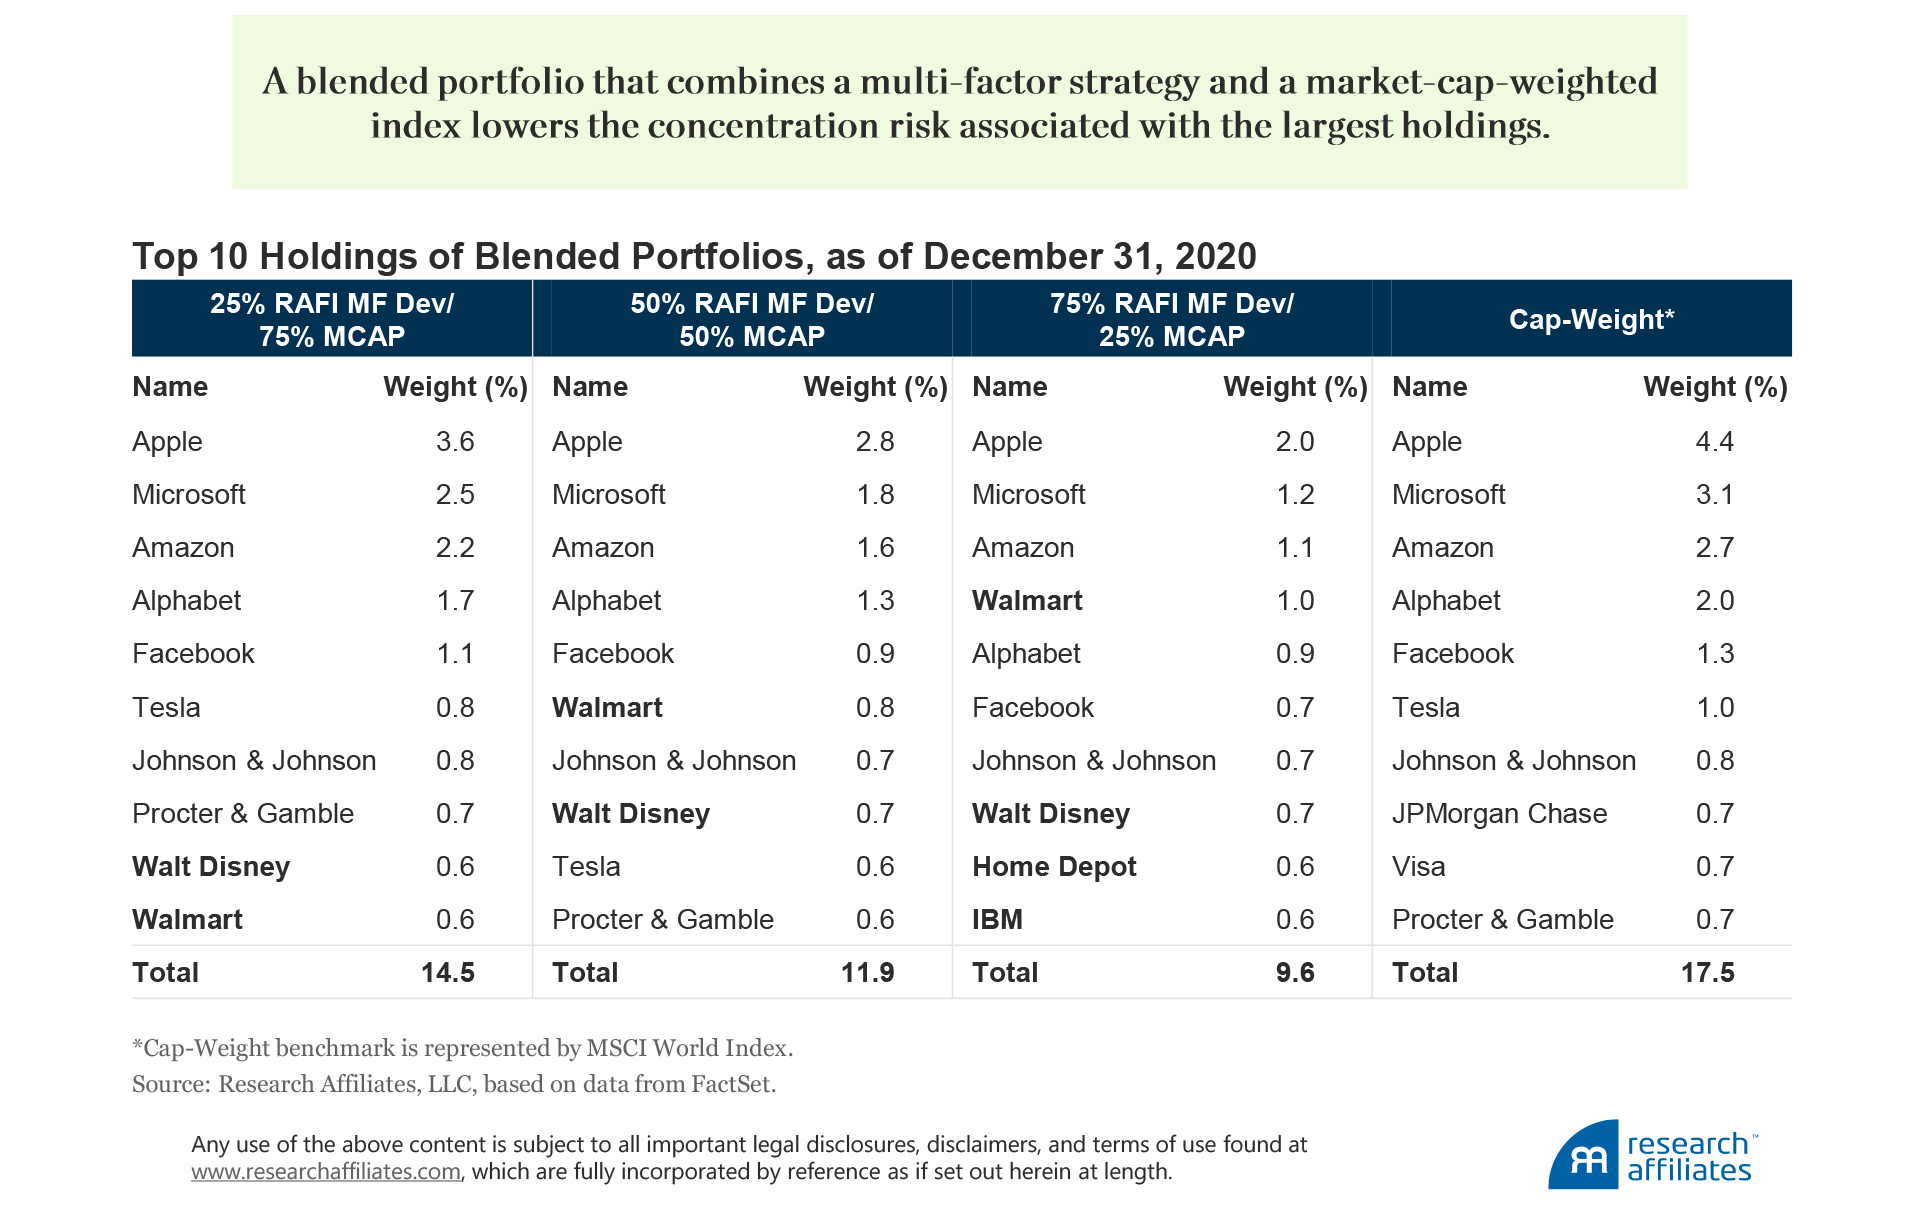
We can illustrate the diversification benefits of a multi-factor portfolio by creating blended portfolios with various allocations to a multi-factor strategy. We use a developed market benchmark, which can be thought of as a traditional passive global allocation, as the portfolio we wish to diversify. The top 10 holdings of the benchmark represent 17.5% of the index as of December 31, 2020.
Over the period June 1992 through December 2020, blending in a 25% allocation of a multi-factor strategy to the developed market benchmark reduces concentration to 14.4% and increases expected long-term excess return by 0.5%. Increasing the multi-factor allocation to 50% reduces concentration to 11.9% and improves the expected-return profile by 1.0%. In both of these blended portfolios, tracking error is below 2.0%. A more-aggressive allocation of 75% to a multi-factor strategy decreases the concentration to 9.6%, keeps tracking error below 3.0%, and raises the historic excess return by 1.5%.
The top 10 holdings of each of the blended portfolios are not completely overhauled from the benchmark’s top holdings, but are instead diluted so their performance is less influential over the blended portfolio’s return. Even with a 75% allocation to a multi-factor strategy, six of the top 10 stocks in the benchmark remain, albeit at a lower weight, in the top 10 and are joined by four new stocks: Walmart, Walt Disney, Home Depot, and IBM.
Investors who incorporate a multi-factor strategy in their passive allocations not only reduce their dependency on these large titan stocks, but they can harness the return premiums from well-researched investment factors. The result is a better-diversified passive core allocation with the potential for generating return in excess of the market over the long term.
Conclusion
The corporate titans in a traditional passive tracker strategy are so engrained in our daily lives it takes a healthy imagination to envision they may not stand the test of time. Nevertheless, in the same way the Greek Titans believed their rule was safe before it collapsed, the tables can also turn for these corporate titans. A half-century of history shows that the market’s titan stocks constantly change. Investing in today’s titans is especially risky because their concentration is at higher levels than during the dot-com bubble and their valuations are five times that of the market. This concentration risk can end in tears and sorrow. For investors who prefer to remain well diversified and to mitigate these high and dangerous concentrations, a blended smart beta multi-factor approach can be an attractive solution.
Copyright © Rsearch Affiliates