by Don Vialoux, EquityClock.com
Technical Notes released yesterday at
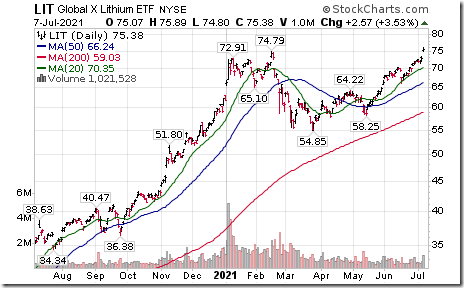
Lithium ETN $LIT moved above $74.83 to an all-time high extending an intermediate uptrend.
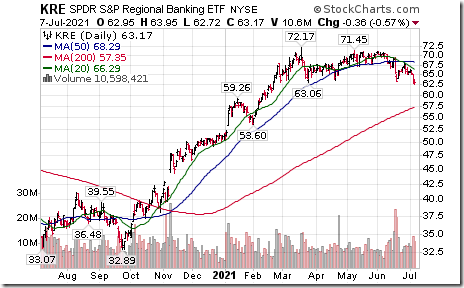
U.S. Regional Bank ETF $KRE moved below $63.06 completing a double top pattern. Lower long term rates are narrowing interest rate spreads.
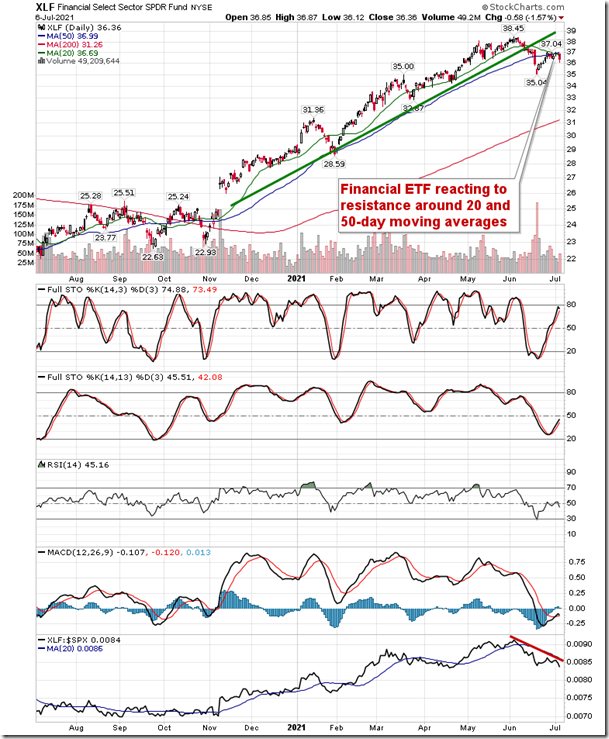
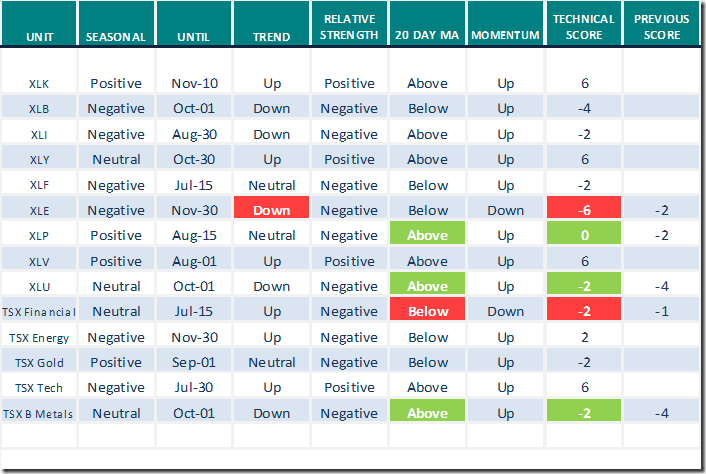
Core cyclical sectors reversing from levels of resistance around major moving averages, threatening the seasonal rebound in these segments through the middle of the month. equityclock.com/2021/07/06/… $XLB $XLI $XLF $XLP
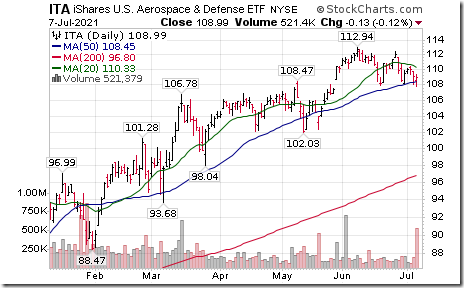
U.S. Aerospace iShares $ITA moved below $107.92 completing a double top pattern.
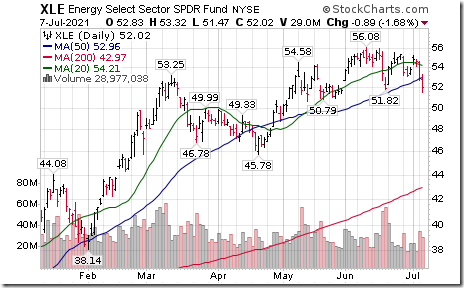
U.S. Energy Select Sector SPDRs $XLE moved below $51.82 completing a double top pattern.
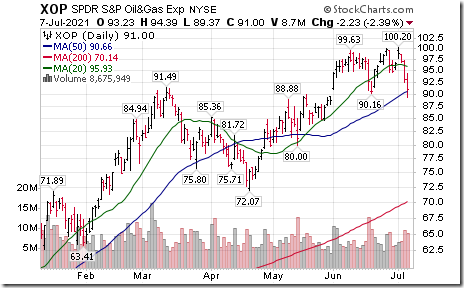
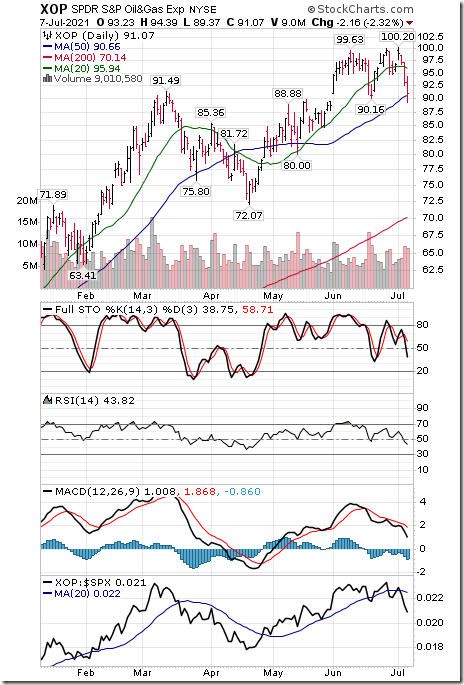
U.S. Oil & Gas Explorations SPDRs $XOP moved below $90.16 completing a double top pattern
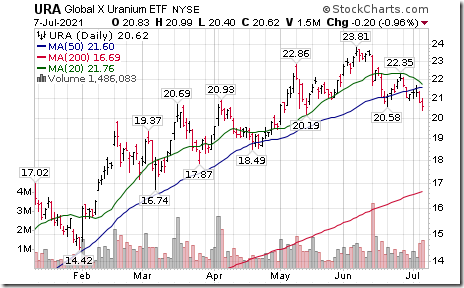
Uranium equity ETF $URA moved below $20.58 completing a double top pattern.
Editor’s Note: Units responded mainly to weakness in Cameco. CCJ has a similar technical pattern.
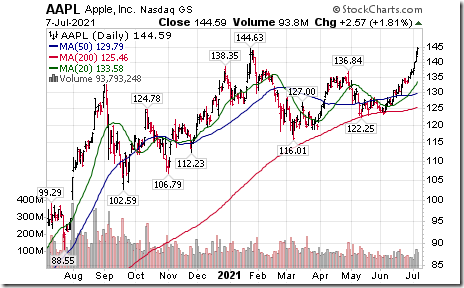
Apple $AAPL a Dow Jones Industrial Average stock moved above $144.63 to an all-time high extending an intermediate uptrend.
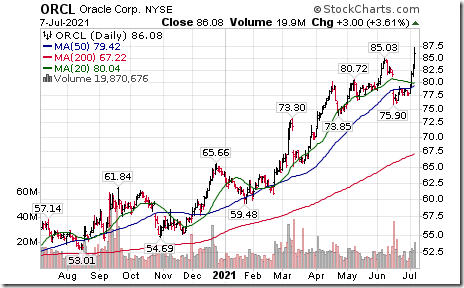
Oracle $ORCL an S&P 100 stock moved above $85.03 to an all-time high extending an intermediate uptrend.
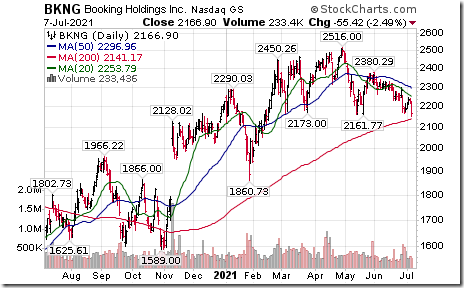
Bookings Holdings $BKNG a NASDAQ 100 stock moved below $2161.77 completing a Head & Shoulders pattern
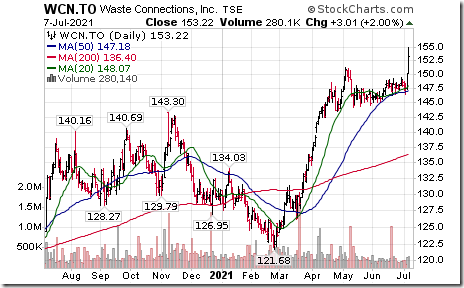
Waste Connections $WCN.CA a TSX 60 stock moved above $151.21 to an all-time high extending an intermediate uptrend.
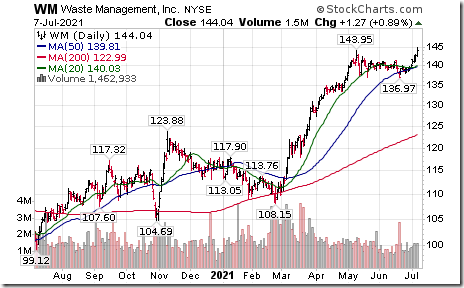
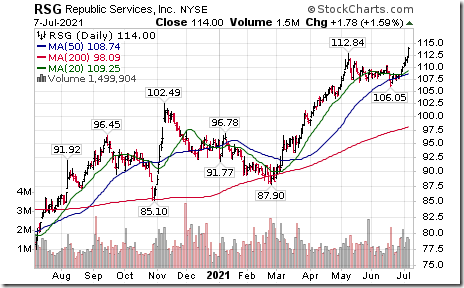
Editor’s Note: Waste management stocks in the U.S. also were strong. Waste Management and Republic Services broke to all-time highs.
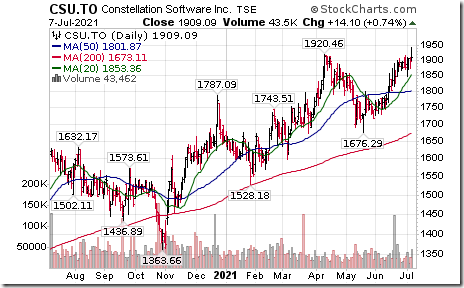
Constellation Software $CSU.CA a TSX 60 stock moved above $1920.46 to an all-time high extending an intermediate uptrend
Trader’s Corner
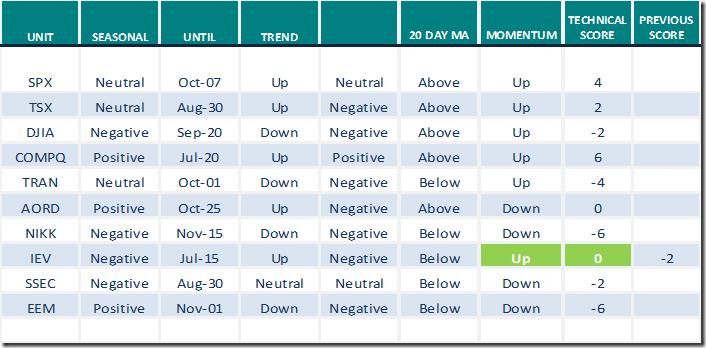
Equity Indices and Related ETFs
Daily Seasonal/Technical Equity Trends for July 7th 2021
Green: Increase from previous day
Red: Decrease from previous day
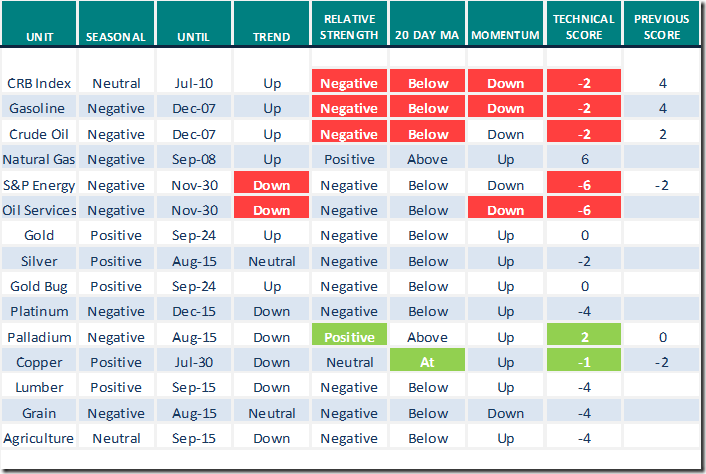
Commodities
Daily Seasonal/Technical Commodities Trends for July 7th 2021
Green: Increase from previous day
Red: Decrease from previous day
Sectors
Daily Seasonal/Technical Sector Trends for July 7th 2021
Green: Increase from previous day
Red: Decrease from previous day
All seasonality ratings are based on performance relative to the S&P 500 Index
Comments from” uncommon Sense Investor”
Thank you to Mark Bunting and www.uncommonsenseinvestor.com for a link to the following comments and videos.
Mark interviewed John O’Connell, CEO of Davis Rea. Topic was Third Quarter Outlook: “Focus on Really Strong Dominant Players” Following is the link:
Third Quarter Outlook: "Focus on Really Strong Dominant Players" – Uncommon Sense Investor
BCA Research offers its third quarter strategy outlook. Headline reads, “A Path to a New Normal”. Following is the link:
The Path to the New Normal – Uncommon Sense Investor
What are equity market bears saying? Following is a link for an article entitled, “Calls from heavyweights for epic crash piling up”. Following is the link:
Calls From Market Heavyweights For Epic Crash Are Piling Up – Uncommon Sense Investor
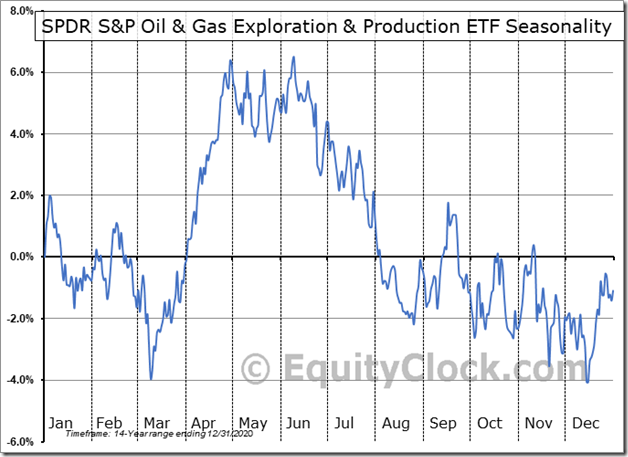
Seasonality Chart of the Day from www.EquityClock.com
U.S. energy stocks and related ETFs on a real and relative basis (relative to the S&P 500 Index) have a history of moving lower from mid-June to at least the end of August and frequently to mid-December. Technical weakness by XOP and XLE yesterday confirms that seasonality is influencing U.S. energy stocks once again this fall.
Technicals for the U.S. oil and gas exploration SPDRs (OIH) and Energy SPDRs (XLE) became more negative yesterday: Previously, short term momentum indicators (Daily Stochastics, RSI, MACD) had turned lower, units moved below their 20 day moving average and strength relative to the S&P 500 had turned negative.
Yesterday, units moved below intermediate support.
.
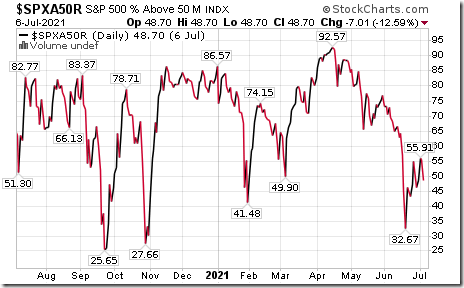
S&P 500 Momentum Barometers
The intermediate term Barometer dropped 7.01 to 48.70 yesterday. It remains Neutral.
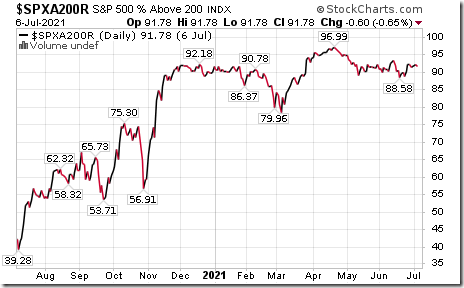
The long term Barometer slipped 0.60 to 91.78 yesterday. It remain Extremely Overbought.
TSX Momentum Barometers
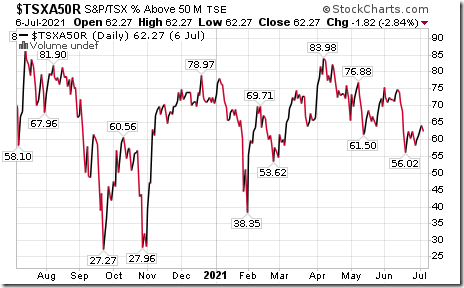
The intermediate Barometer slipped 1.82 to 62.27 yesterday. It remains Overbought.
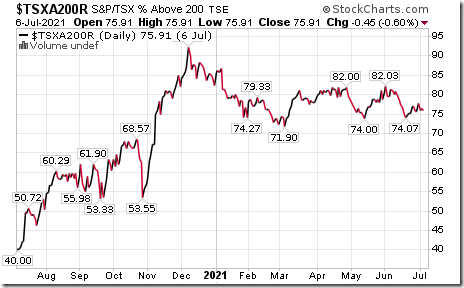
The long term Barometer slipped 0.45 to 75.91 yesterday. It remains Overbought.
Disclaimer: Seasonality and technical ratings offered in this report and at
www.equityclock.com are for information only. They should not be considered as advice to purchase or to sell mentioned securities. Data offered in this report is believed to be accurate, but is not guaranteed
This post was originally publised at Vialoux's Tech Talk.


