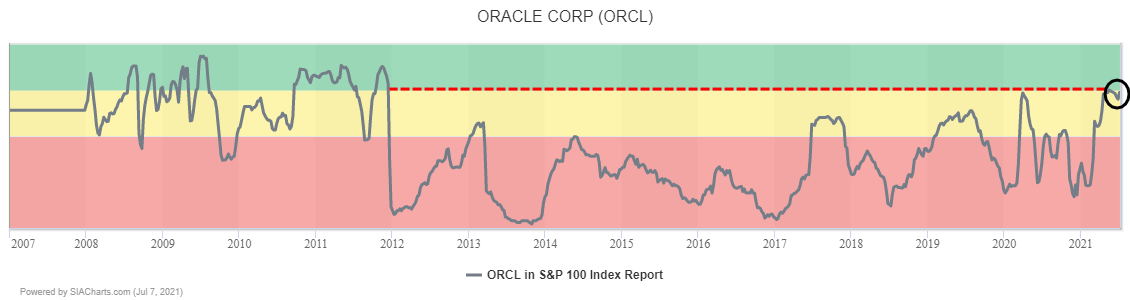
Oracle Corp (ORCL) has returned to the Green Favored Zone in the SIA S&P 100 Index Report for the first time in nearly a decade, since 2011 after climbing 4 spots yesterday and 8 spots in the last week to 34rd place.
Since the start of this month, Oracle (ORCL) shares have been attracting new interest from investors, rallying up off of their 50-day moving average on increasing volumes. Yesterday, the shares staged a major breakout, blasting through $85.00 to a new all-time high, completing a bullish Ascending Triangle pattern and signaling the start of a new upleg.
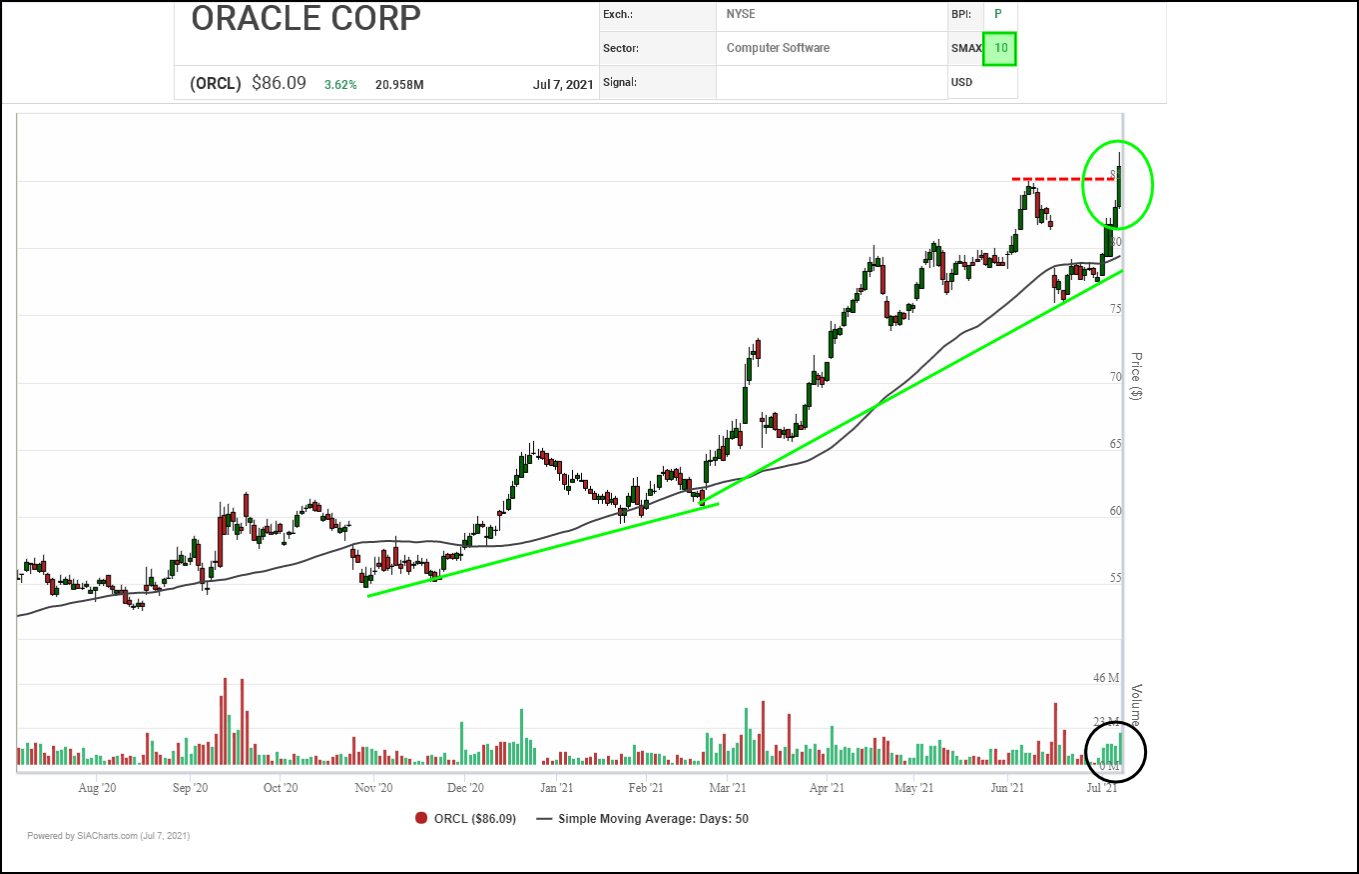
Based on measured moves, next potential upside resistance appears near $93.50 and $102.00 on trend, the latter close to the $100.00 round number. Initial support appears in the $79.00 to $80.00 area near the 50-day average and a round number.
Compared with the steady staircase pace of the 2011-2019 period, accumulation in Oracle (ORCL) shares has accelerated significantly since the March 2020 market bottom as shown by the slope of the two arrows in the chart. This week, Oracle has broken out to a new all-time high once again, completing a bullish Double Top to signal the start of a new upleg and confirm previous breakouts remain active.
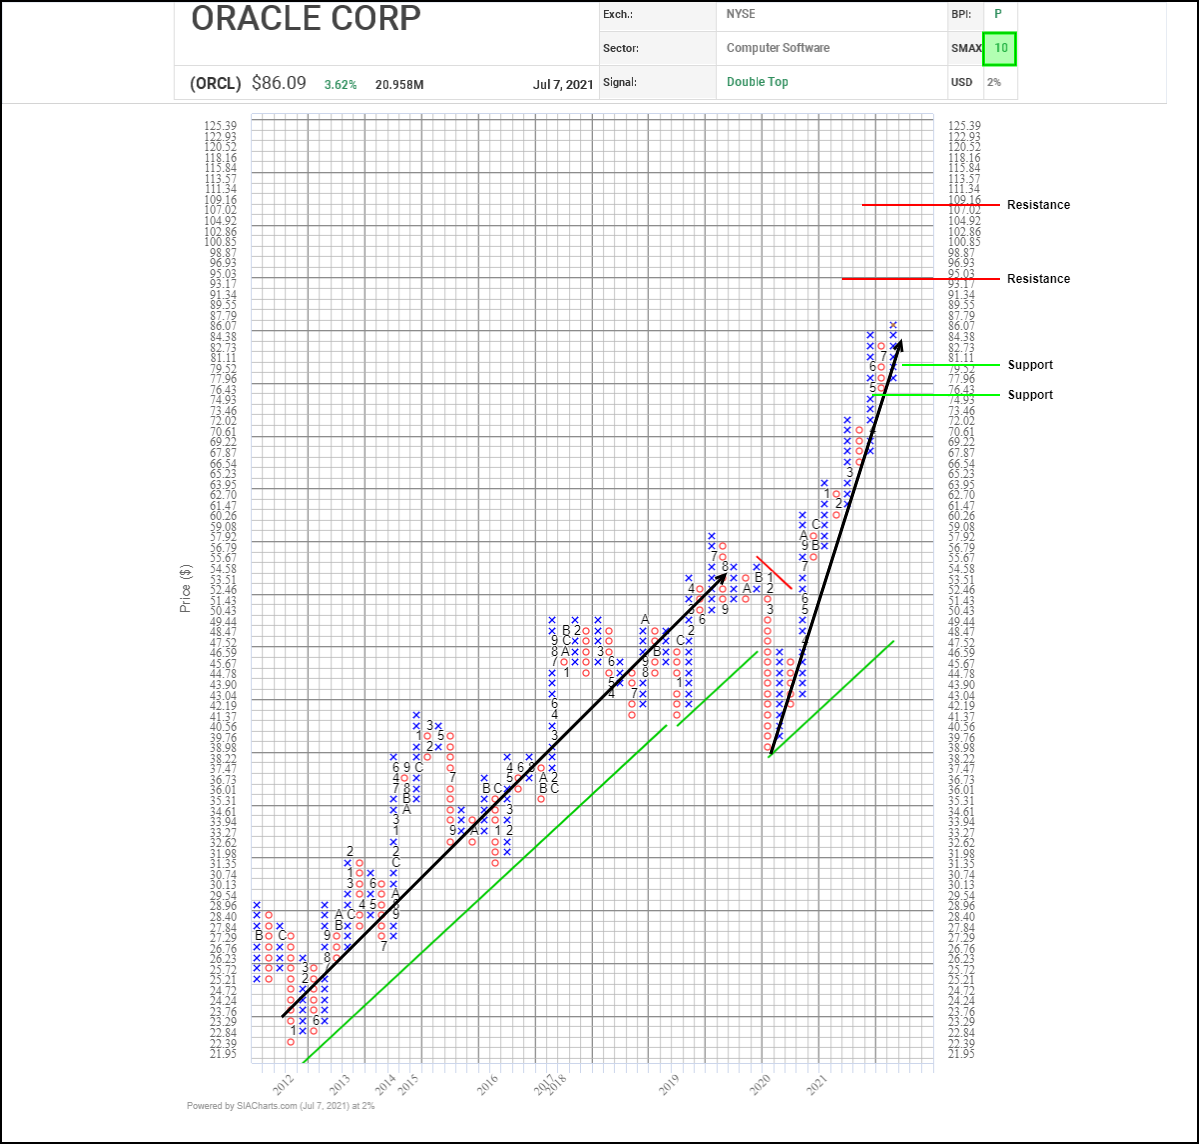
Based on vertical and horizontal counts, potential upside resistance appears near $95.05 and $109.20, with the $100.00 round number in-between them. Initial support appears near $79.50 based on a 3-box reversal.
With its bullish SMAX score increasing to a perfect 10, ORCL is exhibiting strength across the asset classes.
Disclaimer: SIACharts Inc. specifically represents that it does not give investment advice or advocate the purchase or sale of any security or investment whatsoever. This information has been prepared without regard to any particular investors investment objectives, financial situation, and needs. None of the information contained in this document constitutes an offer to sell or the solicitation of an offer to buy any security or other investment or an offer to provide investment services of any kind. As such, advisors and their clients should not act on any recommendation (express or implied) or information in this report without obtaining specific advice in relation to their accounts and should not rely on information herein as the primary basis for their investment decisions. Information contained herein is based on data obtained from recognized statistical services, issuer reports or communications, or other sources, believed to be reliable. SIACharts Inc. nor its third party content providers make any representations or warranties or take any responsibility as to the accuracy or completeness of any recommendation or information contained herein and shall not be liable for any errors, inaccuracies or delays in content, or for any actions taken in reliance thereon. Any statements nonfactual in nature constitute only current opinions, which are subject to change without notice.