by Don Vialoux, EquityClock.com
The Bottom Line
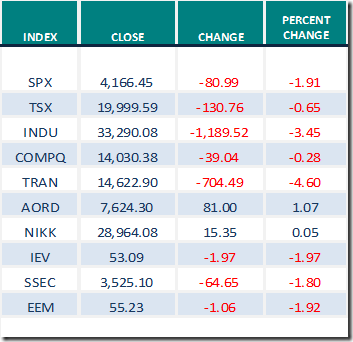
Most world equity indices moved lower last week following release of the Federal Reserve’s report on interest rates on Wednesday. Greatest influences on North American equity markets are possibility of a fourth wave by COVID 19 (negative) and continued expansion of distribution of a vaccine (positive).
Observations
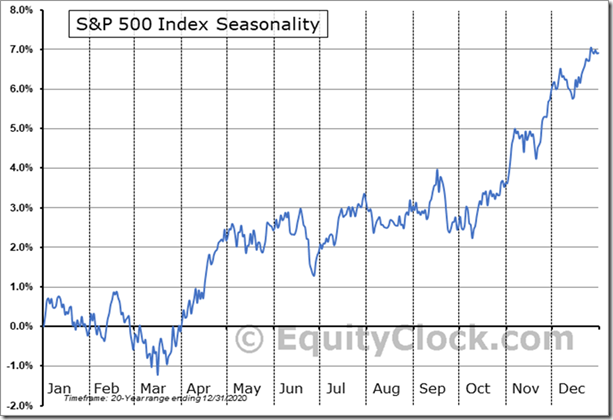
The S&P 500 Index is following its historic seasonal pattern for this time of year, a mixed, choppy period between early May and the second week in October. Average return during this period is close to zero. Note the tendency for the S&P 500 Index to decline during the last two weeks in June. Positive returns for the period are possible by selecting sector investments that outperform.
Short term short term indicators for U.S. equity indices and sectors (20 day moving averages, short term momentum indicators) moved lower last week.
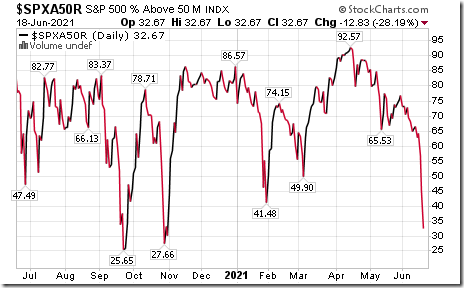
Intermediate term technical indicator for U.S. equity markets (e.g. Percent of S&P 500 stocks trading above their 50 day moving average) moved lower again last week. It changed last week from Overbought to Oversold and is trending down. See Barometer charts at the end of this report.
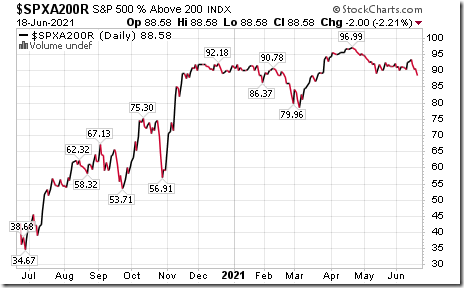
Long term technical indicator for U.S. equity markets (e.g. Percent of S&P 500 stocks trading above their 200 day moving average) moved lower last week. It remained Extremely Overbought. See Barometer chart at the end of this report.
Short term momentum indicators for Canadian indices and sectors moved lower last week.
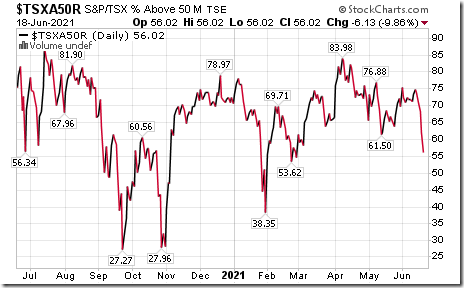
Intermediate term technical indicator for Canadian equity markets moved lower last week. It changed from Overbought to Neutral and is trending down. See Barometer chart at the end of this report.
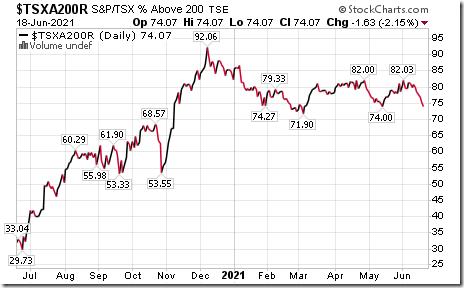
Long term technical indicator for Canadian equity markets (i.e. Percent of TSX stocks trading above their 200 day moving average) remained Overbought and is trending down. See Barometer charts at the end of this report.
Consensus estimates for earnings by S&P 500 companies continued to increase from our report last week. According to www.FactSet.com earnings in the second quarter are expected to increase 61.9% (versus previous estimate at 61.5%) and revenues are expected to increase 19.4% on a year-over-year basis (versus 19.3% last week). Earnings in the third quarter are expected to increase 23.0% (versus previous estimate at 22.9%) and revenues are expected to increase 12.0%. Earnings in the fourth quarter are expected to increase 17.4% (versus previous estimate at 17.3%) and revenues are expected to increase 8.9%. Earnings for all of 2021 are expected to increase 34.8% (versus previous estimate at 34.7%) and revenues are expected to increase 12.1%.
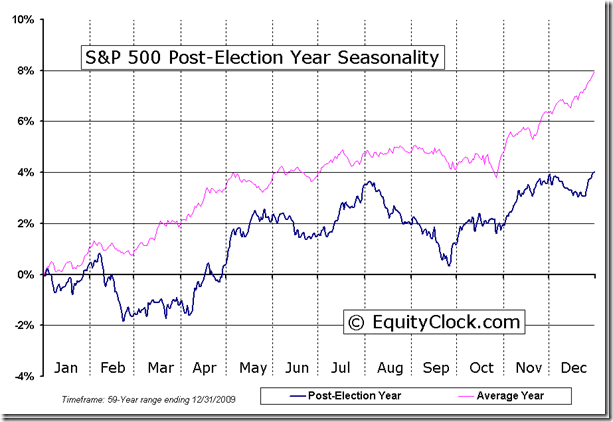
Peak sales and earnings gains by S&P 500 companies into the second quarter of a Post Presidential Election Year historically have prompted the S&P 500 Index to move slightly lower during the last two weeks in June followed by strength to all-time highs by the end of July. Thereafter, the S&P 500 Index has moved into an intermediate correction when the recently elected President finds that major parts of his progressive agenda are less likely to be approved by Congress.
Economic News This Week
May U.S. Existing Home Sales to be released at 10:00 AM EDT on Tuesday are expected to slip to 5.71 million from 5.85 million units.
April Canadian Retail Sales to be released at 8:30 AM EDT on Wednesday are expected to drop 5.1% versus a gain of 3.5% in March. Excluding auto sales, April Retail Sales are expected to increase 2.2% versus a gain of 4.3% in March.
May U.S. New Home Sales to be released at10:00 AM EDT on Wednesday are expected to increase to 870,000 units from 863,000 units in April.
May Durable Goods Orders to be released at 8:30 AM EDT on Thursday are expected to increase 1.9% versus a decline of 1.3% in April. Excluding aircraft sales, May Durable Goods Orders are expected to increase 0.8% versus a gain of 1.0% in April.
Next estimate of annualized first quarter real GDP growth to be released at 8:30 AM EDT on Thursday is 6.4% versus growth at a 4.3% rate in the fourth quarter.
May Personal Income to be released at 8:30 AM EDT on Thursday is expected to drop 2.0% versus a drop of 13.1% in April. May Personal Spending is expected to increase 0.4% versus a gain of 0.5% in April.
June Michigan Consumer Sentiment to be released at 10:00 PM EDT on Friday is expected to remain unchanged from May.at 86.4.
Earnings News This Week
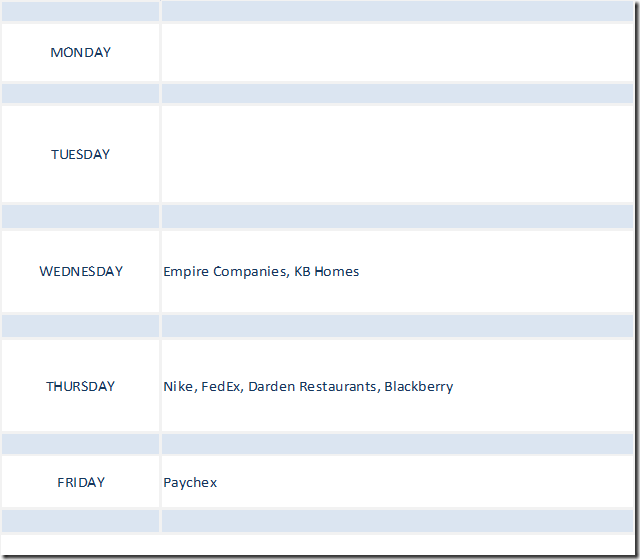
Quiet week! Focuses are on KB Homes, Nike and FedEx.
Trader’s Corner
Equity Indices and Related ETFs
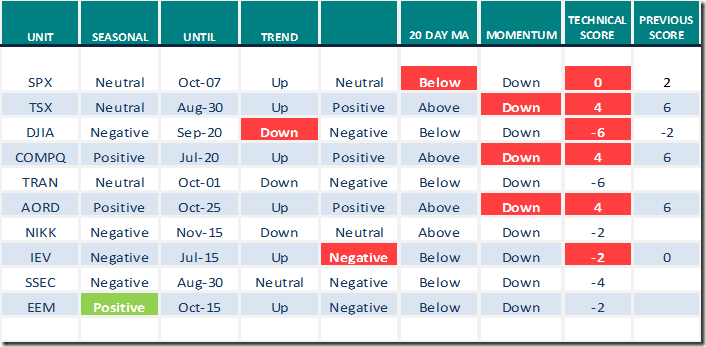
Daily Seasonal/Technical Equity Trends for June 18th 2021
Green: Increase from previous day
Red: Decrease from previous day
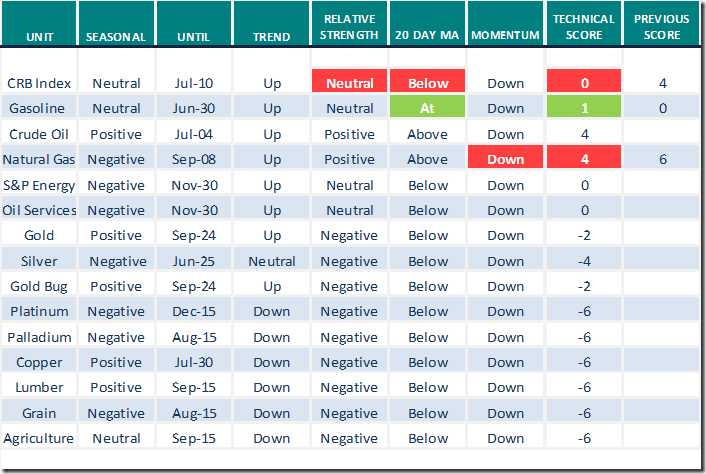
Commodities
Daily Seasonal/Technical Commodities Trends for June 18th 2021
Green: Increase from previous day
Red: Decrease from previous day
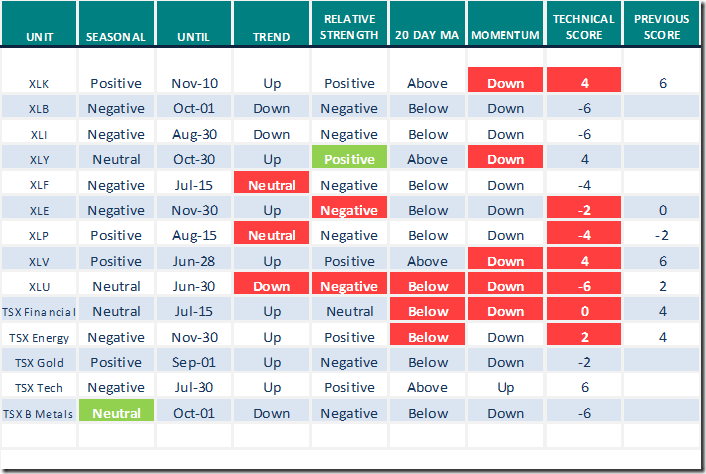
Sectors
Daily Seasonal/Technical Sector Trends for June 18th 2021
Green: Increase from previous day
Red: Decrease from previous day
All seasonality ratings are based on performance relative to the S&P 500 Index
Technical Scores
Calculated as follows:
Intermediate Uptrend based on at least 20 trading days: Score 2
(Higher highs and higher lows)
Intermediate Neutral trend: Score 0
(Not up or down)
Intermediate Downtrend: Score -2
(Lower highs and lower lows)
Outperformance relative to the S&P 500 Index: Score: 2
Neutral Performance relative to the S&P 500 Index: 0
Underperformance relative to the S&P 500 Index: Score –2
Above 20 day moving average: Score 1
At 20 day moving average: Score: 0
Below 20 day moving average: –1
Up trending momentum indicators (Daily Stochastics, RSI and MACD): 1
Mixed momentum indicators: 0
Down trending momentum indicators: –1
Technical scores range from -6 to +6. Technical buy signals based on the above guidelines start when a security advances to at least 0.0, but preferably 2.0 or higher. Technical sell/short signals start when a security descends to 0, but preferably -2.0 or lower.
Long positions require maintaining a technical score of -2.0 or higher. Conversely, a short position requires maintaining a technical score of +2.0 or lower
Changes Last Week
Technical Notes
released on Friday at StockTwits.com@EquityClock
Value being sold off in favor of growth. Find out our thoughts, what this means for the broader market, and the strategy ahead to stay on the right side of the market in today’s report. equityclock.com/2021/06/17/… $XLB $XLF $XLE $XLI $XLK $XLY $XLC $XLV
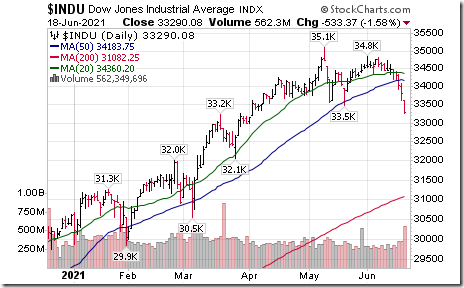
Dow Jones Industrial Average and its related ETF $DIA have completed double top patterns. DIA moved below $334.02 and Dow Jones Industrial Average moved below 33,473.80
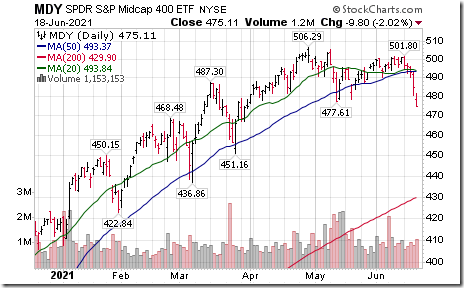
S&P Mid-Cap SPDRs $MDY moved below $477.61 completing a double top pattern.
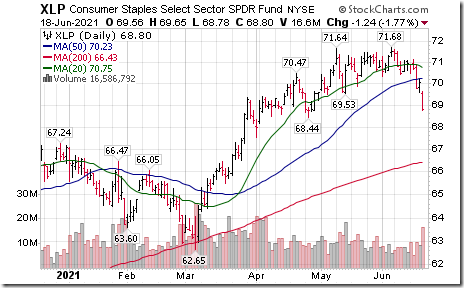
Consumer Staples SPDRs $XLP moved below $69.53 completing a double top pattern
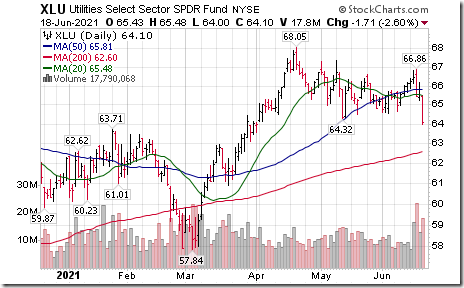
Utilities SPDRs $XLU moved below $63.32 completing a double top pattern.
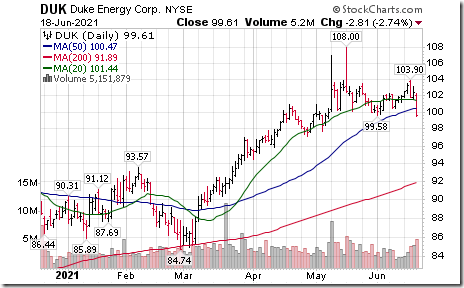
Duke Energy $DUK an S&P 100 stock moved below $99.58 completing a double top pattern
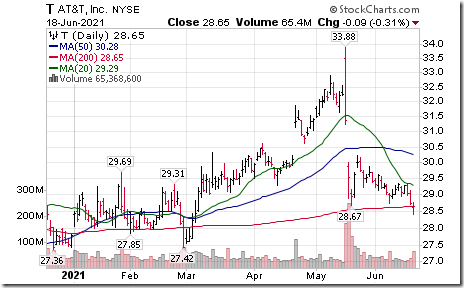
U.S. Telecom stocks and its related ETF $IYZ are under technical pressure. Verizon $VZ moved below support at $56.02. AT&T $T moved below support at $28.67
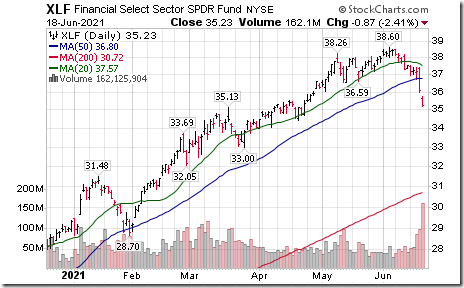
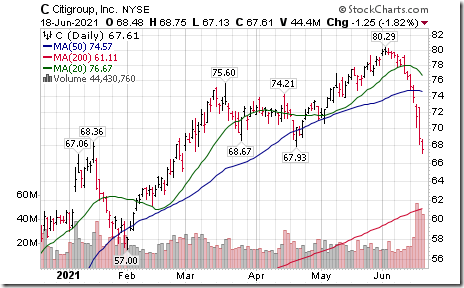
U.S. Bank stocks continue under technical pressure. Citigroup $C moved below intermediate support at $67.93
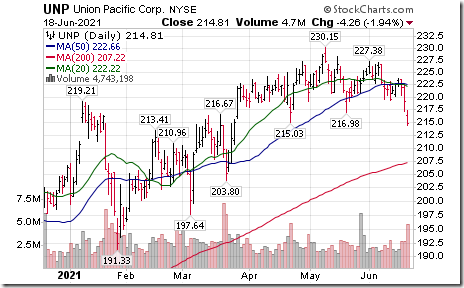
U.S. railway stocks remain under technical pressure. Union Pacific $UNP moved below $216.98 and $215.03 completing a Head & Shoulders pattern
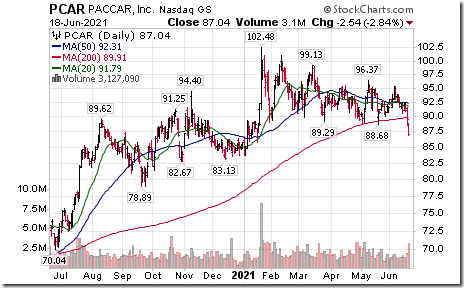
PACCAR $PCAR a NASDAQ 100 stock moved below $88.68 extending an intermediate downtrend.
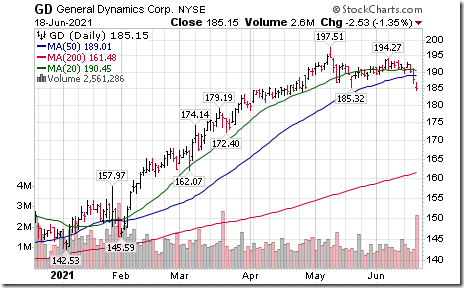
General Dynamics $GD an S&P 100 stock completed a double top pattern by moving below $185.22
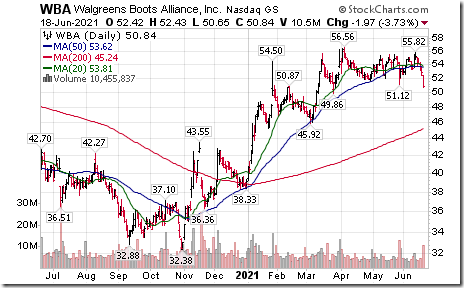
Wallgreens Boots $WBA a Dow Jones Industrial Average stock moved below $51.12 completing a double top pattern.
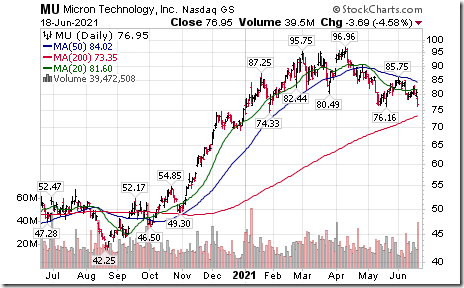
Micron $MU a NASDAQ 100 stock moved below $76.16 extending an intermediate downtrend.
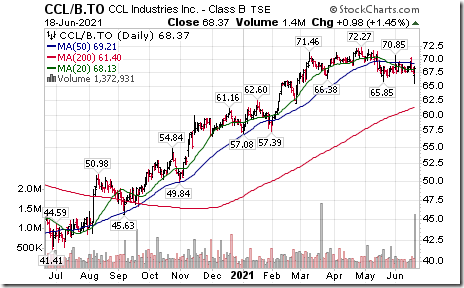
CCL Industries $CCL.B.CA a TSX 60 stock moved below $65.85 completing a Head & Shoulders pattern/
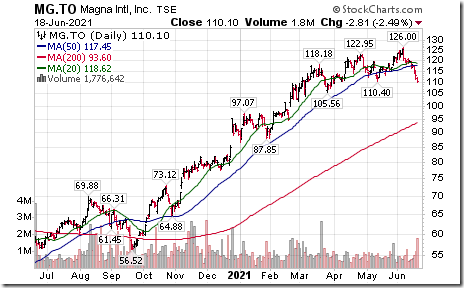
Magna International $MG.CA a TSX 60 stock moved below intermediate support at Cdn$110.40.
Turning Black Gold into Green
Mark Bunting from www.uncommoninvestor.com recently interviewed Josef Schachter, author of the Schachter Energy Report. Josef offered three key investment principles on how to invest in the energy sector. Following is the link:
Don’t Fall in Love with a Stock – Uncommon Sense Investor
Technical Scoop
Thank you to David Chapman and www.EnrichedInvesting for a link to their weekly comment:
S&P 500 Momentum Barometers
The intermediate term Barometer dropped 12.83 on Friday and plunged 34.00 last week to 32.87. It has changed from Overbought (above 60) to Oversold (below 40) and is trending down. No signs of a bottom have appeared yet.
The long term Barometer slipped 2.00 on Friday and 4.39 last week. It remains Extremely Overbought (i.e. above 80.00).
TSX Momentum Barometers
The intermediate term Barometer dropped 6.13 on Friday and 18.75 last week. It changed from Overbought (above 60.00) to Neutral (between 40 and 60) and is trending down.
The long term Barometer dropped 1.83 on Friday and 5.90 last week. It remains Overbought and trending down.
Disclaimer: Seasonality and technical ratings offered in this report and at
www.equityclock.com are for information only. They should not be considered as advice to purchase or to sell mentioned securities. Data offered in this report is believed to be accurate, but is not guaranteed
This post was originally publised at Vialoux's Tech Talk.


