by Don Vialoux, EquityClock.com
Technical Notes for yesterday at
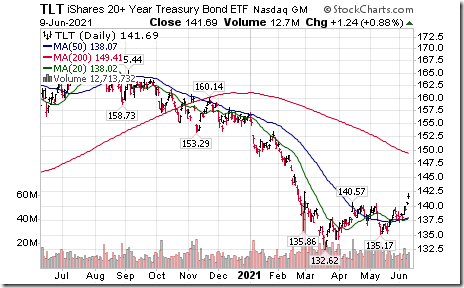
20 year+ Treasury Bond iShares $TLT moved above $140.57 completing a double bottom pattern.
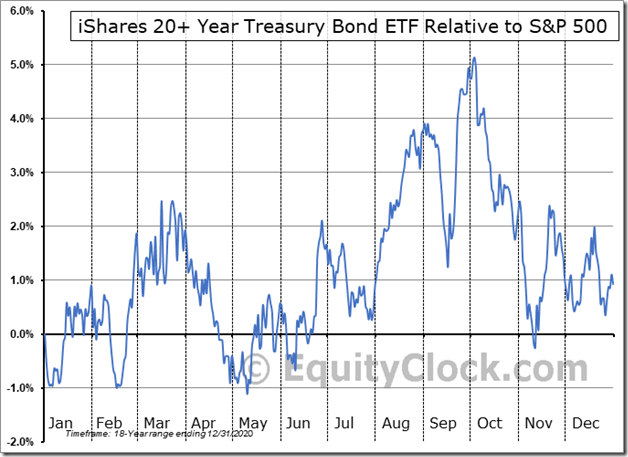
Seasonal influences on a real and relative basis (relative to the S&P 500 Index) for long term U.S. Treasuries including $TLT are positive from June 10th to at least the end of August and potentially to the end of September.
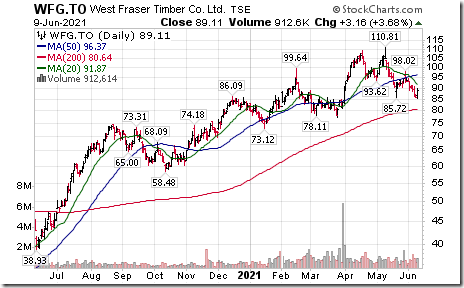
Forest product stocks remain under technical pressure. West Fraser Timber $WFG moved below $85.72 extending an intermediate downtrend.
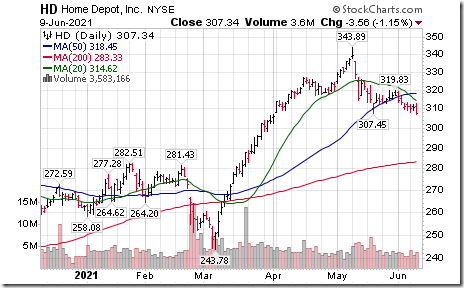
Home Depot $HD a Dow Jones Industrial Average stock moved below $307.45 completing a Head & Shoulders pattern. Similar technical pattern to lumber and lumber stocks!
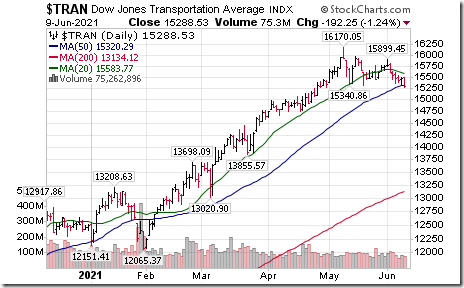
Dow Jones Transportation Average $TRAN moved below 15,317.11 completing a double top pattern.
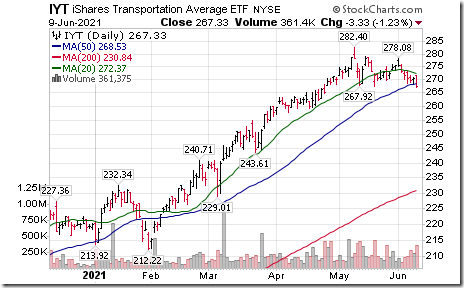
Dow Jones Transportation Average iShares $IYT moved below $267.44 completing a double top pattern.
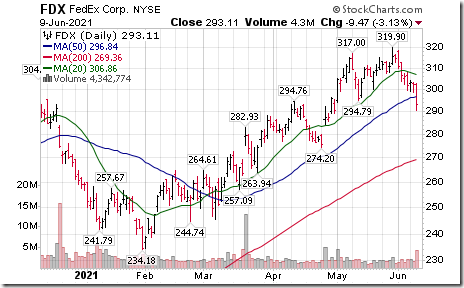
Weakness in the U.S. Transportation stocks is led by weakness in FedEx $FDX below support at $294.79.
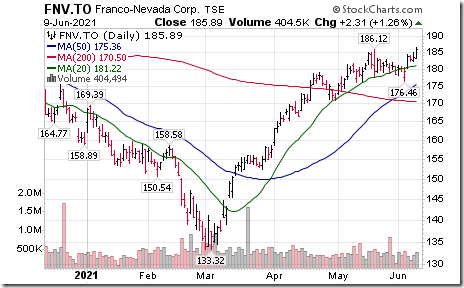
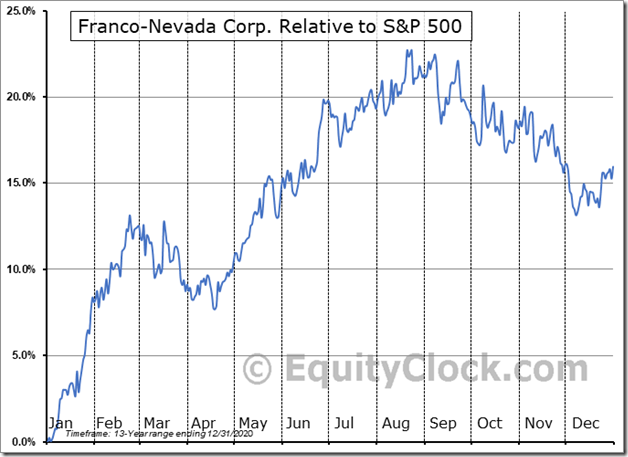
Franco-Nevada $FNV.CA a TSX 60 stock moved above $185.11 extending an intermediate uptrend.
Seasonal influences for Franco-Nevada $FNV are positive on a real and relative basis (relative to the S&P 500 Index) between now and the third week in August.
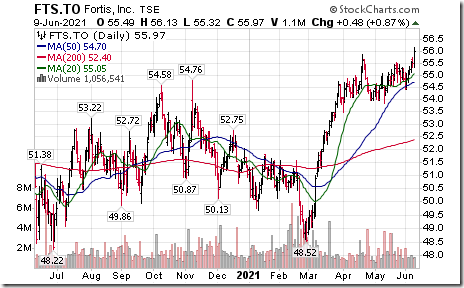
Fortis $FTS.CA a TSX 60 stock moved above $55.84 extending an intermediate uptrend
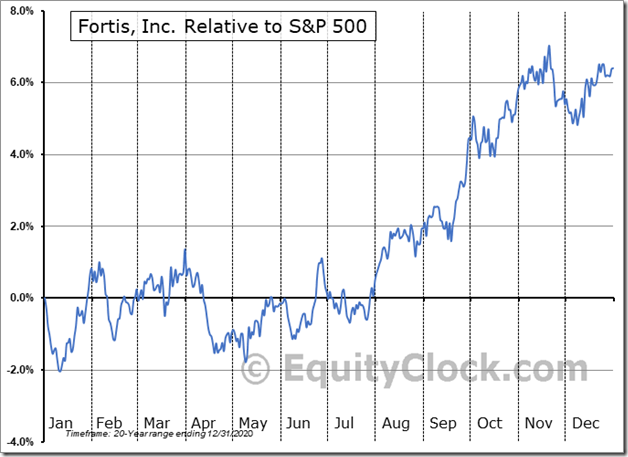
Seasonal influences on Fortis $FTS.CA are positive on a real and relative basis (relative to the S&P 500 Index) from June 10th to November 20th
Trader’s Corner
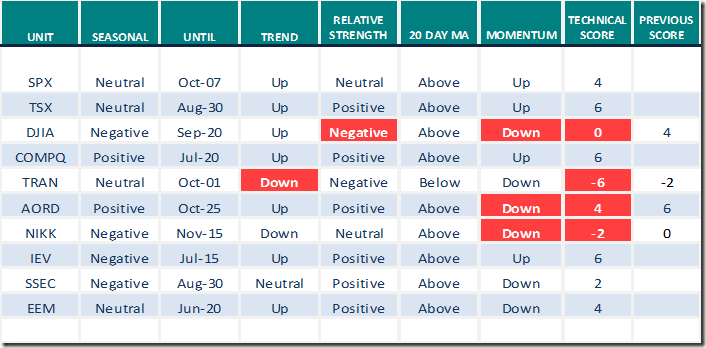
Equity Indices and Related ETFs
Daily Seasonal/Technical Equity Trends for June 9th 2021
Green: Increase from previous day
Red: Decrease from previous day
Commodities
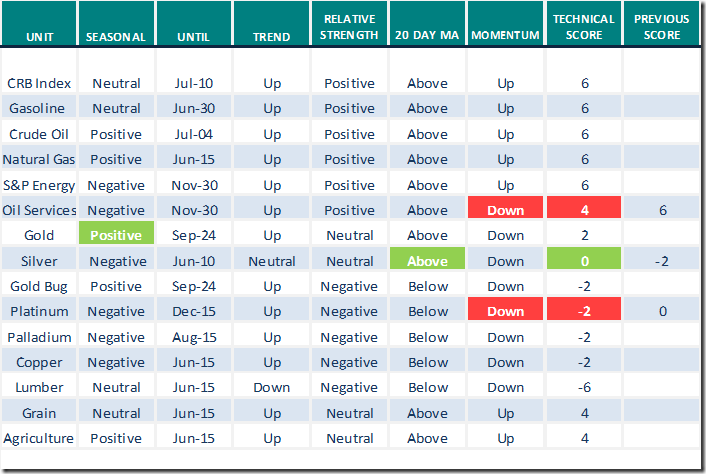
Daily Seasonal/Technical Commodities Trends for June 9th 2021
Green: Increase from previous day
Red: Decrease from previous day
Sectors
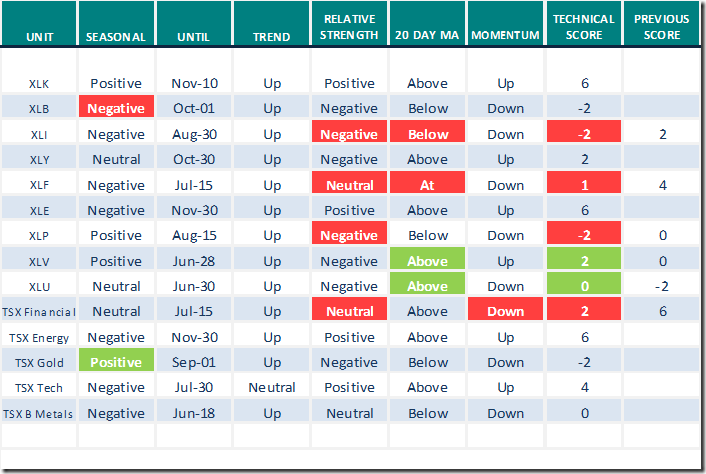
Daily Seasonal/Technical Sector Trends for June 9th 2021
Green: Increase from previous day
Red: Decrease from previous day
All seasonality ratings are based on performance relative to the S&P 500 Index
Changes in Seasonality Ratings
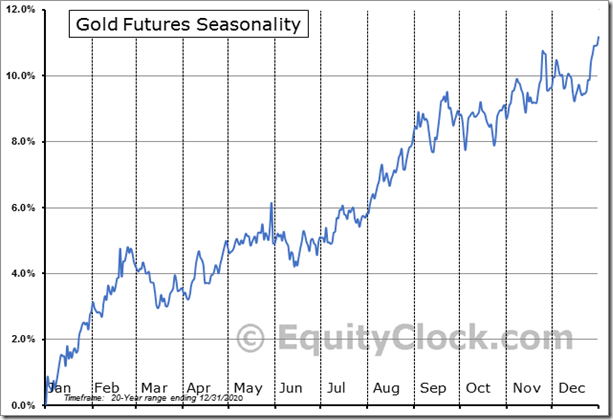
Gold Futures (GC) Seasonal Chart
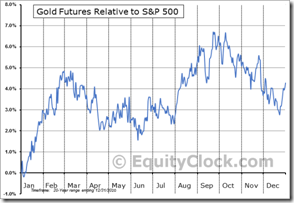
Seasonal influences are positive on a real and relative basis (relative to the S&P 500 Index) between now and the third week in September.
Gold Futures (GC) Seasonal Chart
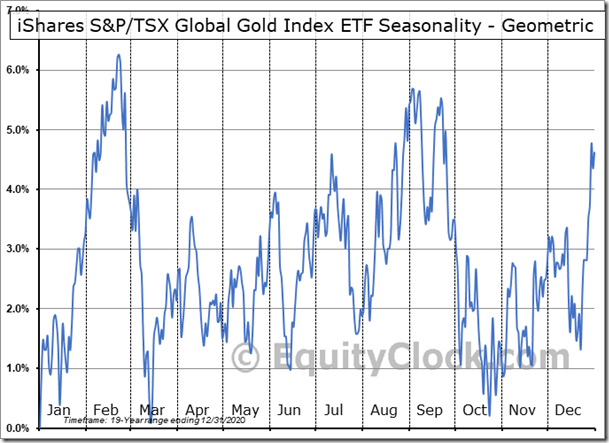
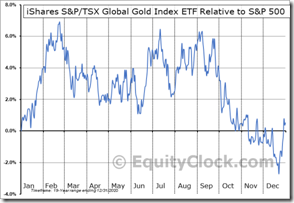
Seasonal influences for TSX Gold ETF (XGD) turns positive on a real basis on June 15th and turns positive on a relative basis on June 10th for a seasonal trade lasting to September 1st.
iShares S&P/TSX Global Gold Index ETF (TSE:XGD.TO) Seasonal Chart
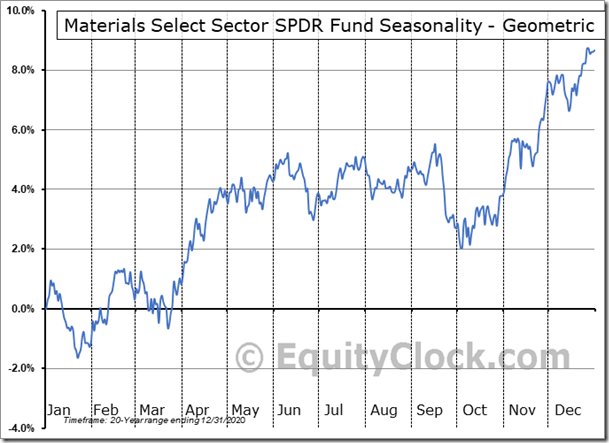
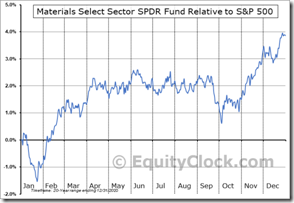
Seasonal influences for Materials SPDRs (XLB) remain Neutral on a real basis to mid-September and turns negative on a relative basis (relative to the S&P 500 Index) to October 1st.
Materials Select Sector SPDR Fund (NYSE:XLB) Seasonal Chart
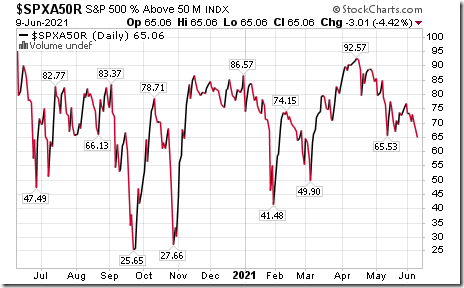
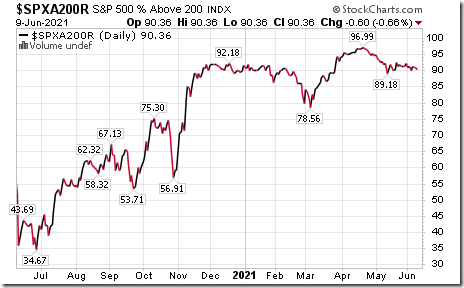
S&P 500 Momentum Barometers
The intermediate term Barometer dropped 3.01 to 65.06 yesterday. It remains Overbought and has resumed a short term downtrend.
The long term Barometer slipped 0.60 to 90.36 yesterday. It remains Extremely Overbought.
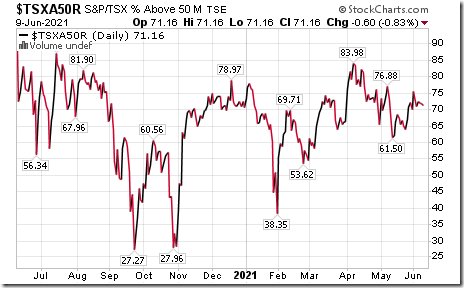
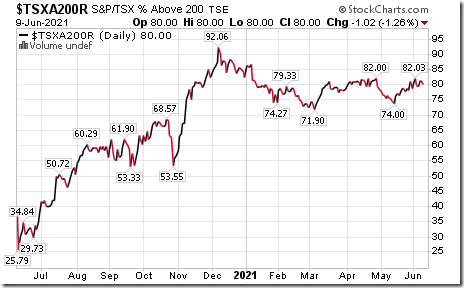
TSX Momentum Barometers
The intermediate term Barometer slipped 0.60 to 71.15 yesterday. It remains Overbought.
The long term Barometer eased 1.02 to 80.00 yesterday. It remains Extremely Overbought.
Disclaimer: Seasonality and technical ratings offered in this report and at
www.equityclock.com are for information only. They should not be considered as advice to purchase or to sell mentioned securities. Data offered in this report is believed to be accurate, but is not guaranteed
This post was originally publised at Vialoux's Tech Talk.


