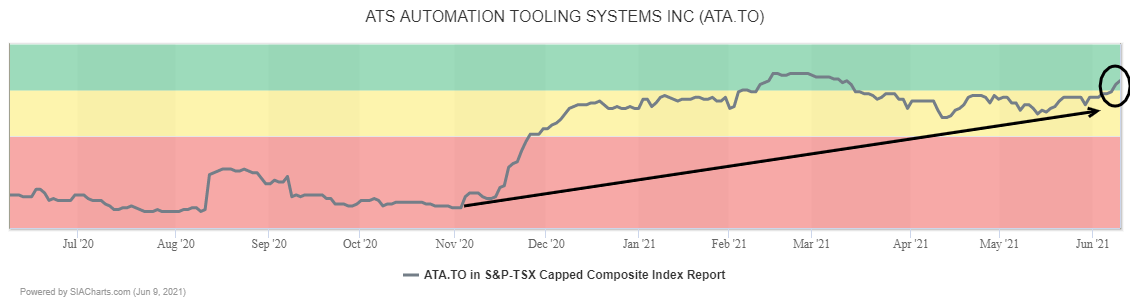
ATS Automation Tooling Systems (ATA.TO) has been trending upward within the SIA S&P/TSX Composite Index Report for the last year and recently returned to the Green Favored Zone from a dip into the yellow zone. Yesterday the shares finished in 30th place, up 4 spots on the day and up 30 spots in the last month.
ATS appears to be benefitting from increased interest in manufacturing technology this week after the US Senate passed a $250B spending package to support US semiconductor manufacturing and improve manufacturing technology for other sectors as well.
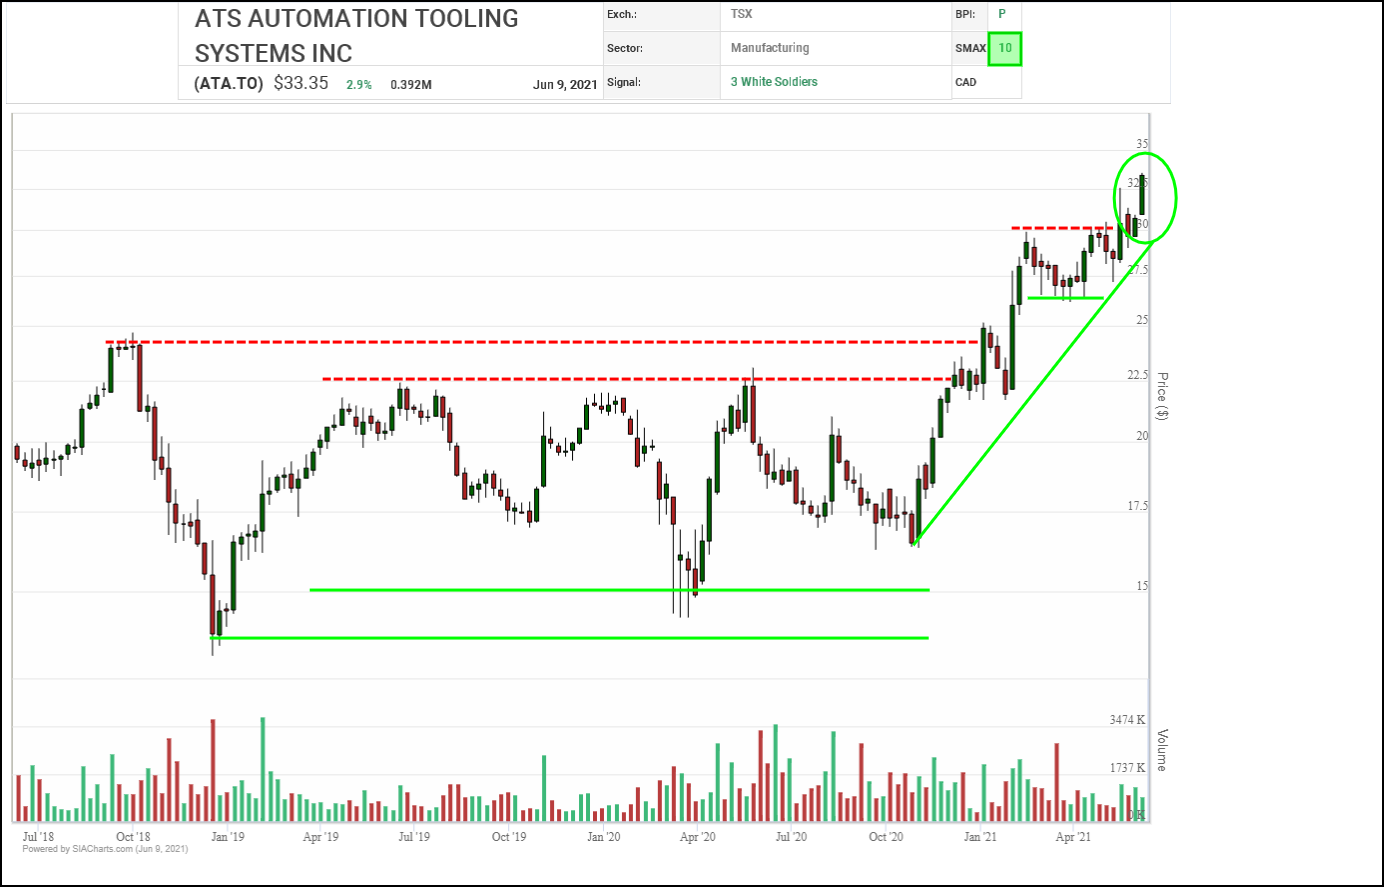
Since we last mentioned ATS in the February 17th issue of the Daily Stock Report, the shares are up 14.3%. The S&P/TSX Composite Index is up 8.1% over the same time frame. ATS Automation Tooling Systems (ATA.TO) has come under renewed accumulation since last October, with a steady uptrend of higher lows bringing an end to over two years of sideways rangebound trading. The shares have continued to advance to new highs building on a recent breakout over $30.00.
Based on measured moves from recent and previous trading ranges, upside resistance may appear in the $37.50 to $38.00 area, then near $42.00 and the $44.00 to $45.00 area. Initial support appears in the $30.00 to $31.00 zone where a round number and a recent breakout point converge.
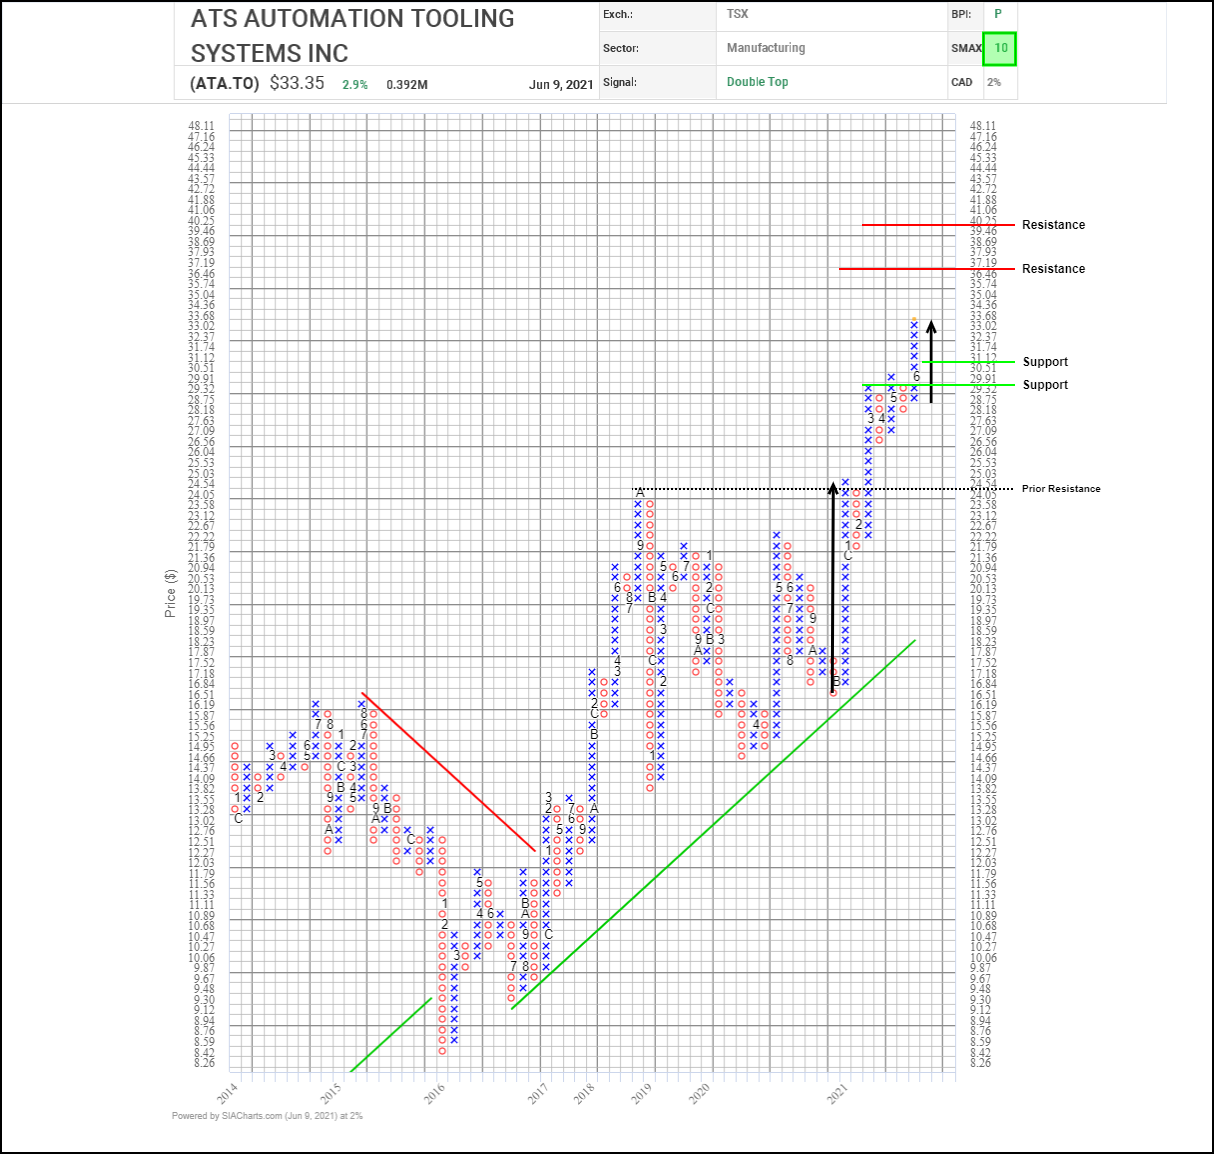
Back in January, ATS Automation Tooling Systems (ATA.TO) broke out to a two year high, ending a long consolidation phase and signaling that the shares primary uptrend has resumed. Since then, the shares have remained under accumulation, staging a series of high poles and bullish Double Top pattern breakouts, with consistently higher lows confirming increasing underlying support.
Based on a combination of vertical and horizontal counts, next potential upside resistance appears near $37.20 then $40.25 on trend, with initial support in place near $30.50 based on a common 3-box reversal.
With a perfect SMAX score of 10, ATA.TO is exhibiting strength across the asset classes.
Disclaimer: SIACharts Inc. specifically represents that it does not give investment advice or advocate the purchase or sale of any security or investment whatsoever. This information has been prepared without regard to any particular investors investment objectives, financial situation, and needs. None of the information contained in this document constitutes an offer to sell or the solicitation of an offer to buy any security or other investment or an offer to provide investment services of any kind. As such, advisors and their clients should not act on any recommendation (express or implied) or information in this report without obtaining specific advice in relation to their accounts and should not rely on information herein as the primary basis for their investment decisions. Information contained herein is based on data obtained from recognized statistical services, issuer reports or communications, or other sources, believed to be reliable. SIACharts Inc. nor its third party content providers make any representations or warranties or take any responsibility as to the accuracy or completeness of any recommendation or information contained herein and shall not be liable for any errors, inaccuracies or delays in content, or for any actions taken in reliance thereon. Any statements nonfactual in nature constitute only current opinions, which are subject to change without notice.