by Don Vialoux, EquityClock.com
The Bottom Line
Most U.S. equity indices and world equity indices moved higher last week with several closing at all-time highs. Greatest influences on North American equity markets remain possibility of a fourth wave by COVID 19 (negative) and continued expansion of distribution of a vaccine (positive).
Observations
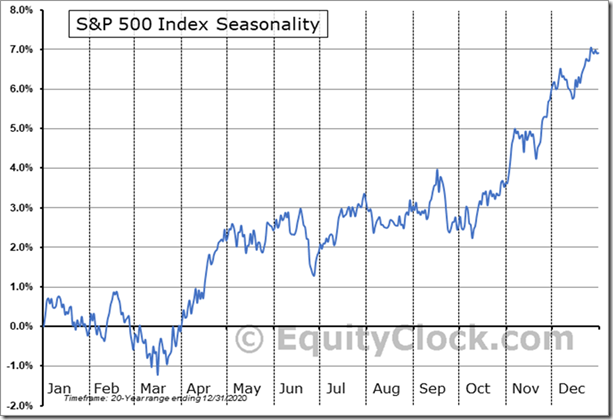
The S&P 500 Index is following its historic seasonal pattern for this time of year, a mixed, choppy period between early May and the second week in October. Average return during this period is close to zero. Positive returns are possible by selecting sector investments that outperform during the period.
Short term short term indicators for U.S. equity indices, commodities and sectors (20 day moving averages, short term momentum indicators) moved higher again last week.
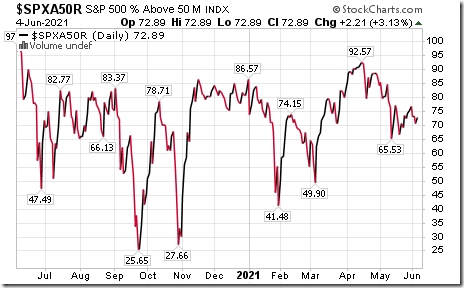
Intermediate term technical indicator for U.S. equity markets (e.g. Percent of S&P 500 stocks trading above their 50 day moving average) moved lower last week. It remained Overbought. See Barometer charts at the end of this report.
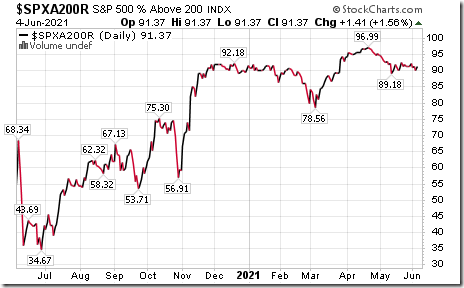
Long term technical indicator for U.S. equity markets (e.g. Percent of S&P 500 stocks trading above their 200 day moving average) moved slightly lower last week. It remained Extremely Overbought. See Barometer chart at the end of this report.
Short term momentum indicators for Canadian indices and sectors were virtually unchanged last week.
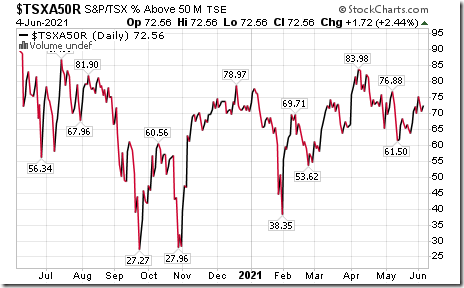
Intermediate term technical indicator for Canadian equity markets moved slightly higher last week. It remains Overbought. See Barometer chart at the end of this report.
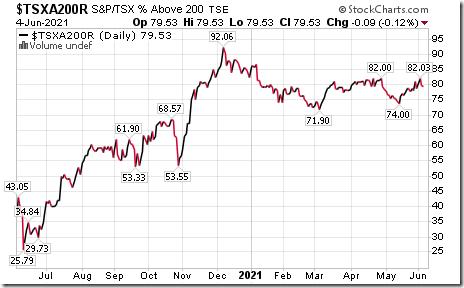
Long term technical indicator for Canadian equity markets (i.e. Percent of TSX stocks trading above their 200 day moving average) moved slightly lower last week. It changed last week from Extremely Overbought to Overbought on a move below 80.00. See Barometer charts at the end of this report.
Consensus estimates for earnings by S&P 500 companies continued to increase from our last report two weeks ago. Earnings in the second quarter are expected to increase 61.0% (versus previous estimate at 59.9%) and revenues are expected to increase 19.3% (versus previous estimate at 18.9%). Earnings in the third quarter are expected to increase 22.7% (versus previous estimate at 22.2%) and revenues are expected to increase 11.9% (versus previous estimate at 11.6%). Earnings in the fourth quarter are expected to increase 17.2% (versus previous estimate at 16.9%) and revenues are expected to increase 8.8% (versus previous estimate at 8.6%). Earnings for all of 2021 are expected to increase 34.4% (versus previous estimate at 33.7%) and revenues are expected to increase 12.0% (versus previous estimate at 11.8%)
Economic News This Week
May Canadian Trade Balance to be released on Tuesday at 8:30 AM EDT is expected to recover to $700 million surplus versus a $1.14 deficit in April.
Bank of Canada’ Interest Rate Decision is released at 10:00 AM EDT on Wednesday. Overnight lending rate to Canada’s banks is expected to remain unchanged at 0.25%.
May U.S. Consumer Price Index to be released at 8:30 AM EDT on Thursday is expected to increase 0.4% versus a gain of 0.8% in April. Excluding food and energy, May Consumer Price Index is expected to increase 0.4% versus a gain of 0.9% in April.
June Michigan Consumer Sentiment Index to be released at 10:00 AM EDT on Friday is expected to increase to 84.0 from 82.9 in May.
Earnings News This Week
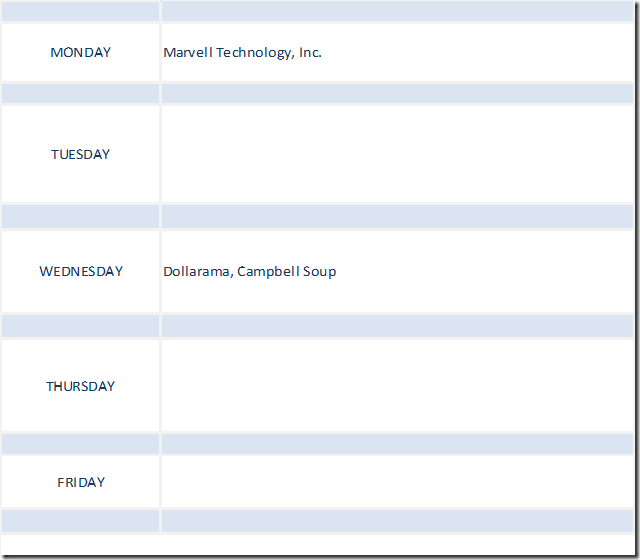
Quiet week for reports by major U.S. and Canadian companies!
Trader’s Corner
Equity Indices and Related ETFs
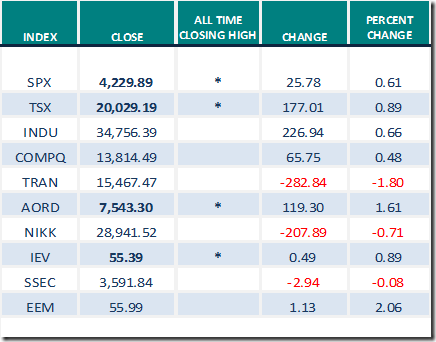
Daily Seasonal/Technical Equity Trends for June 4th 2021
Green: Increase from previous day
Red: Decrease from previous day
Commodities
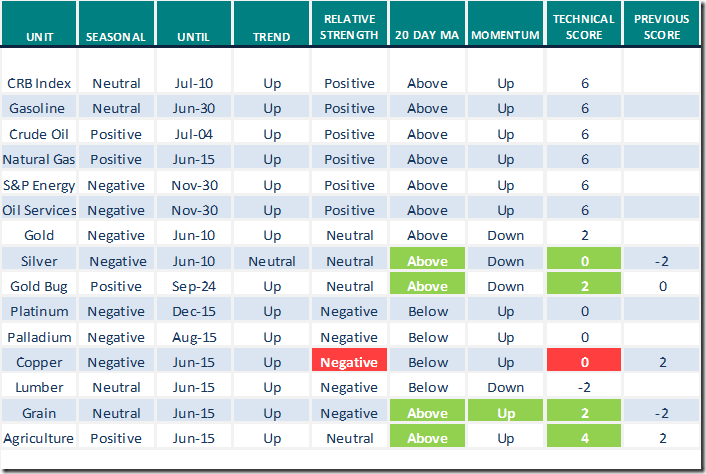
Daily Seasonal/Technical Commodities Trends for June 4th 2021
Green: Increase from previous day
Red: Decrease from previous day
Sectors
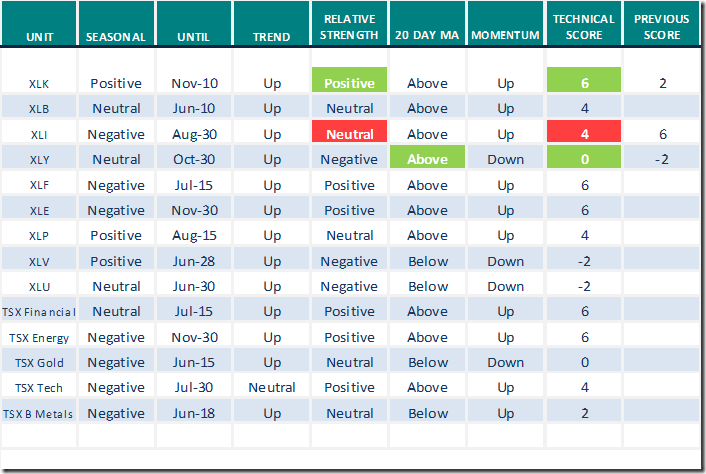
Daily Seasonal/Technical Sector Trends for June 4th 2021
Green: Increase from previous day
Red: Decrease from previous day
All seasonality ratings are based on performance relative to the S&P 500 Index
Technical Scoop
Thank you to David Chapman and www.EnrichedInvesting.com for a link to their weekly report. Headline reads, “Top signs, low vol, opposed headlines, disappointing jobs, short labor, metals crossroad, high oil, steady fed”.
Following is the link:
Technical Scores
Calculated as follows:
Intermediate Uptrend based on at least 20 trading days: Score 2
(Higher highs and higher lows)
Intermediate Neutral trend: Score 0
(Not up or down)
Intermediate Downtrend: Score -2
(Lower highs and lower lows)
Outperformance relative to the S&P 500 Index: Score: 2
Neutral Performance relative to the S&P 500 Index: 0
Underperformance relative to the S&P 500 Index: Score –2
Above 20 day moving average: Score 1
At 20 day moving average: Score: 0
Below 20 day moving average: –1
Up trending momentum indicators (Daily Stochastics, RSI and MACD): 1
Mixed momentum indicators: 0
Down trending momentum indicators: –1
Technical scores range from -6 to +6. Technical buy signals based on the above guidelines start when a security advances to at least 0.0, but preferably 2.0 or higher. Technical sell/short signals start when a security descends to 0, but preferably -2.0 or lower.
Long positions require maintaining a technical score of -2.0 or higher. Conversely, a short position requires maintaining a technical score of +2.0 or lower
Changes Last Week
Technical Notes for Friday at
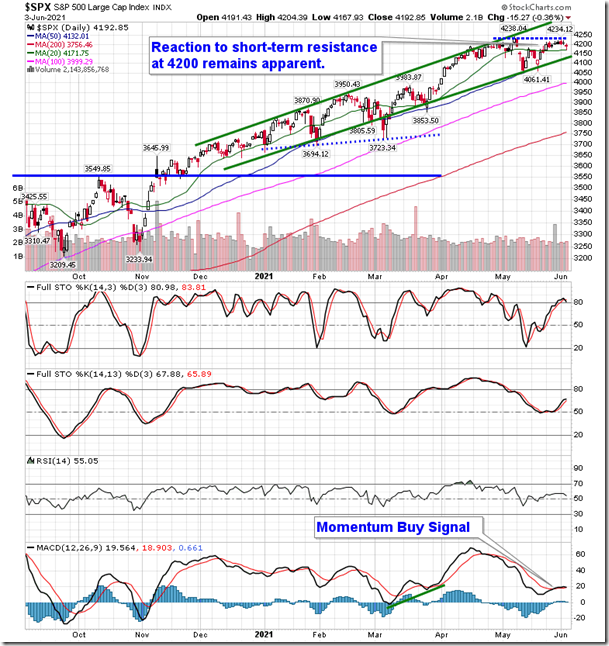
Reaction to short-term resistance at 4200 is becoming clear, pointing to near-term buying exhaustion. equityclock.com/2021/06/03/… $SPX $SPY $ES_F
Editor’s Note: A move by the Dow Jones Transportation Average below support at 15,317.11 will heighten bearish concerns. The Average closed at 15,467.47 on Friday.
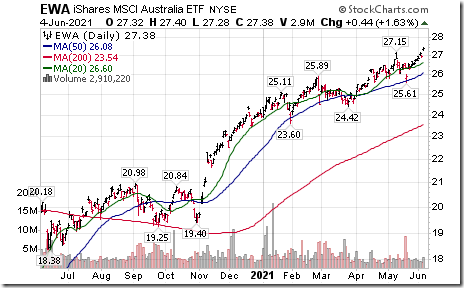
Australia iShares $EWA moved above $27.15 to an all-time high extending an intermediate uptrend.
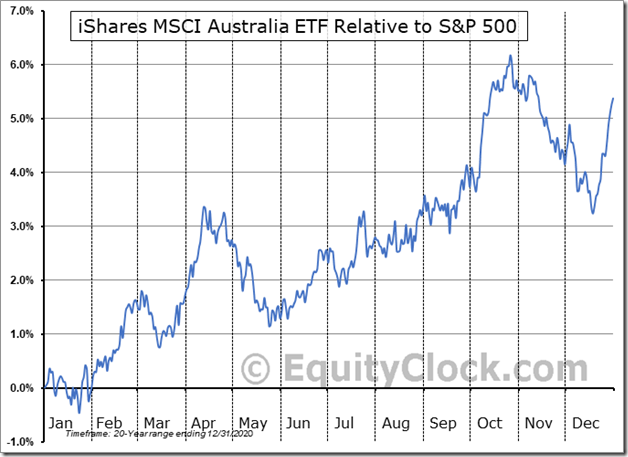
Seasonal influences for Australia iShares $EWA are positive on a real and relative basis (relative to the S&P 500 Index) from the end of May to end of October. See:
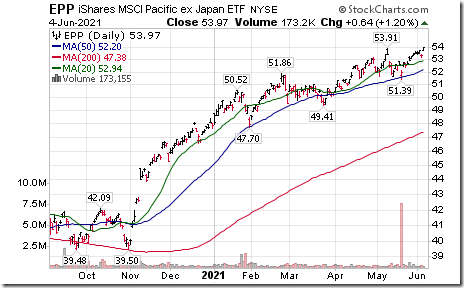
Pacific ex Japan iShares $EPP moved above $53.91 to an all-time high extending an intermediate uptrend.
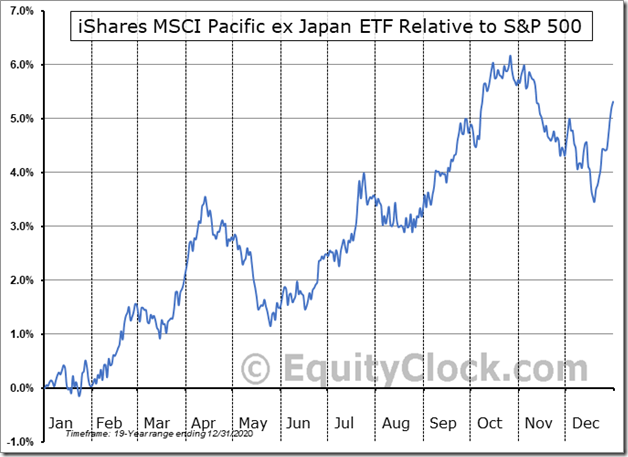
Seasonal influences for Pacific (ex Japan) iShares $EPP are positive on a real and relative basis (relative to the S&P 500 Index) from the end of May to the end of October. See:
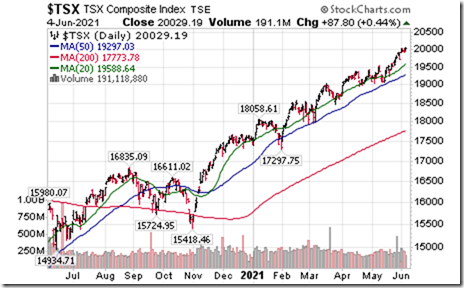
TSX Composite Index $TSX.CA closed above 20,000 for the first time in history.
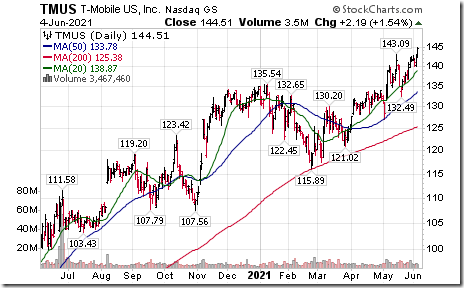
T Mobile $TMUS a NASDAQ 100 stock moved above $143.09 to an all-time high extending an intermediate uptrend.
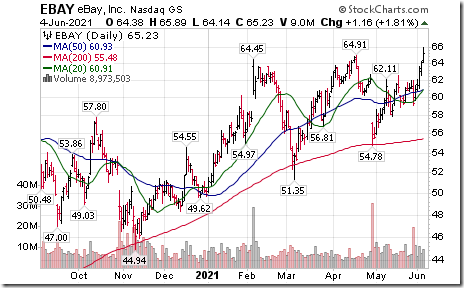
eBay $EBAY a NASDAQ 100 stock moved above $64.91 to an all-time high extending an intermediate uptrend
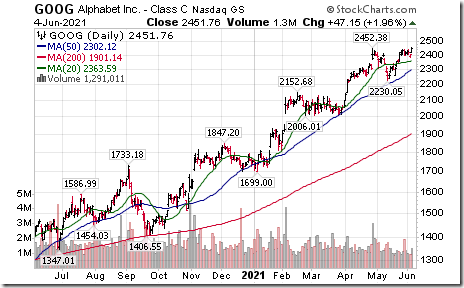
Alphabet Class C shares $GOOG a NASDAQ 100 stock moved above $2,452.38 to an all-time high extending an intermediate uptrend.
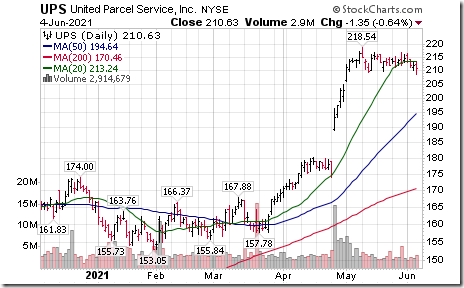
UPS $UPS an S&P 100 stock moved below $209.36 completing a double top pattern
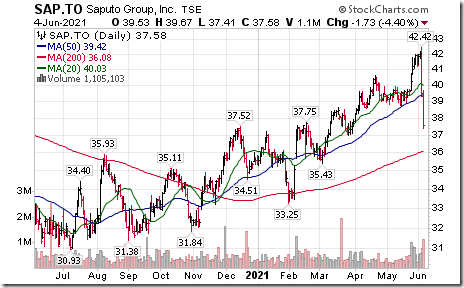
Saputo $SAP.CA a TSX 60 stock moved below $38.77 after reporting lower than consensus quarterly results.
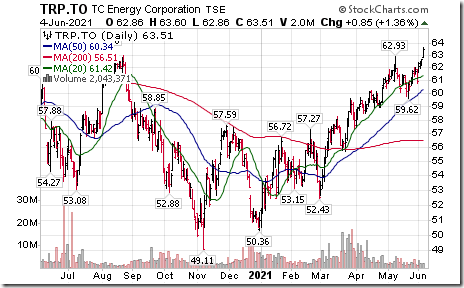
TC Energy $TRP.CA a TSX 60 stock moved above $62.93 extending an intermediate uptrend.
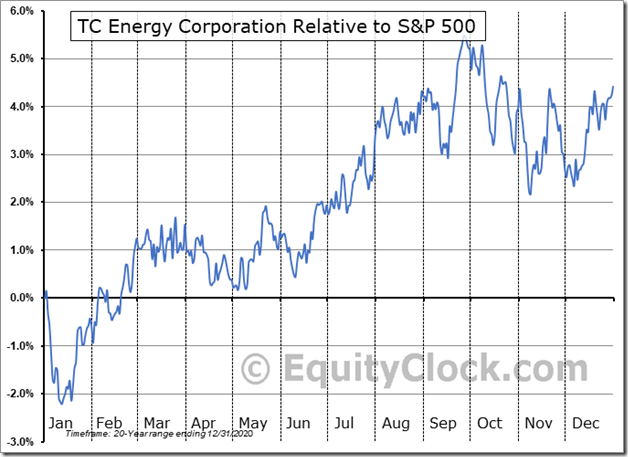
Seasonal influences for TC Energy $TRP.CA are positive on a real and relative basis (relative to the S&P 500 Index) from the second week in June to near the end of September. See:
S&P 500 Momentum Barometers
The intermediate Barometer added 2.21 to 72.89 on Friday but dropped 4.06 last week. It remains Overbought.
The long term Barometer added 1.41 to 91.37 on Friday but slipped 0.81 last week. It remains Extremely Overbought.
TSX Momentum Barometers
The intermediate Barometer added 1.72 on Friday and 0.33 last week. It remains Overbought.
The long term Barometer slipped 0.09 on Friday and 1.49 last week. It changed from Extremely Overbought to Overbought on a move below 80.00.
Disclaimer: Seasonality and technical ratings offered in this report and at
www.equityclock.com are for information only. They should not be considered as advice to purchase or to sell mentioned securities. Data offered in this report is believed to be accurate, but is not guaranteed
This post was originally publised at Vialoux's Tech Talk.


![clip_image002[1] clip_image002[1]](https://advisoranalyst.com/wp-content/uploads/2021/06/clip_image0021_thumb-1.png)
