by Frank Holmes, CEO and Chief Investment Officer, U.S. Global Investors
Inflation is top of mind right now for many consumers, businesses and investors. Responding to a recent Bank of America survey, asset managers around the world agreed that inflation is the number one market risk, displacing COVID-19 for the first time since February 2020.
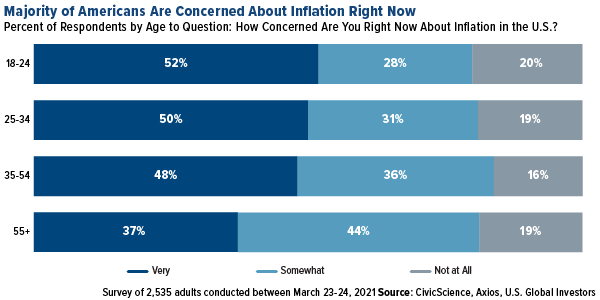
Another survey conducted this month found that over three quarters of Americans were either “very” or “somewhat” concerned about inflation. Perhaps not surprisingly, younger Americans who have not yet reached their peak earning years were most worried.
Loyal readers know I’ve been writing about this topic a lot lately. There are many signs that inflation is already here: Commodity prices are up. Home prices are up. Energy prices are up. Shipping rates are way up. Used cars and trucks are through the roof.
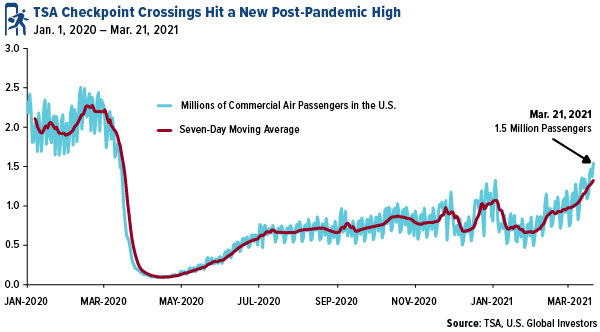
And the trend is only going to accelerate as social distancing is relaxed and the economy steadily returns to “normal.” This week, the Department of Labor reported that initial jobless claims fell to their lowest level in a year. Last Sunday, 1.5 million people boarded commercial flights, the most since lockdowns began.
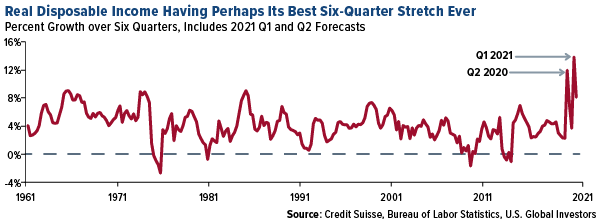
Thanks to “stimmy” checks and unprecedented money printing, real disposable income is set to have its biggest increase ever in any given six-quarter period, says Credit Suisse. The firm expects U.S. consumption to surge an “extreme” 10% this year, triggering a significant jump in new orders and new hiring—all of which is highly inflationary. This month, in fact, U.S. manufacturers reported the sharpest rise in new orders since 2014, according to IHS Markit.
The Pandemic May Have Made the CPI Obsolete
My question, as always, is whether we’re measuring inflation accurately. What if we’re doing it all wrong? As investors, we want to make decisions based on the best available data, so what should we do if the data is incomplete or flawed?
Here in the U.S., inflation is measured by the consumer price index (CPI), which is updated monthly by the Bureau of Labor Statistics (BLS). The standard way BLS researchers do this is to literally visit stores and ask them for prices.
This approach might seem intuitive, but a recent Bloomberg article lists two fundamental problems.
Number one, the CPI is based on a basket of goods and services that Americans may have spent money on in the past but whose sales suffered during the pandemic. Think entertainment and recreation, restaurants and hotels, new clothes and more.
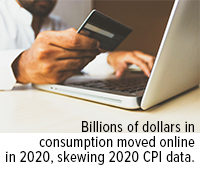
And two, with thousands of stores and businesses closed over the past year, researchers haven’t been able to make in-person visits, leaving gaping holes in the data. A whole lot of shopping moved online in 2020—as much as $105 billion, according to one estimate—where month-to-month price volatility can be far greater and more rapid.
 As International Monetary Fund (IMF) economist Marshall Reinsdorf recently put it: “Spending patterns changed abruptly, and the CPI weight suddenly became obsolete” (emphasis my own).
As a result, there may be a huge amount of inflation that simply isn’t being detected.
The BLS is allegedly considering adjustments to its methodology to account for changing spending habits and preferences—which is one way of admitting that the data it produces is skewed.
But in the meantime, what do we as investors do? One source I’ve turned to again and again is Shadow Government Statistics, or ShadowStats, which provides alternate inflation data based on the pre-1980 and pre-1990 methodologies. Using these methodologies, consumer prices are increasing by 9% or faster, not 1.7%.
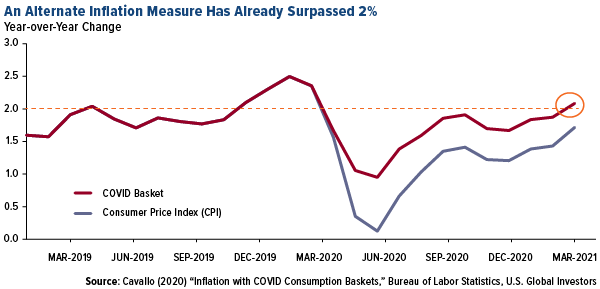
A Harvard economist, Alberto Cavallo, interestingly built his own index of goods and services that Americans actually bought during the pandemic, based on credit card transaction data. What this index shows is that inflation has been running slightly hotter than the CPI. In February, it actually surpassed the Federal Reserve’s target inflation rate of 2%.
Time to Get Exposure to Real Assets?
With prices climbing faster than what’s being reported, investors would be wise, I think, to get exposure to assets that are seeing some of the highest inflation right now and that are in a position to rise even more as the economy expands. That means real assets—metals and minerals, lumber, cement, energy and other commodities and raw materials. As I wrote in February, we may be on the verge of a new commodities supercycle, and it’s not too late to start participating.
That’s especially the case now that President Joe Biden has signaled his next legislative project will be infrastructure. Next week we’re supposed to get further details on his proposed $3 trillion spending package, but from what I’ve seen, $1 trillion of that will be devoted to improving roads, bridges, rail lines, ports, electric grids and more.
There’s much work to be done, after all. The American Society of Civil Engineers (ASCE) recently gave U.S. infrastructure a C- and estimated the investment gap to be as high as $2.6 trillion.
Treasury Secretary Janet Yellen told the House this week that taxes will likely need to be raised to pay for such a large-scale operation. All the more reason to rotate into commodities and the companies that produce them.
Gold Miners Recorded Record High Margins Last Year
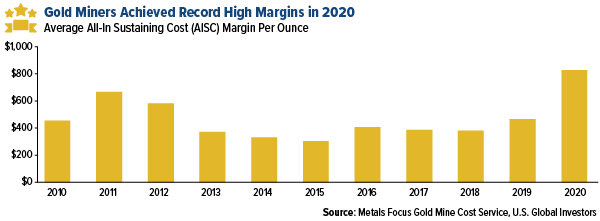
That includes gold and gold miners. Last year, producers had their most profitable year ever, with average all-in sustaining cost (AISC) margins hitting a record $828 per ounce, according to Metals Focus. The AISC margin is defined as the gold price minus the cost to produce it. In other words, for every ounce of gold a mining company produced in 2020, it got to pocket $828 on average. This is comfortably higher than the previous record of $666 set in 2011.
The price of gold hit a record high of $2,075, which helped increase revenues. But companies have also been focused on cost discipline. We haven’t yet seen exploration budgets go on significantly.
The producer with the world’s lowest cost per ounce in 2020 was Polyus, according to Kitco News. The Russian miner’s AISC was only $604/oz. Among other companies in the top 10 were B2Gold ($788/oz), Centerra Gold ($799/oz), Kirkland Lake ($800/oz) and Polymetal ($874/oz).
Precious metal royalty and streaming companies also had a strong 2020. The world’s largest by market cap, Franco-Nevada, reported phenomenal results: record revenue of $1 billion, record net income of $326 million and record cash flow of $840 million. In addition, the company declared a quarterly dividend of $0.30 per share, a 15% increase from the prior dividend of $0.26.
Wheaton Precious Metals also reported strong 2020 results, with net income up triple digits compared to 2019. Annual revenue of $1 billion and annual operating cash flow of $765 million were both records for the company.
Copyright © U.S. Global Investors


