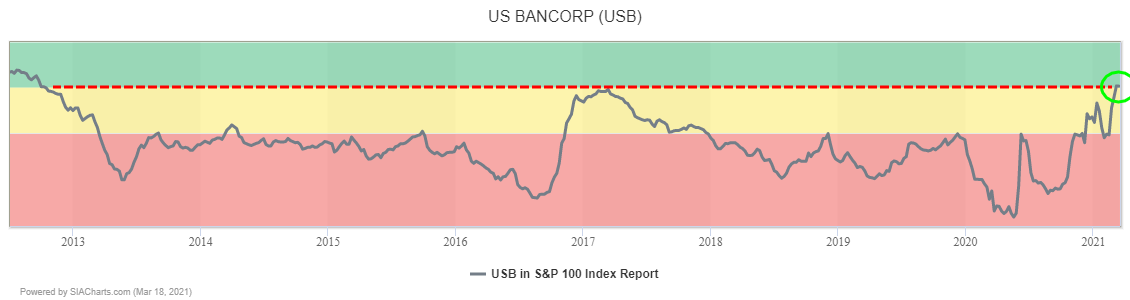
US Bancorp (USB) has returned to the Green Favored Zone of the SIA S&P 100 Index Report for the first time since 2012. The shares recently overtook their 2017 peak and finished yesterday in 25th place, up 1 spot on the day and up 28 spots over the last month.
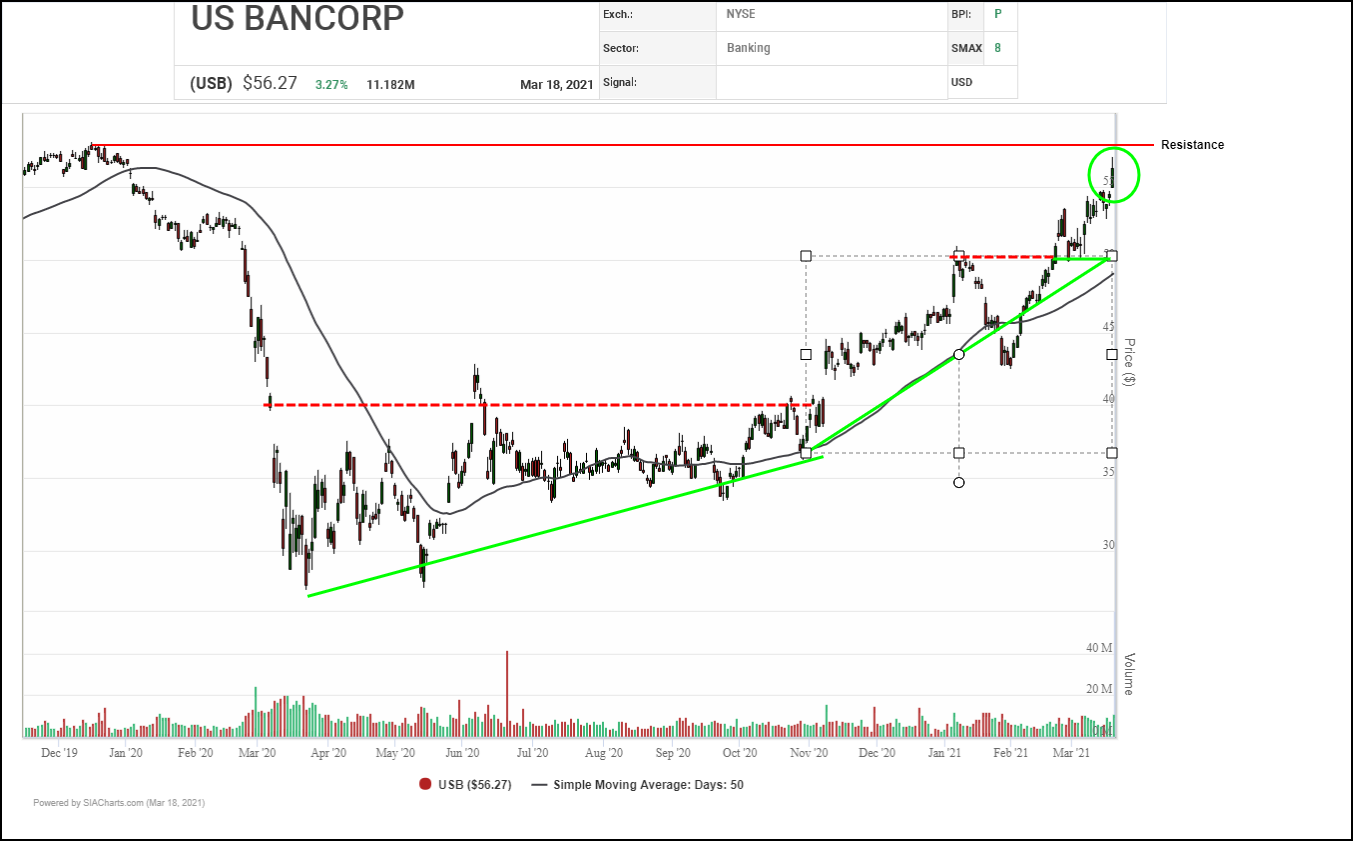
Since completing a bullish Ascending Triangle breakout back in November, US Bancorp (USB) shares have been under increased accumulation, as shown by the steepening of their uptrend support line. Last month, the shares broke out over $50.00 and yesterday, they cleared $55.00 to confirm that their current uptrend continues.
Initial upside resistance appears in the $58.00 to $60.00 area where their early 2020 peak, a measured move and a round number cluster, followed by the $67.00 to $70.00 area based on another cluster of measured moves. Initial support appears near $50.00 where a round number, a recent breakout point and trend support cluster.
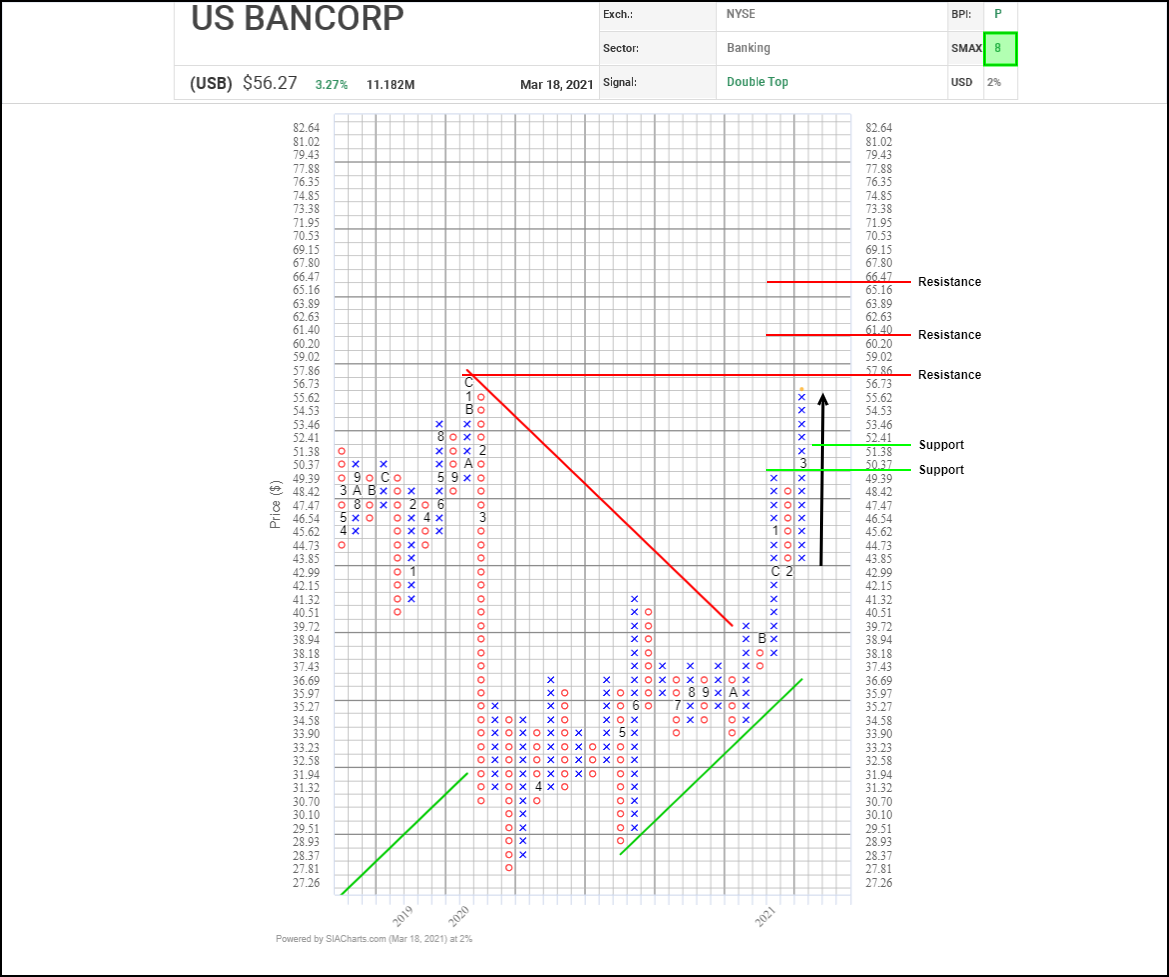
Earlier this month, US Bancorp (USB) shares completed a bullish Double Top breakout over $50.00 which signaled the start of a new upleg within an uptrend that has been underway since the shares snapped a downtrend line back in October and completed a bullish Spread Double Top breakout in November.
The shares are currently approaching their previous peak near $57.85 dating back to late 2019. A breakout there would confirm that the current uptrend continues with next resistance possible near $61.40 and then $66.50 based on vertical and horizontal counts. Initial support appears near $51.40 based on a 3-box reversal.
With a bullish SMAX score of 8, USB is exhibiting near-term strength against the asset classes.
Disclaimer: SIACharts Inc. specifically represents that it does not give investment advice or advocate the purchase or sale of any security or investment whatsoever. This information has been prepared without regard to any particular investors investment objectives, financial situation, and needs. None of the information contained in this document constitutes an offer to sell or the solicitation of an offer to buy any security or other investment or an offer to provide investment services of any kind. As such, advisors and their clients should not act on any recommendation (express or implied) or information in this report without obtaining specific advice in relation to their accounts and should not rely on information herein as the primary basis for their investment decisions. Information contained herein is based on data obtained from recognized statistical services, issuer reports or communications, or other sources, believed to be reliable. SIACharts Inc. nor its third party content providers make any representations or warranties or take any responsibility as to the accuracy or completeness of any recommendation or information contained herein and shall not be liable for any errors, inaccuracies or delays in content, or for any actions taken in reliance thereon. Any statements nonfactual in nature constitute only current opinions, which are subject to change without notice.