
by Talley Léger Sr. Investment Strategist, Invesco Canada
It’s hard to believe that roughly one year has passed since the outbreak of the novel coronavirus (COVID-19). Equally astonishing is the fact that the broad U.S. stock market has kept pressing to new highs, alongside forceful blasts of central bank liquidity and government stimulus checks.
Given such a powerful move in “risk” assets off their early 2020 lows, many investors may be naturally wondering how long the “recovery” trade can last. Should they be selling the rallies or buying the dips?
To answer that question, I looked at the average length of the “recovery” trade across asset, sector, size, style, and regional allocations since the 1980s. Specifically, I measured the number of years “risk” assets (e.g., stocks, cyclical sectors, small-caps, value stocks, and emerging markets) outperformed their “defensive” counterparts (e.g., bonds, counter-cyclical sectors, large-caps, growth stock, and developed markets) from the lows near the last four economic recessions to the highs for each business cycle (Figure 1).
Figure 1: History suggests it’s far too soon for the “recovery” trade to end
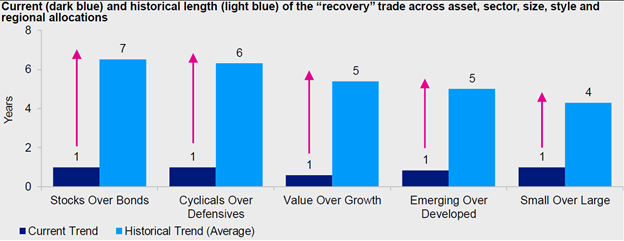
Sources: Bloomberg L.P., Invesco, Feb. 16, 2021. Note: Length = number of years passed from recessionary trough to business cycle peak of each ratio. Economic recessions are defined by the National Bureau of Economic Research (NBER) as a significant decline in activity across the economy, lasting more than a few months. The last four recessions occurred in the early 1980s, 1990s, 2000s, and late 2000s. A business cycle is comprised by a recovery and ensuing expansion, bookended by two economic recessions. Stocks as represented by the S&P 500 Total Return Index, bonds as represented by the Bloomberg Barclays U.S. Treasury 7-10 Year Total Return Index, cyclical/defensives measured by the S&P 500 Cyclicals/Defensive Sectors, value as represented by the Russell 3000 Value Index, growth as represented by the Russell 3000 Growth Index, emerging markets as represented by the MSCI Emerging Markets Index, developed markets as represented by the MSCI World index, small caps as represented by the Russell 2000 Index, large caps as represented by the S&P 500 Index. An investment cannot be made into an index. Past performance does not guarantee future results.
Encouragingly, I found that the “recovery” trade in its many forms lasted between four years (in the case of small- over large-caps) and a whopping seven years (in the case of stocks over bonds)!
For those investors who are considering pulling the plug on “risk” assets in general and stocks in particular, the message is simple. History suggests it’s far too soon for the “recovery” trade to end. Indeed, these market trends should be considered in terms of years, not months. If past is prologue, I think “risk” assets should have plenty of time to keep working.
My recent chartbook, Should investors buy the dips?[CC1] [CC2] , takes a deeper dive into each aspect of the “recovery” trade, and other reasons why I believe we remain in the early stages of the current cyclical advance.
[CC1]This is being submitted by Ashley Wenyeve under a different log number (NA 2029). It has already been approved in the U.S.
[CC2]Approved for Canada by Jeff Pennell (NA 2029)
This post was first published at the official blog of Invesco Canada.