by Don Vialoux, EquityClock.com
The Bottom Line
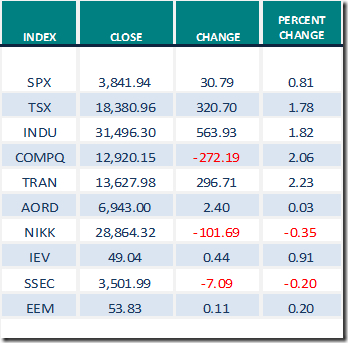
North American equity indices moved higher last week with all of the gains occurring from 11:00 AM EST to the close on Friday. Greatest influences on North American equity markets remain growing evidence of a second wave of the coronavirus (negative) and timing of distribution of a vaccine (positive).
Observations
TSX Composite Index has a history of outperforming the S&P 500 Index from the end of December to the first week in March. The main reason: Canadian investors focus on contributing to their RRSPs during the first 60 days in the New Year and subsequently invest more funds into the equity market. As indicated in the chart below, average gain per period for the TSX Composite Index relative to the S&P 500 Index during the past 20 periods was 1.5%. This year the performance spread between the S&P 500 Index and TSX Composite Index between December 31st and March 5th widen: The S&P 500 Index gained 3.14% and the TSX Composite Index advanced 5.43% for an advantage of 2.29% by owning the TSX.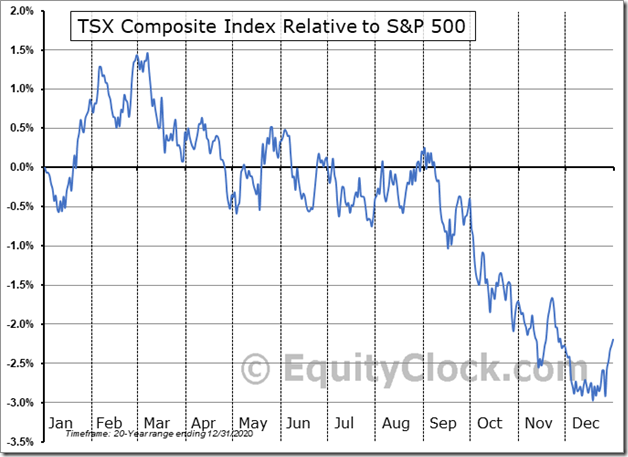
Note that the TSX Composite Index has a history of underperforming the S&P 500 Index between the first week in March and early May.
Short term short term indicators for U.S. equity indices, commodities and sectors (20 day moving averages, short term momentum indicators) recovered strongly after 11:00 AM EST on Friday.
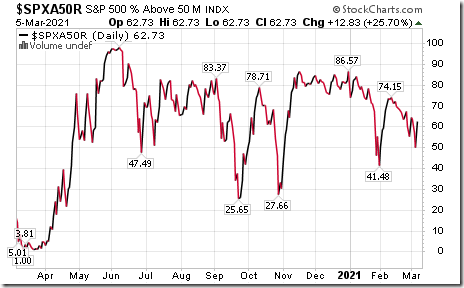
Intermediate term technical indicator for U.S. equity markets (e.g. Percent of S&P 500 stocks trading above their 50 day moving average) moved higher last week. It changed from Neutral to Overbought. See Barometer chart at the end of this report.
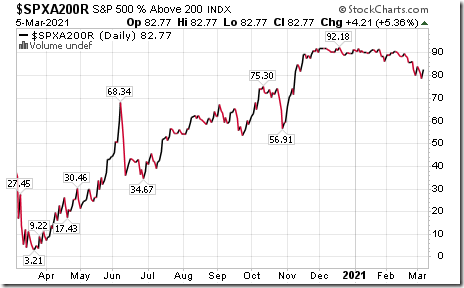
Long term technical indicator for U.S. equity markets (e.g. Percent of S&P 500 stocks trading above their 200 day moving average) moved higher last week. It changed back from Overweight to Extremely Overbought. See chart at the end of this report.
Short term momentum indicators for Canadian indices and sectors also recovered strongly on Friday afternoon.
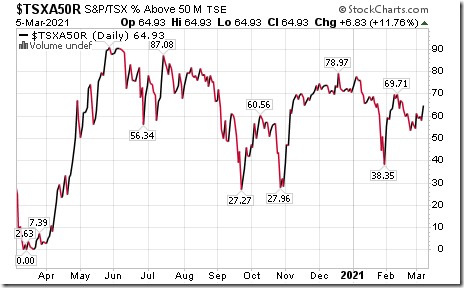
Medium term technical indicator for Canadian equity markets moved higher last week. It changed back from Neutral and Overbought. See Barometer chart at the end of this report.
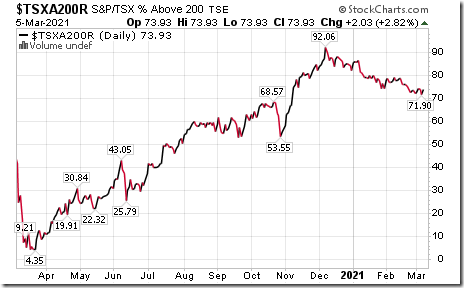
Long term technical indicator for Canadian equity markets (i.e. Percent of TSX stocks trading above their 200 day moving average) moved higher last week. It remains Overbought. See Barometer chart at the end of this report.
Consensus estimates for earnings and revenues by S&P 500 companies turn strongly positive on a year-over-year basis particularly in the first and second quarters of 2021. Moreover, consensus estimates continue to increase. According to www.FactSet.com earnings in the first quarter of 2021 on a year-over-year basis are expected to increase 21.8% (versus previous estimate of 21.2% last week) and revenues are expected to increase 6.1% (versus previous estimate at 6.0%). Earnings in the second quarter are expected to increase 50.0 % (versus previous estimate at 49.7%) and revenues are expected to increase 16.2% (versus previous estimate at 16.1%). Earnings in the third quarter are expected to increase 17.3% (versus previous estimate at 16.9%) and revenues are expected to increase 9.9% (versus previous estimate at 9.7%). Earnings in the fourth quarter are expected to increase 13.3% (versus previous estimate at 13.0%) and revenues are expected to increase 7.1% (versus previous estimate at 7.0%). Earnings for all of 2021 are expected to increase 24.2% (versus previous estimate at 23.9%) and revenues are expected to increase 9.2%.
Economic News This Week
February Consumer Price Index to be released at 8:30 AM EST on Wednesday is expected to increase 0.4% versus a gain of 0.3% in January. Excluding food and energy, February Consumer Price Index is expected to increase 0.2% versus a gain of 0.1% in January.
Bank of Canada announces its interest rate policy at 10:00 AM EST on Wednesday is expected to remain unchanged at 0.25%.
February Producer Price Index to be released at 8:30 AM EST on Friday is expected to increase 0.4% versus a gain of 1.3% in January. Excluding food and energy, February Producer Price Index is expected to increase 0.2% versus a gain of 1.2% in January.
Canadian February Employment to be released at 8:30 AM EST on Friday is expected to drop 47,500 versus a decline of 212,800 in January. February Unemployment Rate is expected to drop to 8.9% from 9.4% in January.
March Michigan Consumer Sentiment Index to be released at 10:00 AM EST on Friday is expected to increase to 78.0 from 76.8 in February.
Earnings News This Week
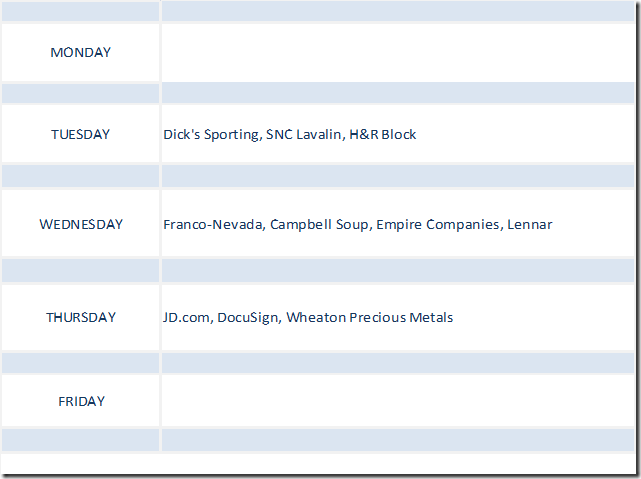
Frequency of quarterly reports by S&P 500 companies and major Canadian companies winds down substantially this week. Only three S&P 500 companies are scheduled to report.
Trader’s Corner
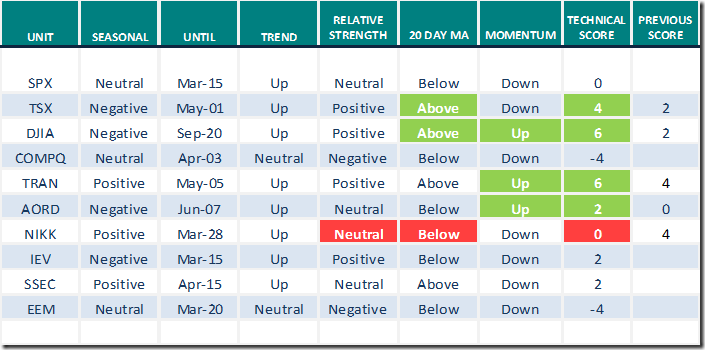
Equity Indices and Related ETFs
Daily Seasonal/Technical Equity Trends for March 5th 2021
Green: Increase from previous day
Red: Decrease from previous day
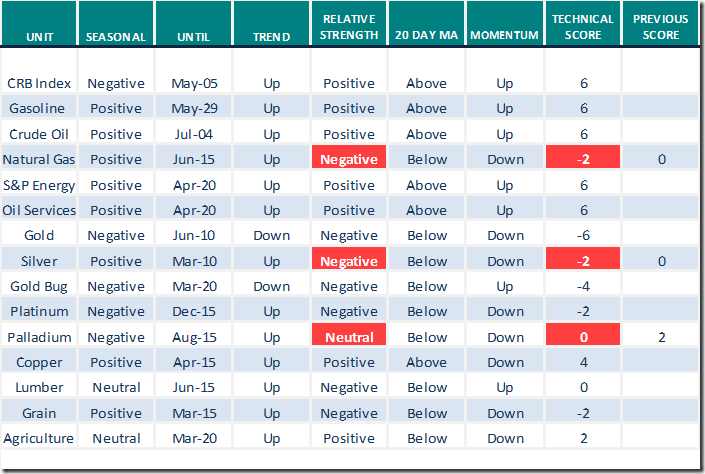
Commodities
Daily Seasonal/Technical Commodities Trends for March 5th 2021
Green: Increase from previous day
Red: Decrease from previous day
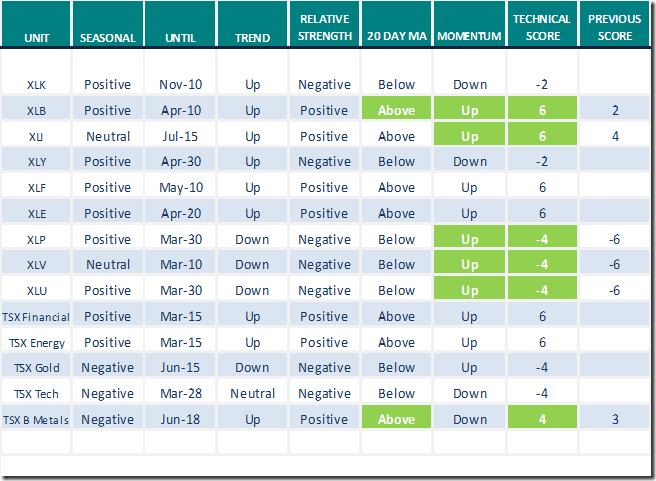
Sectors
Daily Seasonal/Technical Sector Trends for March 5th 2021
Green: Increase from previous day
Red: Decrease from previous day
The Canadian Technician
On Friday, Greg Schnell said, “I’m watching for a low now”. Following is a link:
I’m Watching For A Low Now | The Canadian Technician | StockCharts.com
Interesting discussion on potential impact on equity markets following expiration of the SLR (Supplement Lending Ratio) on March 31st
It’s almost as if the Biden administration and some of the most progressive Democrats out there, want the market to crash.Following is the link:
FDIC Chair Says No Need For SLR Relief (mikesmoneytalks.ca)
Technical Scoop
Thank you to David Chapman and www.EnrichedInvesting.com for access to the following link. Headline reads,” Money push, job rot, low inflation, positive conditions, oversold gold, shorts cut, OPEC cuts”
Technical Scores
Calculated as follows:
Intermediate Uptrend based on at least 20 trading days: Score 2
(Higher highs and higher lows)
Intermediate Neutral trend: Score 0
(Not up or down)
Intermediate Downtrend: Score -2
(Lower highs and lower lows)
Outperformance relative to the S&P 500 Index: Score: 2
Neutral Performance relative to the S&P 500 Index: 0
Underperformance relative to the S&P 500 Index: Score –2
Above 20 day moving average: Score 1
At 20 day moving average: Score: 0
Below 20 day moving average: –1
Up trending momentum indicators (Daily Stochastics, RSI and MACD): 1
Mixed momentum indicators: 0
Down trending momentum indicators: –1
Technical scores range from -6 to +6. Technical buy signals based on the above guidelines start when a security advances to at least 0.0, but preferably 2.0 or higher. Technical sell/short signals start when a security descends to 0, but preferably -2.0 or lower.
Long positions require maintaining a technical score of -2.0 or higher. Conversely, a short position requires maintaining a technical score of +2.0 or lower
Changes Last Week
Technical Notes for Friday March 5th
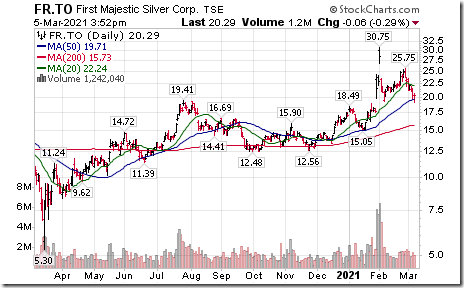
Precious metal stocks remain under technical pressure. First Majestic Silver (FR) moved below $19.24 Cdn. completing a double top pattern.
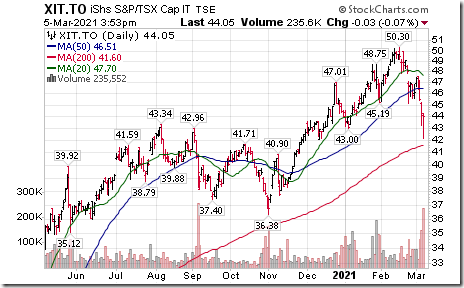
TSX Technology iShares (XIT) moved below $43.00 extending an intermediate downtrend.
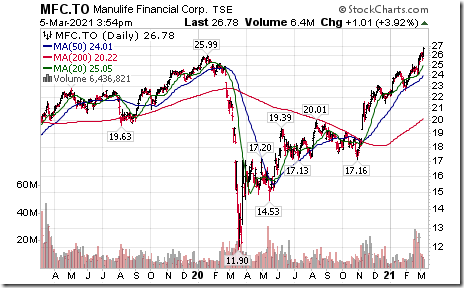
ManuLife (MFC), a TSX 60 stock moved above $25.99 to an all-time high extending an intermediate uptrend.
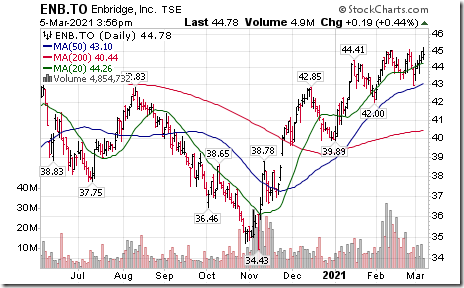
Enbridge (ENB), a TSX 60 stock moved above $45.01 extending an intermediate uptrend.
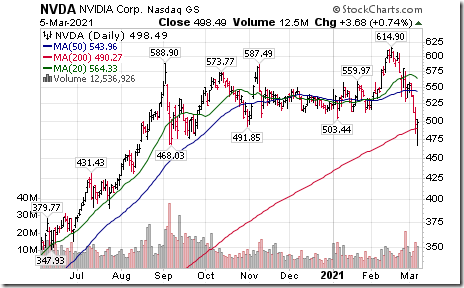
Nvidia (NVDA), a NASDAQ 100 stock moved below $503.44, $491.85 and $468.03 setting an intermediate downtrend.
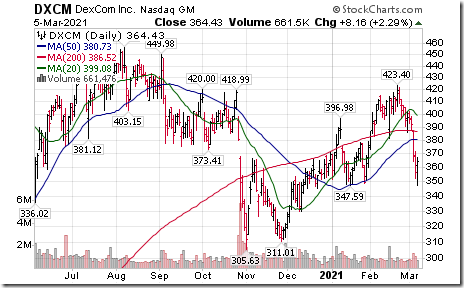
DexCom (DXCM), a NASDAQ 100 stock moved below intermediate support at $347.59.
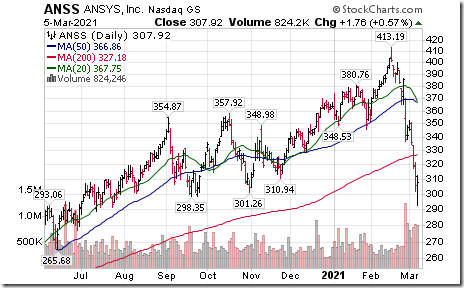
ANSYS (ANSS), a NASDAQ 100 stock moved below $298.35 extending an intermediate downtrend.
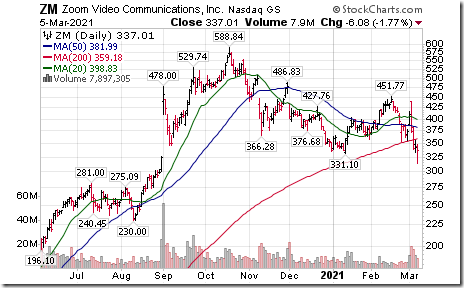
Zoom (ZM), a NASDAQ 100 stock moved below $331.10 extending an intermediate downtrend.
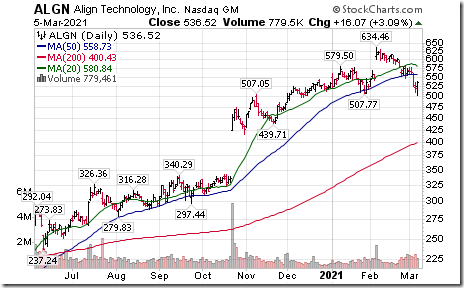
Align Tech (ALGN), a NASDAQ 100 stock moved below intermediate support at $507.77.
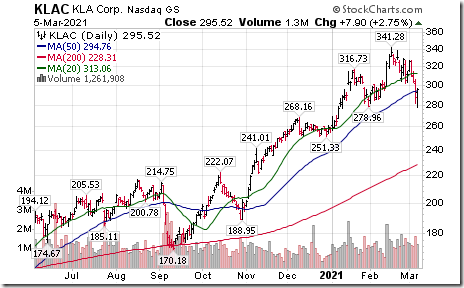
KLA Tencor (KLAC), a NASDAQ 100 stock moved below intermediate support at $278.96.
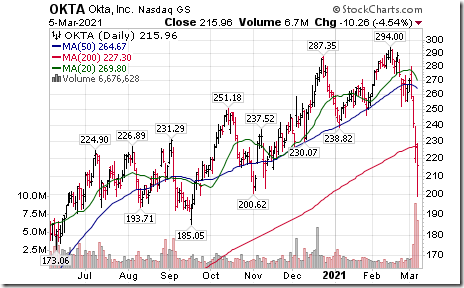
Okta (OKTA), a NASDAQ 100 stock moved below $200.62 extending an intermediate downtrend.
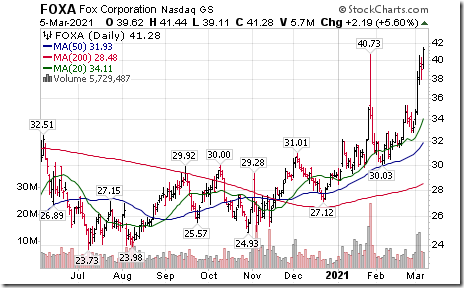
Fox A (FOXA), an S&P 100 stock moved above $40.73 extending an intermediate uptrend.
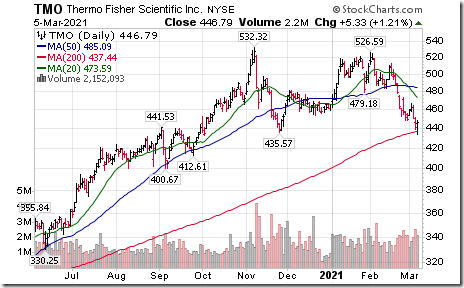
Thermo Fisher (TMO), an S&P 500 stock moved below $435.57 completing a double top pattern.
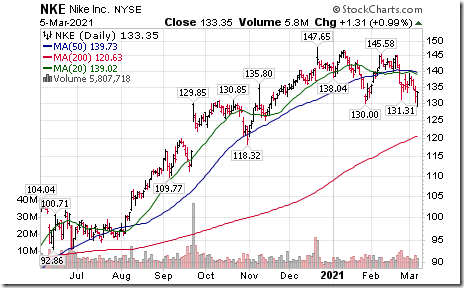
Nike (NKE), a Dow Jones Industrial Average stock moved below $130.00 completing a double top pattern.
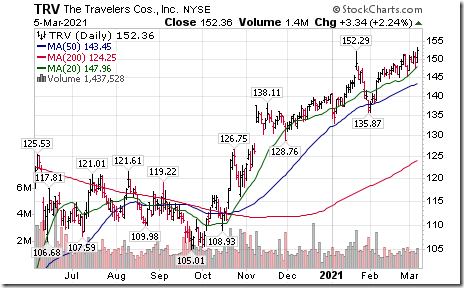
Travelers (TRV), a Dow Jones Industrial Average stock moved above $152.29 to an all-time high extending an intermediate uptrend.
S&P 500 Momentum Barometer
The intermediate Barometer advanced 12.83 on Friday and 7.22 last week to 62.73. It changed from Neutral to Overweight on a recovery above the 60.00 level.
The long term Barometer added 4.21 on Friday and 2.81 last week to 82.77. It changed back on Friday from Overbought to Extremely Overbought on a move back above 80.00.
TSX Momentum Barometer
The intermediate Barometer advanced 6.83 on Friday and 10.34 last week to 64.93. It changed on Friday from Neutral to Overbought on a recovery above 60.00.
The long term Barometer added 2.03 on Friday and 0.47 last week to 73.93. It remains Overbought.
Disclaimer: Seasonality and technical ratings offered in this report and at
www.equityclock.com are for information only. They should not be considered as advice to purchase or to sell mentioned securities. Data offered in this report is believed to be accurate, but is not guaranteed
This post was originally publised at Vialoux's Tech Talk.


