by Don Vialoux, EquityClock.com
The Bottom Line
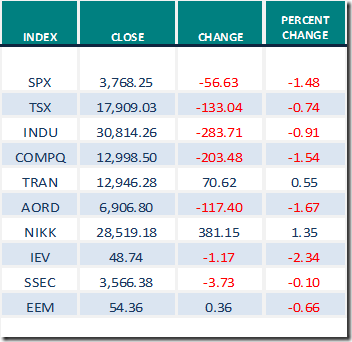
North American equity indices moved lower last week while Asian indices moved higher. Greatest influences on North American equity markets remain growing evidence of a second wave of the coronavirus (negative) and timing of distribution of a vaccine (positive). Note comment on Asian equity indices offered by Greg Schnell at This Makes 4! | The Canadian Technician | StockCharts.com.
Observations
The Dow Jones Industrial Average and S&P 500 Index have followed their historic trend following a U.S. Presidential Election. The strongest 12 week period during the four year U.S. Presidential Cycle has occurred from U.S. Presidential Election Day to Inauguration Day on January 20th. Since Election Day last year, the Dow Jones Industrial Average has advanced 12.1%, the S&P 500 Index has gained 12.4%.and the TSX Composite Index has increased.12.4%. Short term technical evidence by U.S. equity indices (Stochastics, MACD, RSI) suggest that the U.S. Presidential Election trade for the current period has just ended. 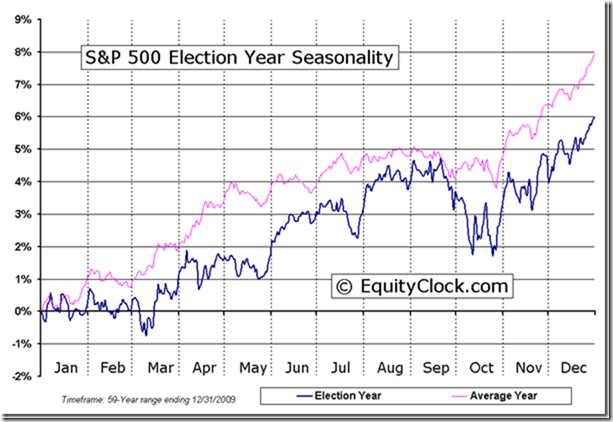
“Santa Claus Hangover” has arrived on schedule. Following is a link to a recent video by Larry Williams that explains the “Santa Claus Rally” as well as the “Santa Claus Hangover” in the U.S. equity market:
Santa Claus Rally Exposed | Larry Williams | Real Trading Special (12.07.20) – YouTube
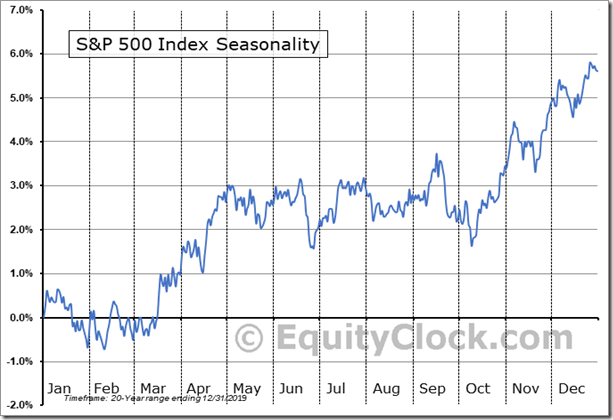
On average, the S&P 500 Index during the past 20 periods from January 8th to February 14th has dropped 1.5% per period. Effectively, on average, all of the historic gains recorded during the Santa Claus Rally period were lost during the Santa Claus Hangover period. This is the time of year when U.S. consumers and investors are paying down debts accrued during the Santa Claus Rally period.
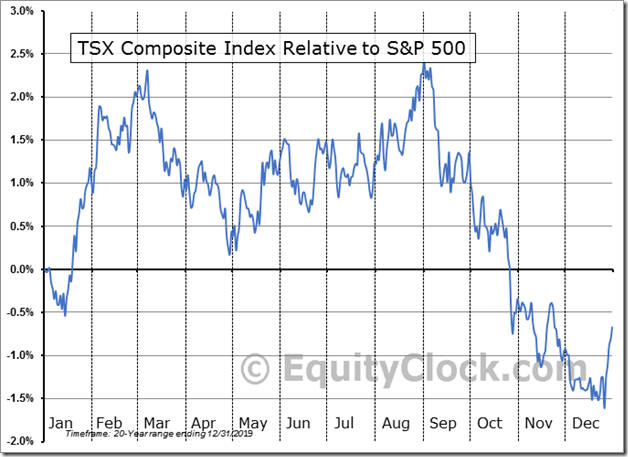
Note that the “Santa Claus Hangover” normally does not happen in the Canadian equity market. The main reason: Canadian investors focus on contributing to their RRSPs during the first 60 days in the New Year and subsequently invest more funds into the equity market. Strongest period in the year for the TSX Composite Index relative to the S&P 500 Index is from mid-December to the first week in March. As indicated in the chart below, average gain per period for the TSX Composite Index relative to the S&P 500 Index during the past 20 periods was 3.3%. Performance of the TSX Composite Index relative to the S&P 500 Index since December 30th provides evidence that history is repeating during the current period.
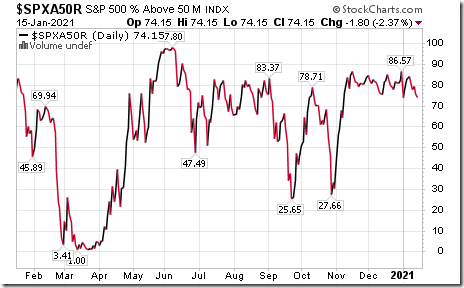
Medium technical indicator for U.S. equity markets (e.g. Percent of S&P 500 stocks trading above their 50 day moving average) moved lower again last week. It changed last week from extremely intermediate overbought above 80.00% to intermediate overbought on a move below 80%. See Barometer chart at the end of this report.
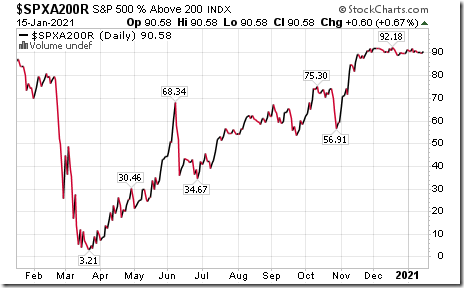
Long term technical indicator for U.S. equity markets (e.g. Percent of S&P 500 stocks trading above their 200 day moving average).was virtually unchanged last week at extremely overbought levels. See chart at the end of this report.
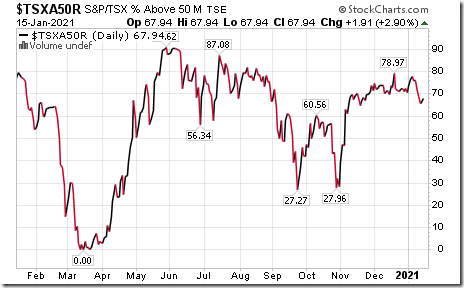
Medium term technical indicator for Canadian equity markets moved lower last week. It remained intermediate overbought. See Barometer chart at the end of this report.
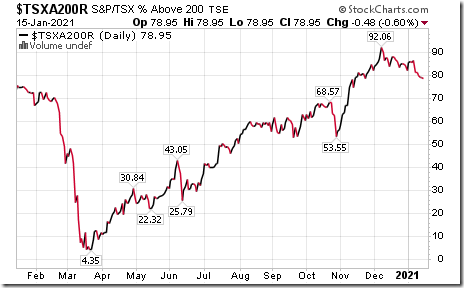
Long term technical indicators for Canadian equity markets (i.e. Percent of TSX stocks trading above their 200 day moving average) also moved lower again last week from extremely overbought levels above 80.00 to overbought levels below 80.00. Short term trend remains down. See Barometer chart at the end of this report.
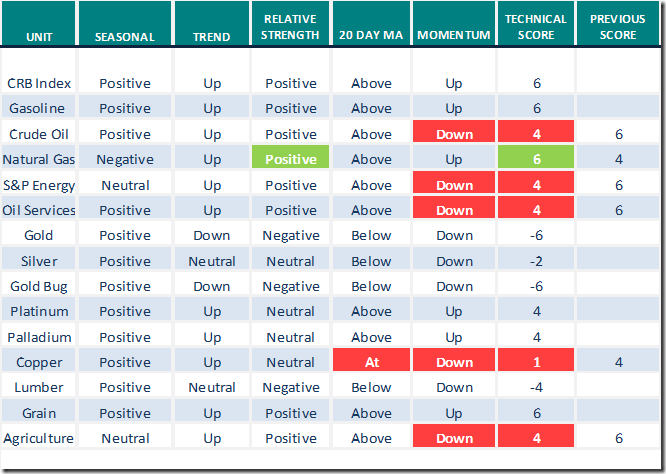
Short term short term momentum indicators for U.S. markets/commodities/sectors (20 day moving averages, short term momentum indicators) moved lower last week, notably on Friday
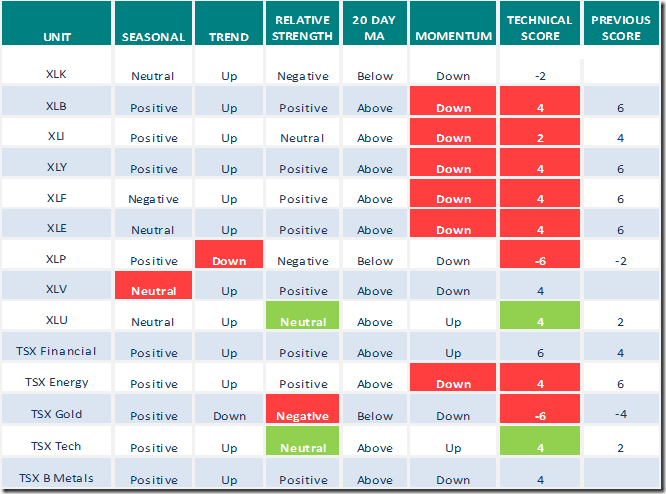
Short term momentum indicators for Canadian markets/sectors also were mixed last week. Notable were strength in financials and technology and weakness in gold.
Year-over-year 2020 consensus earnings declines by S&P 500 companies ebbed again from last week. According to www.FactSet.com, fourth quarter earnings are expected to drop 6.8% on a year-over-year basis (versus previous 8.8% decline) and revenues are expected to increase 0.3% (versus previous 0.4% increase). Earnings for all of 2020 are expected to fall 12.9% (versus previous 13.3% decline) and revenues are expected to decline 1.7% (versus previous 1.6% decline).
Consensus estimates for earnings and revenues by S&P 500 companies turn positive on a year-over-year basis in the first quarter of 2021. According to www.FactSet.com earnings in the first quarter of 2021 on a year-over-year basis are expected to increase 16.8% (versus previous 16.5% increase last week) and revenues are expected to increase 3.9%. Earnings in the second quarter are expected to increase 46.3 % (versus previous 46.1% increase) and revenues are expected to increase 14.2% (versus previous 14.1% increase). Earnings for all of 2021 are expected to increase 22.5% (versus previous 22.6% increase) and revenues are expected to increase 8.1% (versus previous 8.2% increase).
Economic News This Week
Monday is a holiday for U.S. equity markets
Canadian December Consumer Price Index to be released at 8:30 AM EST on Wednesday is expected to increase 1.0% on a year-over-year basis, unchanged from last year.
Bank of Canada’s Overnight Lending Rate for major Canadian Banks to be released at 10:00 AM EST on Wednesday is expected to remain unchanged at 0.25%.
December U.S. Housing Starts to be released at 8:30 AM EST on Thursday are expected to increase to 1.564 million units from 1.547 million units in November.
Weekly Initial Jobless Claims to be released at 8:30 AM EST on Thursday are expected to drop to 868.000 from 965,000 last week.
Canadian November Retail Sales to be released at 8:30 AM EST on Friday are expected to increase 0.1% versus a gain of 0.4% in October. Excluding auto sales, Canadian November Retail Sales are expected to increase 0.3% versus a gain of 1.0% in October.
December Existing Home Sales to be released at 10:00 AM EST on Friday are expected to slip to 6.54 million units from 6.69 million units in November.
Selected Earnings News This Week
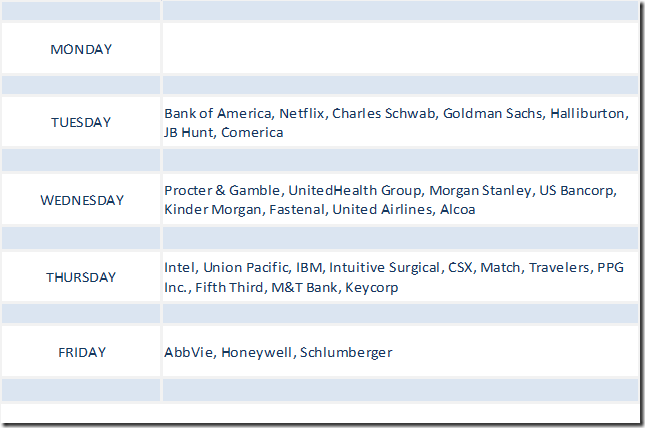
Another 40 S&P 500 companies (and six Dow Jones Industrial Average companies) are scheduled to report quarterly results this week
Trader’s Corner
Equity Indices and Related ETFs
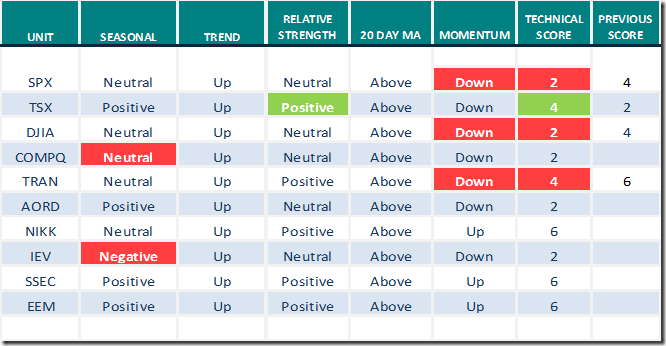
Daily Seasonal/Technical Equity Trends for January 15th 2021
Green: Increase from previous day
Red: Decrease from previous day
Commodities
Daily Seasonal/Technical Commodities Trends for January 15th 2021
Green: Increase from previous day
Red: Decrease from previous day
Sectors
Daily Seasonal/Technical Sector Trends for January 15th 2021
Green: Increase from previous day
Red: Decrease from previous day
Technical Scores
Calculated as follows:
Intermediate Uptrend based on at least 20 trading days: Score 2
(Higher highs and higher lows)
Intermediate Neutral trend: Score 0
(Not up or down)
Intermediate Downtrend: Score -2
(Lower highs and lower lows)
Outperformance relative to the S&P 500 Index: Score: 2
Neutral Performance relative to the S&P 500 Index: 0
Underperformance relative to the S&P 500 Index: Score –2
Above 20 day moving average: Score 1
At 20 day moving average: Score: 0
Below 20 day moving average: –1
Up trending momentum indicators (Daily Stochastics, RSI and MACD): 1
Mixed momentum indicators: 0
Down trending momentum indicators: –1
Technical scores range from -6 to +6. Technical buy signals based on the above guidelines start when a security advances to at least 0.0, but preferably 2.0 or higher. Technical sell/short signals start when a security descends to 0, but preferably -2.0 or lower.
Long positions require maintaining a technical score of -2.0 or higher. Conversely, a short position requires maintaining a technical score of +2.0 or lower
Changes Last Week
Technical Notes for January 15th
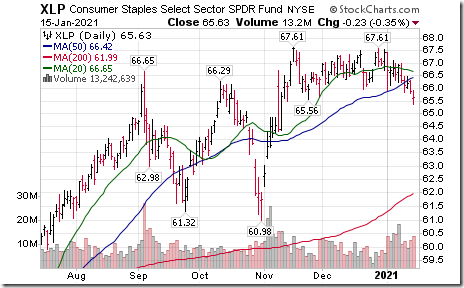
Consumer Staples iShares (XLP) moved below $65.56 completing a double top pattern.
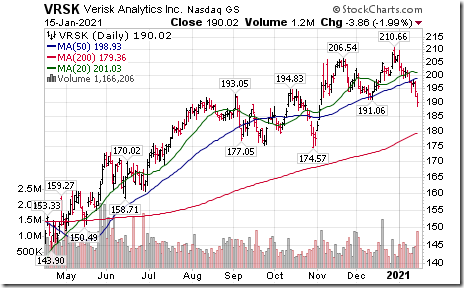
Verisk Analytics (VRSK), a NASDAQ 100 stock moved below $191.06 completing a double top pattern.
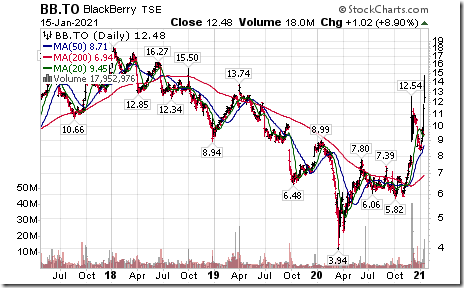
Blackberry (BB), a former TSX 60 stock moved above Cdn$12.54 and US$9.69 to a 28 month high extending an intermediate uptrend. The company sold 90 patents linked to smart phone technology to Huawai.
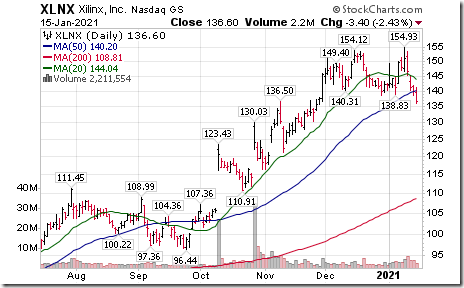
Xilinx (XLNX), a NASDAQ 100 stock moved below $138.56 completing a double to pattern.
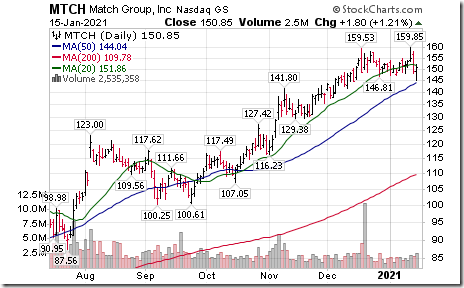
Match (MTCH), a NASDAQ 100 stock moved below $146.81 completing a double top pattern.
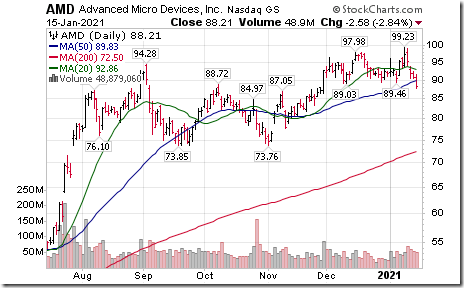
Advanced Micro Devices (AMD), a NASDAQ 100 stock moved below $89.43 completing a double top pattern.
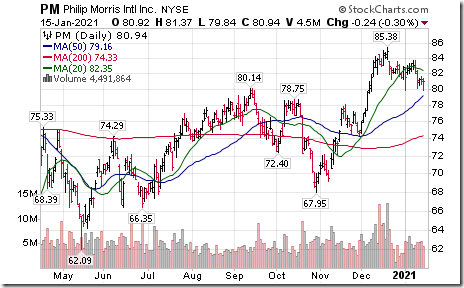
Philip Morris International (PM), an S&P 100 stock moved below $79.86 completing a double top pattern.
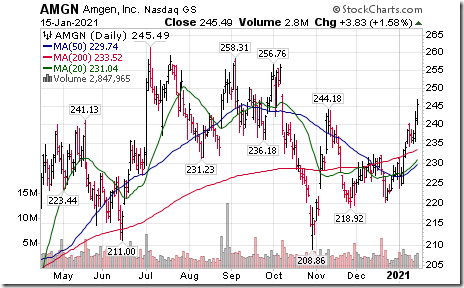
Amgen (AMGN), a NASDAQ 100 stock moved above $244.18 resuming an intermediate uptrend.
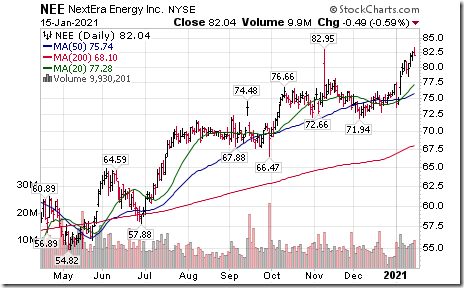
NextEnergy (NEE), an S&P 100 stock moved above $82.95 to an all-time high extending an intermediate uptrend.
S&P 500 Momentum Barometers
The intermediate Barometer dropped 1.80 on Friday and 9.82 last week to 74.15. It changed last week from extremely intermediate overbought above 80.00 to intermediate overbought. It also shows technical signs of moving lower from its peak set on December 30th
The long term Barometer added 0.60 on Friday, but slipped 0.40 last week to 90.58. It remains extremely intermediate overbought above the 80.00 level and has yet to show significant signs of a short term roll over.
TSX Momentum Barometers
The intermediate Barometer added 1.91 on Friday, but dropped 8.25 last week to 67.94. It remains intermediate overbought. Its short term trend has turned down.
The long term Barometer slipped 0.48 on Friday and dropped 5.24 last week to 78.95. It changed last week from extremely long term overbought to long term overbought on a move below 80.00. Its short term trend remains down.
Disclaimer: Seasonality and technical ratings offered in this report and at
www.equityclock.com are for information only. They should not be considered as advice to purchase or to sell mentioned securities. Data offered in this report is believed to be accurate, but is not guaranteed
This post was originally publised at Vialoux's Tech Talk.


