After 11 years of leadership, a shift to small-cap, value, and non-US stocks is possible.
by Jurrien Timmer, Director, Global Macro, Fidelity Investments
Key takeaways
- Markets have been trading sideways, weighing a rise in COVID cases, and the resultant need for more fiscal relief, against the promise of vaccines, which might ironically lessen that need.
- If the economy continues to recover, value stocks, small-cap stocks, and non-US stocks may continue to outperform, especially if complemented by a weak dollar and ongoing support from the Fed.
- But will value continue to outperform growth? History suggests that’s possible if inflation picks up.
Financial markets spent last week churning in a narrow range, as investors juxtaposed worsening near-term news on COVID-19—and the implications this has for the economy and therefore, the need for more fiscal/monetary intervention—against increasingly promising developments on vaccines, which ironically seem to be reducing the political urgency to extend this fiscal policy bridge. A catch-22.
The result: a sideways market in which the "reopen" vs. "stay-at-home" battle has been put on hold for now.
Economically speaking, what's at stake in the debate over fiscal stimulus is the pace and linearity with which the US and global economy can continue to close the massive output gap (the difference between potential and real growth) that was opened back in March when the world went into lockdown.
For the US, the output gap has been reduced from −9.8% in Q2 to −3.5% in Q3, which is an impressive feat over such a short time span. But with COVID cases surging again and various countries and states going back into some form of lockdown, the risk is that the path back to full capacity and full employment may take longer and be more jagged than seemed likely a few months ago.
Remember, just before COVID the output gap was +1.2% (i.e., the economy was running above potential), so even with the Q3 improvement the economy remains 4.7 percentage points below its pre-COVID level.
While China has more than made up its gap, the rest of the world and especially Europe and North America remain far behind. While the US has dipped only slightly in recent weeks, Europe has lost more ground.
With China's economy making up all its lost ground, the dollar making new lows, and the Fed keeping financial conditions even looser than they were in 2018, emerging market (EM) equities have continued to outperform. For the first time in over 2 years the MSCI EM Index is outperforming the S&P 500 on a year-over-year basis. There may be more to come, I think.
Will the reopen trade win?
As for the reopen trade, my guess is that investors will continue to look past the current rise in COVID cases and on to the prospects for better days in 2021 and 2022. If the output gap continues to close, it suggests that value and small caps and non-US equities should continue to outperform growth and large caps and US equities.
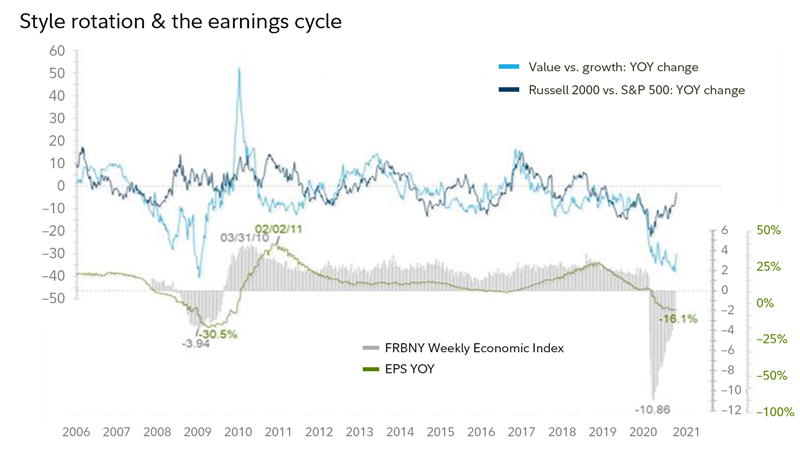
The chart below illustrates this as well. It shows that the New York Fed’s weekly economic index (WEI) continues to improve at a steady pace, along with earnings estimates. Given the mean-reverting nature of value-vs.-growth and small-vs.-large, and their rough correlation with the WEI, this suggests that the recovery in small caps and cyclicals (and non-US equities) could continue well into 2021.
Past performance is no guarantee of future results. Weekly data as of 11/22/2020. Data source: FMRCo, Bloomberg.
A secular fork in the road
But how will the value side of the ledger do past the next few months? Does a more sustainable period of outperformance lie in store, or will this end up as just another frustrating head fake for the value crowd? I don't have the answer, but perhaps we can learn something by reviewing where we are on the secular road map.
The chart below shows the inflation-adjusted total return for the S&P 500 since 1871. You can see the secular bear markets and secular bull markets clearly interspersed. Ever since the index started making new all-time highs in the spring of 2013, it has been my thesis that we are in a secular bull market which at 11 years old is only in its fifth or sixth inning. The double-digit compound annual growth rate (CAGR), the short and swift bear markets followed by robust recoveries to new highs, and the steady expansion in valuation multiples, all spell "secular bull" in my view.
Past performance is no guarantee of future results. Monthly data as of 11/22/2020. Source: Haver, FactSet, Robert Shiller, FMRCo.
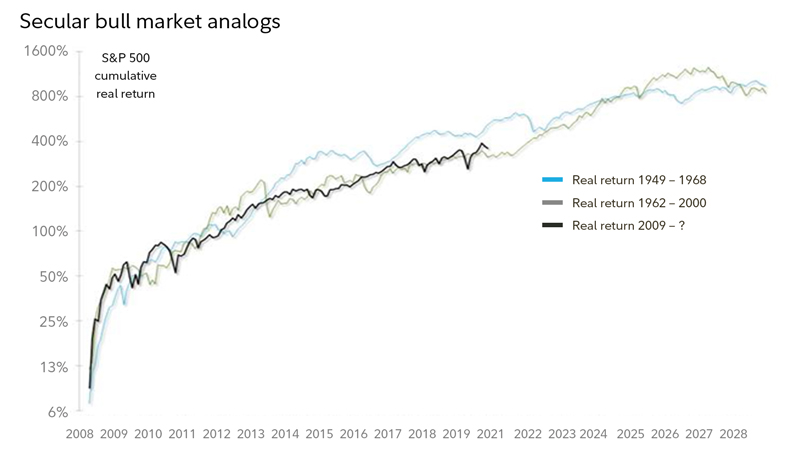
Below you can see that the post-global financial crisis (GFC) bull market continues to closely track the secular bull markets of 1949–1968 and 1982–2000. It's a sample size of only 2, but the analog suggests we may have a ways to go still.
Past performance is no guarantee of future results. Monthly data as of 11/22/2020. Source: Haver, FactSet, FMRCo.
What does this all mean for the question of style rotation?
Is this the 1960s or the 1990s? Given that we have already experienced a parabolic outperformance phase for large-cap growth, I like the 1949–1968 analog here, in which case we are somewhere in the early 1960s.
One important distinction between the 1960s and 1990s is that the 1960s produced a secular upturn in inflation, while the 1990s saw no such inflection point. The growth/value trade likely depends on an upturn in inflation from here.
To me the implications are clear: If inflation starts to structurally rise from here (a big if), in all likelihood it will flip the correlation around, from positive (stocks up, yields up) to negative (stocks up, yields down). That's exactly what happened in the early to mid-1960s. If the stocks/bonds correlation flips from here, it could over time have serious implications for the 60/40 paradigm.
As usual, I don't have the answers, but I hope this exercise can at least help frame the question. After 11 years of monolithic leadership by large-cap growth stocks, we have reached a fork in the road.
About the expert

Jurrien Timmer is the director of global macro in Fidelity's Global Asset Allocation Division, specializing in global macro strategy and active asset allocation. He joined Fidelity in 1995 as a technical research analyst.
Copyright © Fidelity Investments


