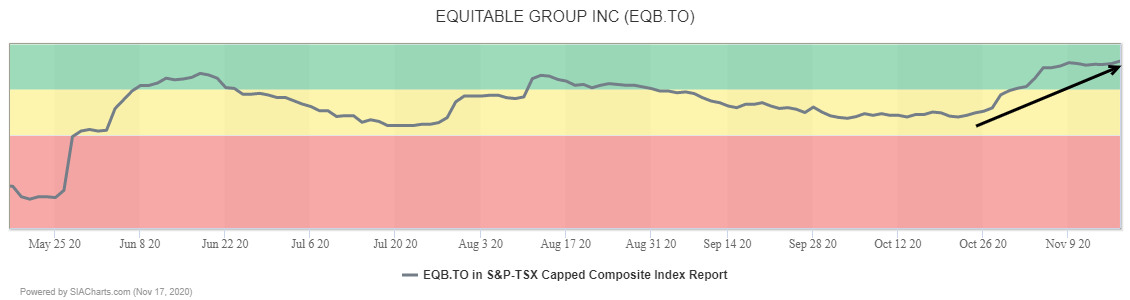
Personal and commercial bank Equitable Group (EQB.TO) recently returned to the Green Favored Zone in the SIA S&P/TSX Composite Index Report and continues to move up the rankings. Yesterday it finished in 23rd place, up 3 spots on the day and up 62 places over the last month.
Equitable Group (EQB.TO) shares have been under steady accumulation since March, shown by a trend of higher lows and a series of bullish Ascending Triangle pattern breakouts. Building on a recent breakout over $85.00, the shares staged a continuation gap above $90.00 recently and have been holding above the top of that gap, indicating continued investor support.
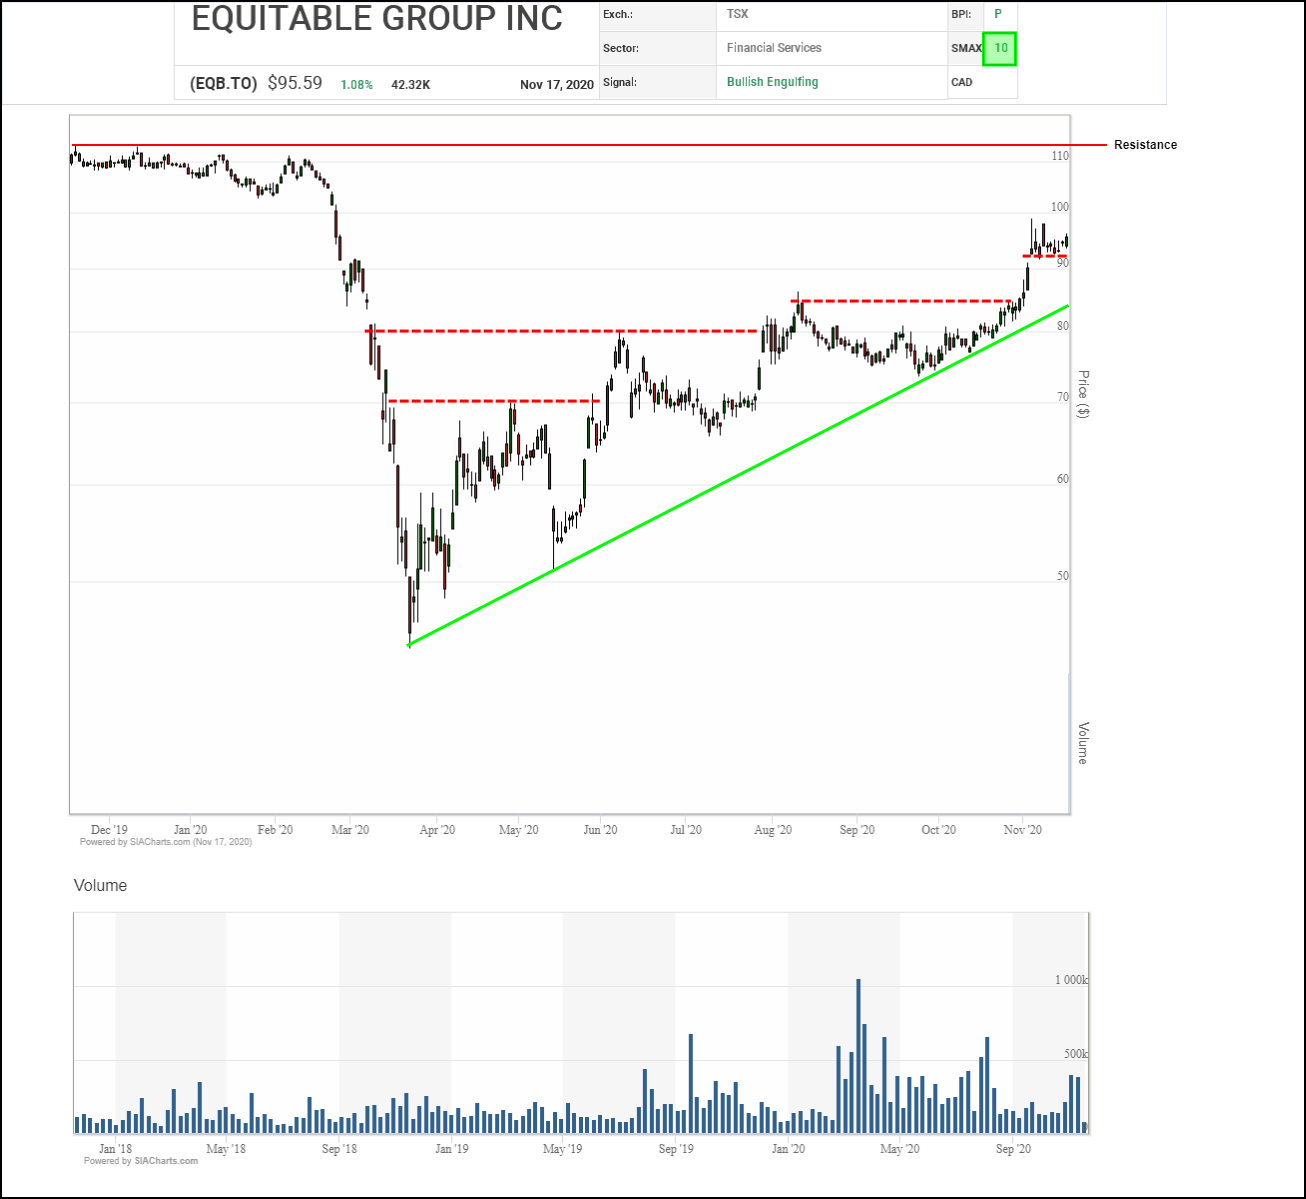
While the $100.00 round number may provide an initial psychological hurdle, the next significant resistance zone on trend appears in the $108.00 to $112.00 area where several measured moves cluster along with the 52-week high. Initial support appears near $92.50, then $85.00 where a recent breakout point and uptrend line support converge.
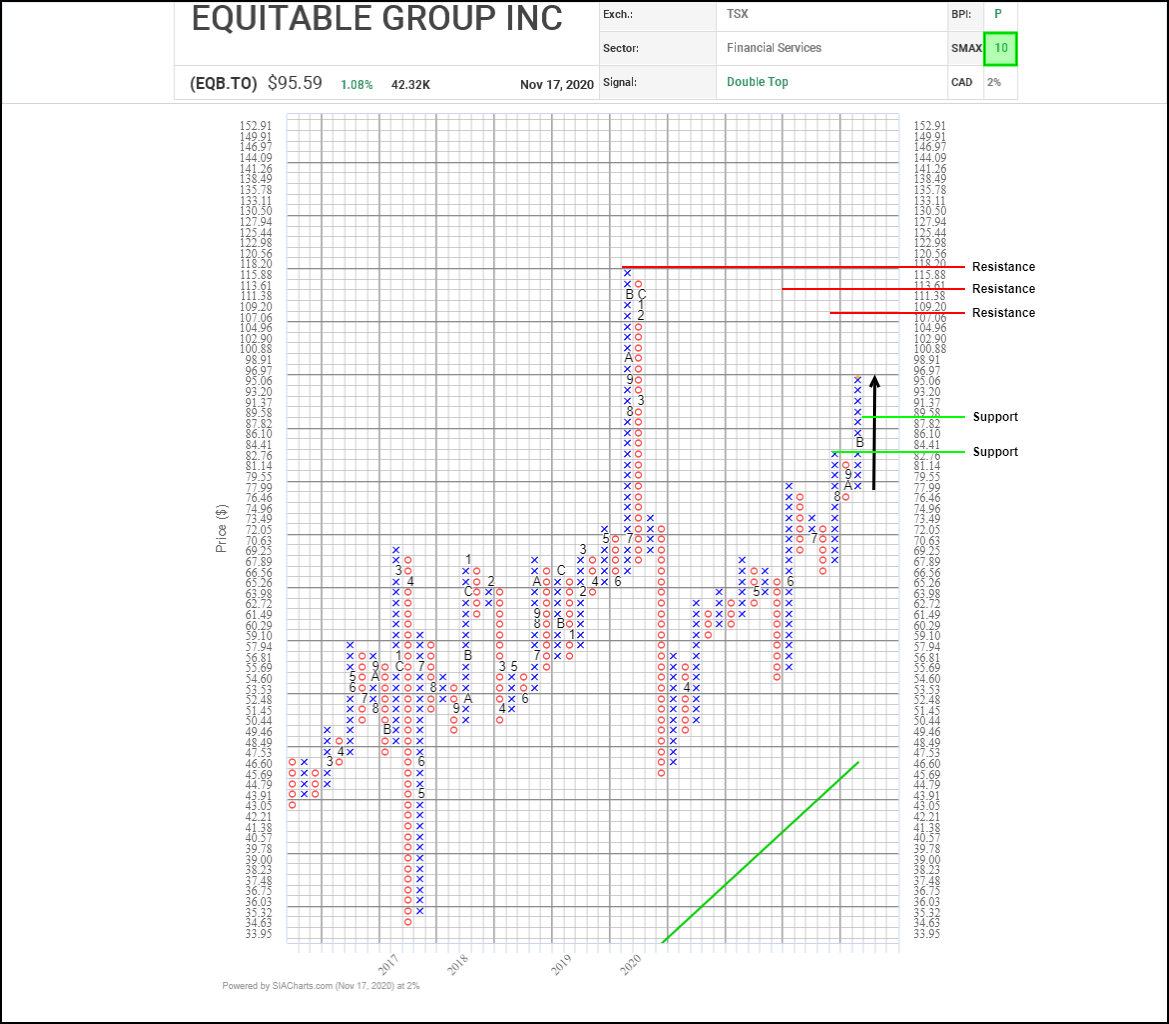
Building on a series of bullish Double Top and Spread Double Top breakouts plus a series of higher column lows, Equitable Group (EQB.TO) shares continue to trend upward.
Initial upside resistance may appear near the $100.00 round number, followed by $109.20 and $113.60 based on horizontal and vertical counts, then November 2019 peak near $118.20. Initial support appears near $87.80.
Disclaimer: SIACharts Inc. specifically represents that it does not give investment advice or advocate the purchase or sale of any security or investment whatsoever. This information has been prepared without regard to any particular investors investment objectives, financial situation, and needs. None of the information contained in this document constitutes an offer to sell or the solicitation of an offer to buy any security or other investment or an offer to provide investment services of any kind. As such, advisors and their clients should not act on any recommendation (express or implied) or information in this report without obtaining specific advice in relation to their accounts and should not rely on information herein as the primary basis for their investment decisions. Information contained herein is based on data obtained from recognized statistical services, issuer reports or communications, or other sources, believed to be reliable. SIACharts Inc. nor its third party content providers make any representations or warranties or take any responsibility as to the accuracy or completeness of any recommendation or information contained herein and shall not be liable for any errors, inaccuracies or delays in content, or for any actions taken in reliance thereon. Any statements nonfactual in nature constitute only current opinions, which are subject to change without notice.