by David Stonehouse, SVP, Head, North American Specialty Investments, AGF Management Ltd.
As we discussed in the first post in this series, the evidence is growing for a cyclical bear bond market. For investors, the obvious next question is how bad it will be. The short answer: probably not that bad.
Let’s consider first what kind of bear market this is likely to be. Over the past three decades, six cyclical bond bear markets have occurred (even as the secular bond bull has continued), so we have a few legitimate historical counterparts to examine when trying to assess the potential length, timing and magnitude of the next one. Here are some takeaways suggested by history:
- How long do cyclical bears last? In general, the bond market cycle (from peak-to-peak or from trough-to-trough) runs for roughly four years, and since the 1980s the bear portion of the cycle (peak-to-trough) has lasted for about 21 months, on average. It seems reasonable to expect that the next cyclical bear will have a duration of between 18 and 30 months.
- How much do yields rise? During cyclical bear markets, 10-year yields have risen by between 50 and 175 basis points (bps); the average is about 110 bps.
- What happens to the yield curve? Historically, the yield curve (which illustrates the spread between long- and short-dated bond yields, usually 10-year and two-year Treasuries) begins to steepen before a recession begins and continues during and after the recession. The steepening typically peaks at between 250 and 275 bps; importantly, much of the early steepening derives not from rising 10-year yields, but from falling two-year yields.
So, if the next bear cycle performs like previous ones, we can expect it to last somewhere between 18 and 30 months, and we might anticipate seeing the 10-year yield rise by about 110 bps. Yet history, while it often rhymes, rarely repeats. And this cyclical bear could be different from others in some important ways.
For instance, we would have expected the 10-year yield to begin its rise earlier (that is, before the recession started in March/April, rather than after) and by more than it has (about 40 bps as of November 9) by now. One reason might be the sudden onset of this recession. Given the unique circumstances surrounding the response to the pandemic, the bond market did not have as much time as usual to anticipate it. Another reason might be the market assumption that the Federal Reserve will maintain near-zero short rates for a long time. Other idiosyncratic forces could serve to suppress yields, as well. High debt levels should constrain growth and debt service capability in the event that yields rise, creating a self-limiting feedback loop. The Fed could follow Japan and implement yield curve controls or negative rates – possibilities the market has to some extent at points in time priced in, albeit modestly. On the flipside, it’s possible a more significant yield surge has just been delayed rather than dampened. Fiscally, if the tenets of modern monetary theory (MMT) were adopted, or, on the monetary side, as the Fed moves to average inflation targeting (AIT), then we can expect tailwinds for bond yields.
Clearly, there are a lot of unknowns. We can, however, apply an informed hypothesis to assess the impact for investors – and to illustrate why we believe it will not be that bad.
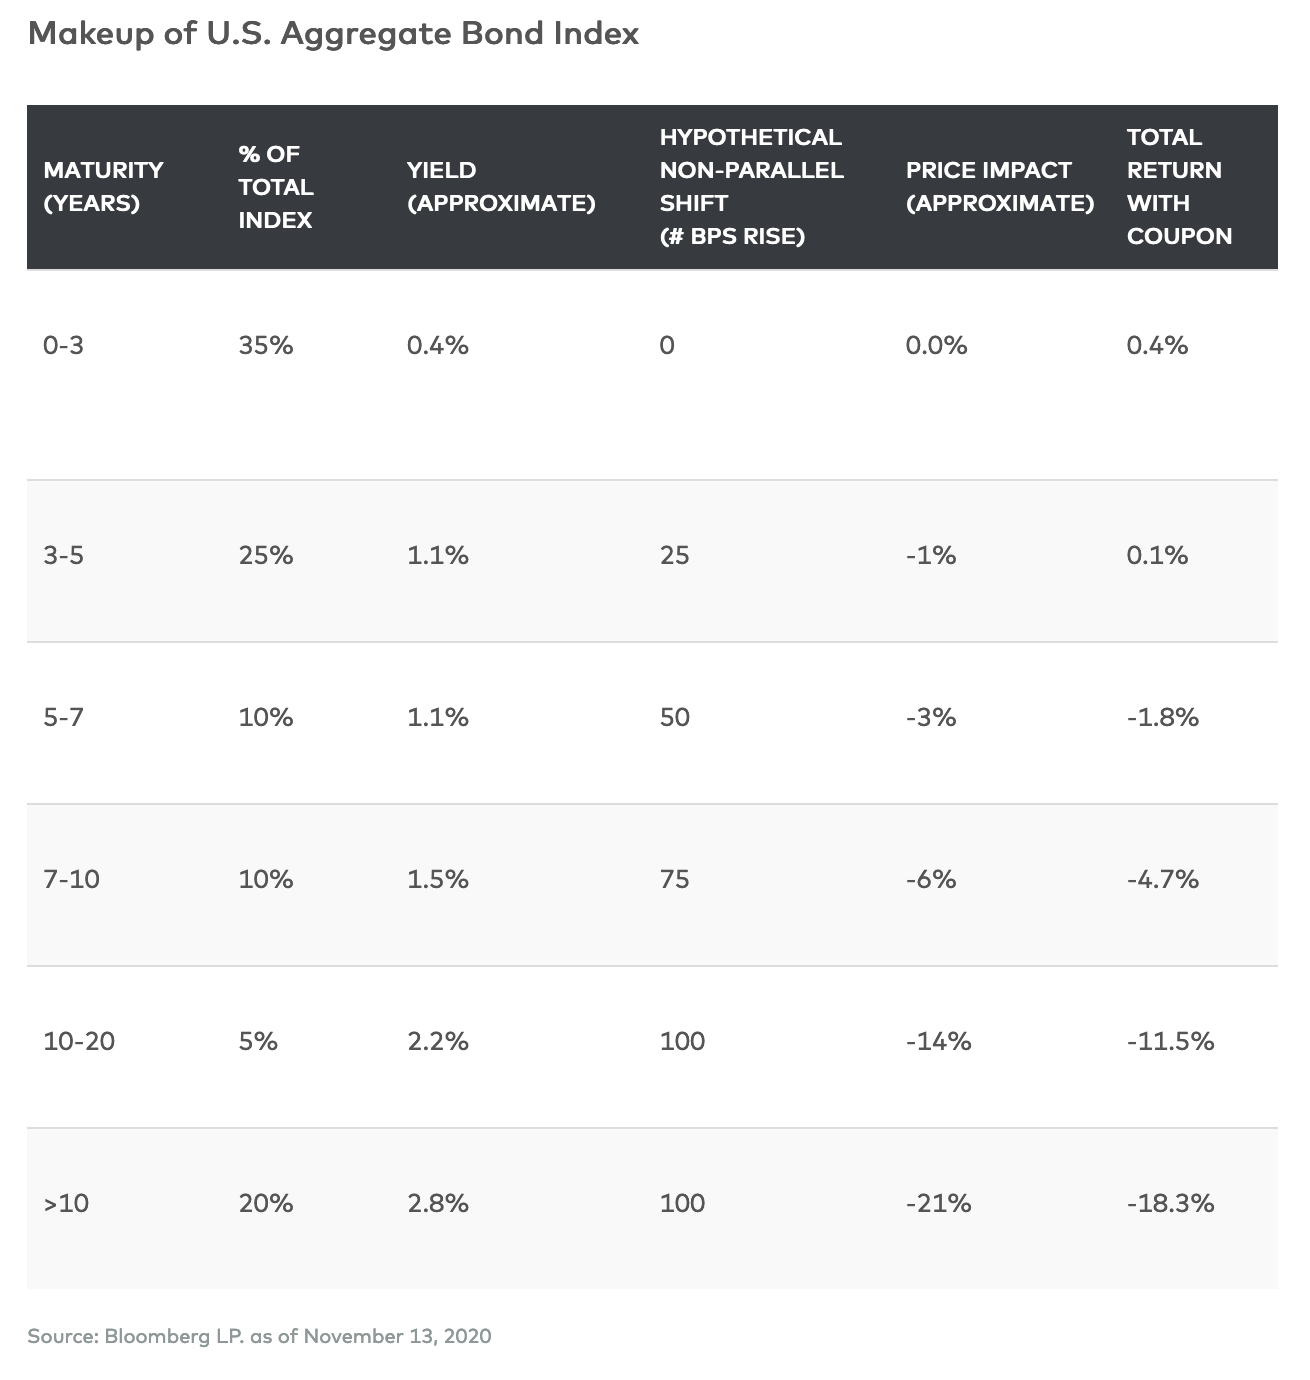
Let’s assume a theoretical rise of 100 basis points (1%) in 10-year Treasury yields on a one-year time horizon (close to the historical norm of 110 bps) and a zero rise in two-year yields (since central banks have pledged to keep short term rates at the zero lower bound for several years), with lesser/greater shifts along different points in the curve. For long bonds with maturities of 20 years or more, that would translate into a price decline of about 20%, for a total loss (net of coupon) of more than 18%. That’s pretty dramatic. Yet on the shorter end of the curve, the declines would be far less – just under 5% for 7-10 years, 2% for 5-7 years, and a net positive return for 0-5 years (all net of coupon).
Now consider the makeup of the U.S. Aggregate Bond Index: 35% is in 0-3s, 25% in 3-5s, and only 20% in 10-year or longer bonds. So while price declines in the 10-30-year portion of the curve might be significant, the overall impact would be far more muted because only a small percentage of the market is in long bonds. As a result, the weighted average impact in our hypothetical scenario would be less than a 4% decline.
As well, remember that corporate bonds comprise about 30% of the aggregate index. Assuming credit spreads tighten, returns on corporates should exceed those of Treasuries, creating a positive effect on the index. So the impact on the index of a 100-bps rise in 10-year yields would be muted even further – depending on how well corporate bonds do, perhaps to somewhere around -3%. Finally, we would not underestimate the challenge the economy still faces of fully returning to pre-pandemic output levels. In addition, central bank purchases of longer-dated bonds could contain the yield curve to a greater extent than previous norms. As a result, bonds may not experience as large a rise in yields as in prior episodes.
That, at least, should give fixed-income investors some comfort. It also provides insight into the nature of a cyclical bond bear market. Compared with its equity counterpart, which can often bring with it broad-based declines well into the double digits, the cyclical bond bear is a beast of a different colour.
David Stonehouse, Senior Vice-President and Head of North American and Specialty Investments, AGF Investments Inc. is a regular contributor to AGF Perspectives.
To learn more about our fixed income capabilities, please click here


